
The SUI price is back on traders’ radars after holding a key higher-timeframe support zone and bouncing sharply from recent lows. According to CryptoPatel, the weekly chart is starting to show signs of re-accumulation after a deep correction from the 2024 highs.
While price has already moved higher, the broader setup indicates this could be the early phase of a larger trend shift. At the time of the analysis, the SUI price was hovering around the $1.80 area, already up roughly 45% from the recent low.
- What the SUI Chart Is Telling Us
- Structure and Momentum Check
- Where SUI Price Could Head Next
What the SUI Chart Is Telling Us
On the weekly chart shared by Patel, the SUI price completed a clear liquidity sweep below previous lows. That move flushed out weaker hands before price quickly reversed, a pattern that often points to smarter positioning behind the scenes. The rebound started inside a strong weekly bullish order block between $1.30 and $1.50, a zone that price respected cleanly.
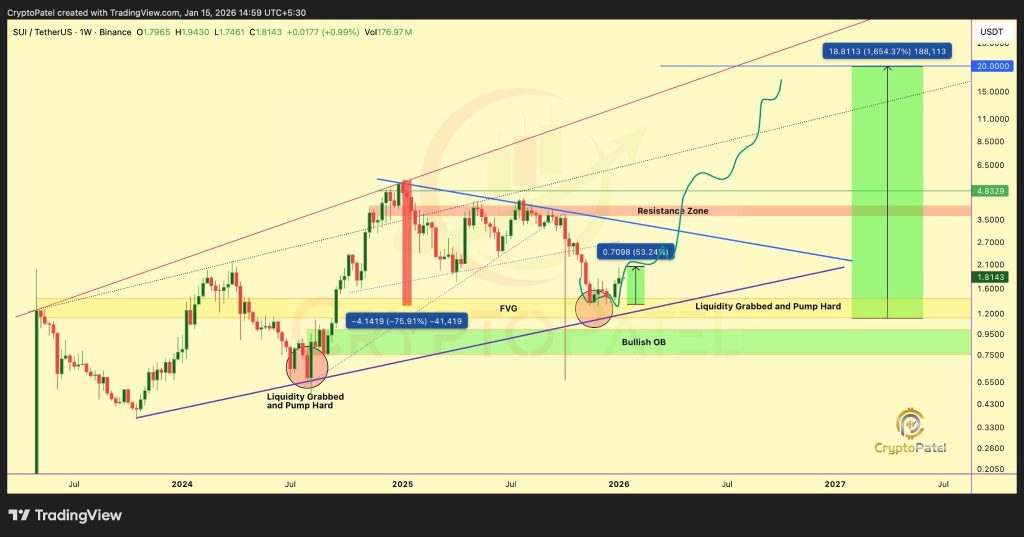
Source: X/@CryptoPatel
What makes this area stand out even more is that it lines up with a fair value gap. That overlap created a strong demand zone, and once price tapped into it, buyers stepped in fast. Since then, the SUI price has been pushing higher, supporting the idea that the market is moving from distribution into re-accumulation.
SUI Short-Term Outlook: Where Could Price Be Headed Next?_**
Structure and Momentum Check
Zooming out, it is clear that SUI is still trading in a rising channel. Despite the recent pullback from 2024 highs, a look at a larger picture indicates that a rising channel is still in play. Instead of a breakdown, a correction in price started right where it mattered.
The nearly 50% bounce from the demand zone shows that downside momentum has eased. As long as the SUI price holds above $1.20 on a weekly close, the bullish structure stays in place. That level now acts as the line in the sand for the bigger picture.
Where SUI Price Could Head Next
CryptoPatel points to upside targets at $5, $10, and even $20, based on the channel structure and historical expansion levels. These moves would not happen in a straight line, but the setup suggests higher prices remain possible if accumulation continues.
For now, the attention is on whether the SUI price can continue to make higher lows and remain above support levels. If so, a correction would only mean a continuation of a correction, and all possibilities are very much alive.
Disclaimer: The information on this page may come from third parties and does not represent the views or opinions of Gate. The content displayed on this page is for reference only and does not constitute any financial, investment, or legal advice. Gate does not guarantee the accuracy or completeness of the information and shall not be liable for any losses arising from the use of this information. Virtual asset investments carry high risks and are subject to significant price volatility. You may lose all of your invested principal. Please fully understand the relevant risks and make prudent decisions based on your own financial situation and risk tolerance. For details, please refer to
Disclaimer.
Related Articles
ADA Retests Historic Support For 200% Rally
Cardano's price is testing a crucial support zone, historically linked to significant recoveries. Analysts observe potential trend shifts, while market sentiment and broader crypto trends, especially Bitcoin's performance, will be key in determining future price movements.
Coinfomania2m ago
Analyst: Three Key Factors Behind Bitcoin's Price "Outperforming Stocks"
Despite the ongoing Iran-Middle East conflict, Bitcoin's price remains relatively stable at approximately $71,000. Analysis indicates its resilience is supported by geopolitical risk hedging, Federal Reserve policy, and institutional investor interest. However, if it breaks below $67,500, it could form a weakening trend, requiring close attention to relevant market movements.
GateNews27m ago
Bernstein Says Bitcoin Bottom In, Targets $150K in 2026
AllianceBernstein analysts suggest Bitcoin has likely bottomed after a significant decline, with no systemic failures noted. Steady institutional demand and ETF inflows above $56 billion support a bullish $150,000 year-end target, indicating market resilience despite macro pressures.
CryptoFrontNews28m ago
Four On-Chain Indicators Show Weak Demand, Bitcoin Recovery May Face Resistance
This year, Bitcoin has experienced increased price volatility due to geopolitical tensions and economic pressures, with weakening demand evident. On-chain data indicates dispersed wallet activity and reduced whale transactions, reflecting investor caution. Fundamentals continue to deteriorate, limiting short-term recovery prospects, necessitating attention to external factors and policy developments.
GateNews35m ago
Bitcoin Price Surges 10% Then Falls Into Bull Trap? Exchange Inflows Spike Draws Attention
Bitcoin price fluctuates at $70,700, with a monthly gain of approximately 10%. Both retail investors and whales are simultaneously accumulating Bitcoin, with capital inflows surging, yet this may bring selling pressure. The derivatives market shows bullish sentiment, but spot selling pressure could trigger forced liquidations. The key technical support level is at $70,700, and market dynamics require close monitoring.
GateNews1h ago
