US November PPI data exceeds expectations, leading to a decline in US stocks. However, Bitcoin has shown an independent upward trend, reaching a high of $97,924 in the past 24 hours, breaking through the 99-day moving average. What is the reason?
High US PPI index causes US stocks to fall, but Bitcoin surges
Last night, the US released the Producer Price Index (PPI) for November, with a month-over-month increase of 0.2%, higher than the market expectation of 0.1%, and an annual increase of 3.0%.
The market was still optimistic the day before about December CPI data meeting expectations, but after the PPI data was released, concerns about future rate cuts resurfaced.
The three major US indices closed lower, including the S&P which fell 0.53%, marking the first consecutive two-day decline since 2026. The Nasdaq also dropped 1%. However, Bitcoin ($BTC) has shown an independent rally, reaching a high of $97,924 in the past 24 hours, breaking through the 99-day moving average, and currently pulling back to $96,552.
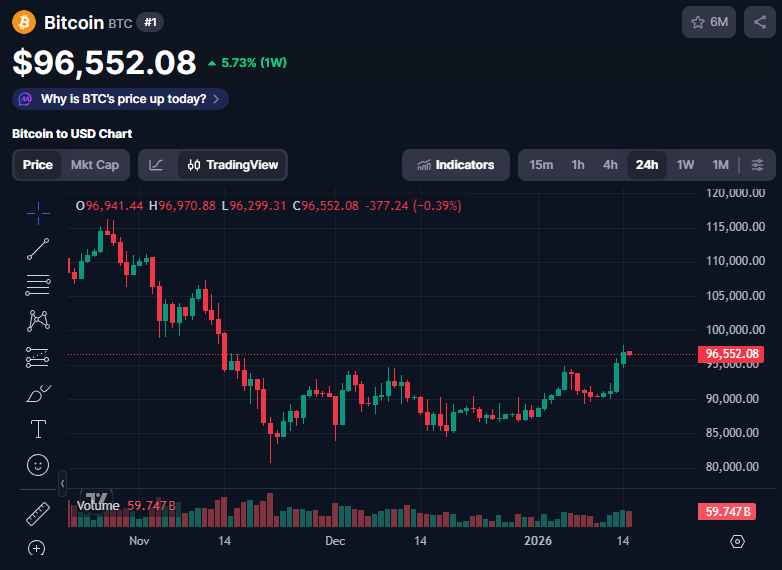
Image source: CoinMarketCap Bitcoin reached a high of $97,924 in the past 24 hours
Why did Bitcoin rise for two consecutive days?
According to comprehensive analysis from foreign media, Bitcoin’s ability to ignore the adverse PPI index and rise is mainly due to large capital inflows into Bitcoin ETFs, short squeeze effects, and the Goldilocks phenomenon.
SoSoValue data shows that US Bitcoin spot ETF saw inflows of $753 million on Tuesday, the largest single-day inflow since October 7 last year.
Analysts believe that ETF capital inflows indicate that traditional and institutional investors, after rebalancing their portfolios, are reallocating funds back into risk assets.
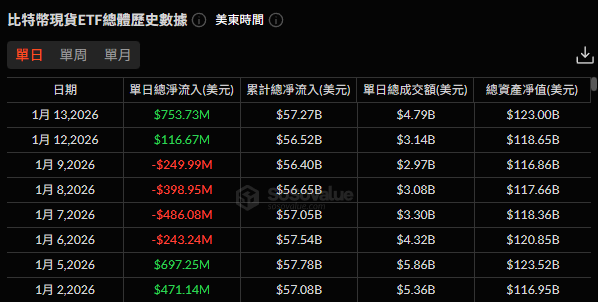
Image source: SoSoValue US Bitcoin spot ETF inflowed $753 million on Tuesday
Cointelegraph analysis points out that Coinbase premium index shows easing selling pressure from the US, and inflows into Coinbase Advanced are 2.5 times the baseline, suggesting active institutional positioning. Additionally, Binance’s hourly net buy volume exceeded $500 million, and the funding rate for perpetual contracts hit multi-month lows, reflecting excessive short positions in the market, which triggered short squeezes and pushed spot prices higher.
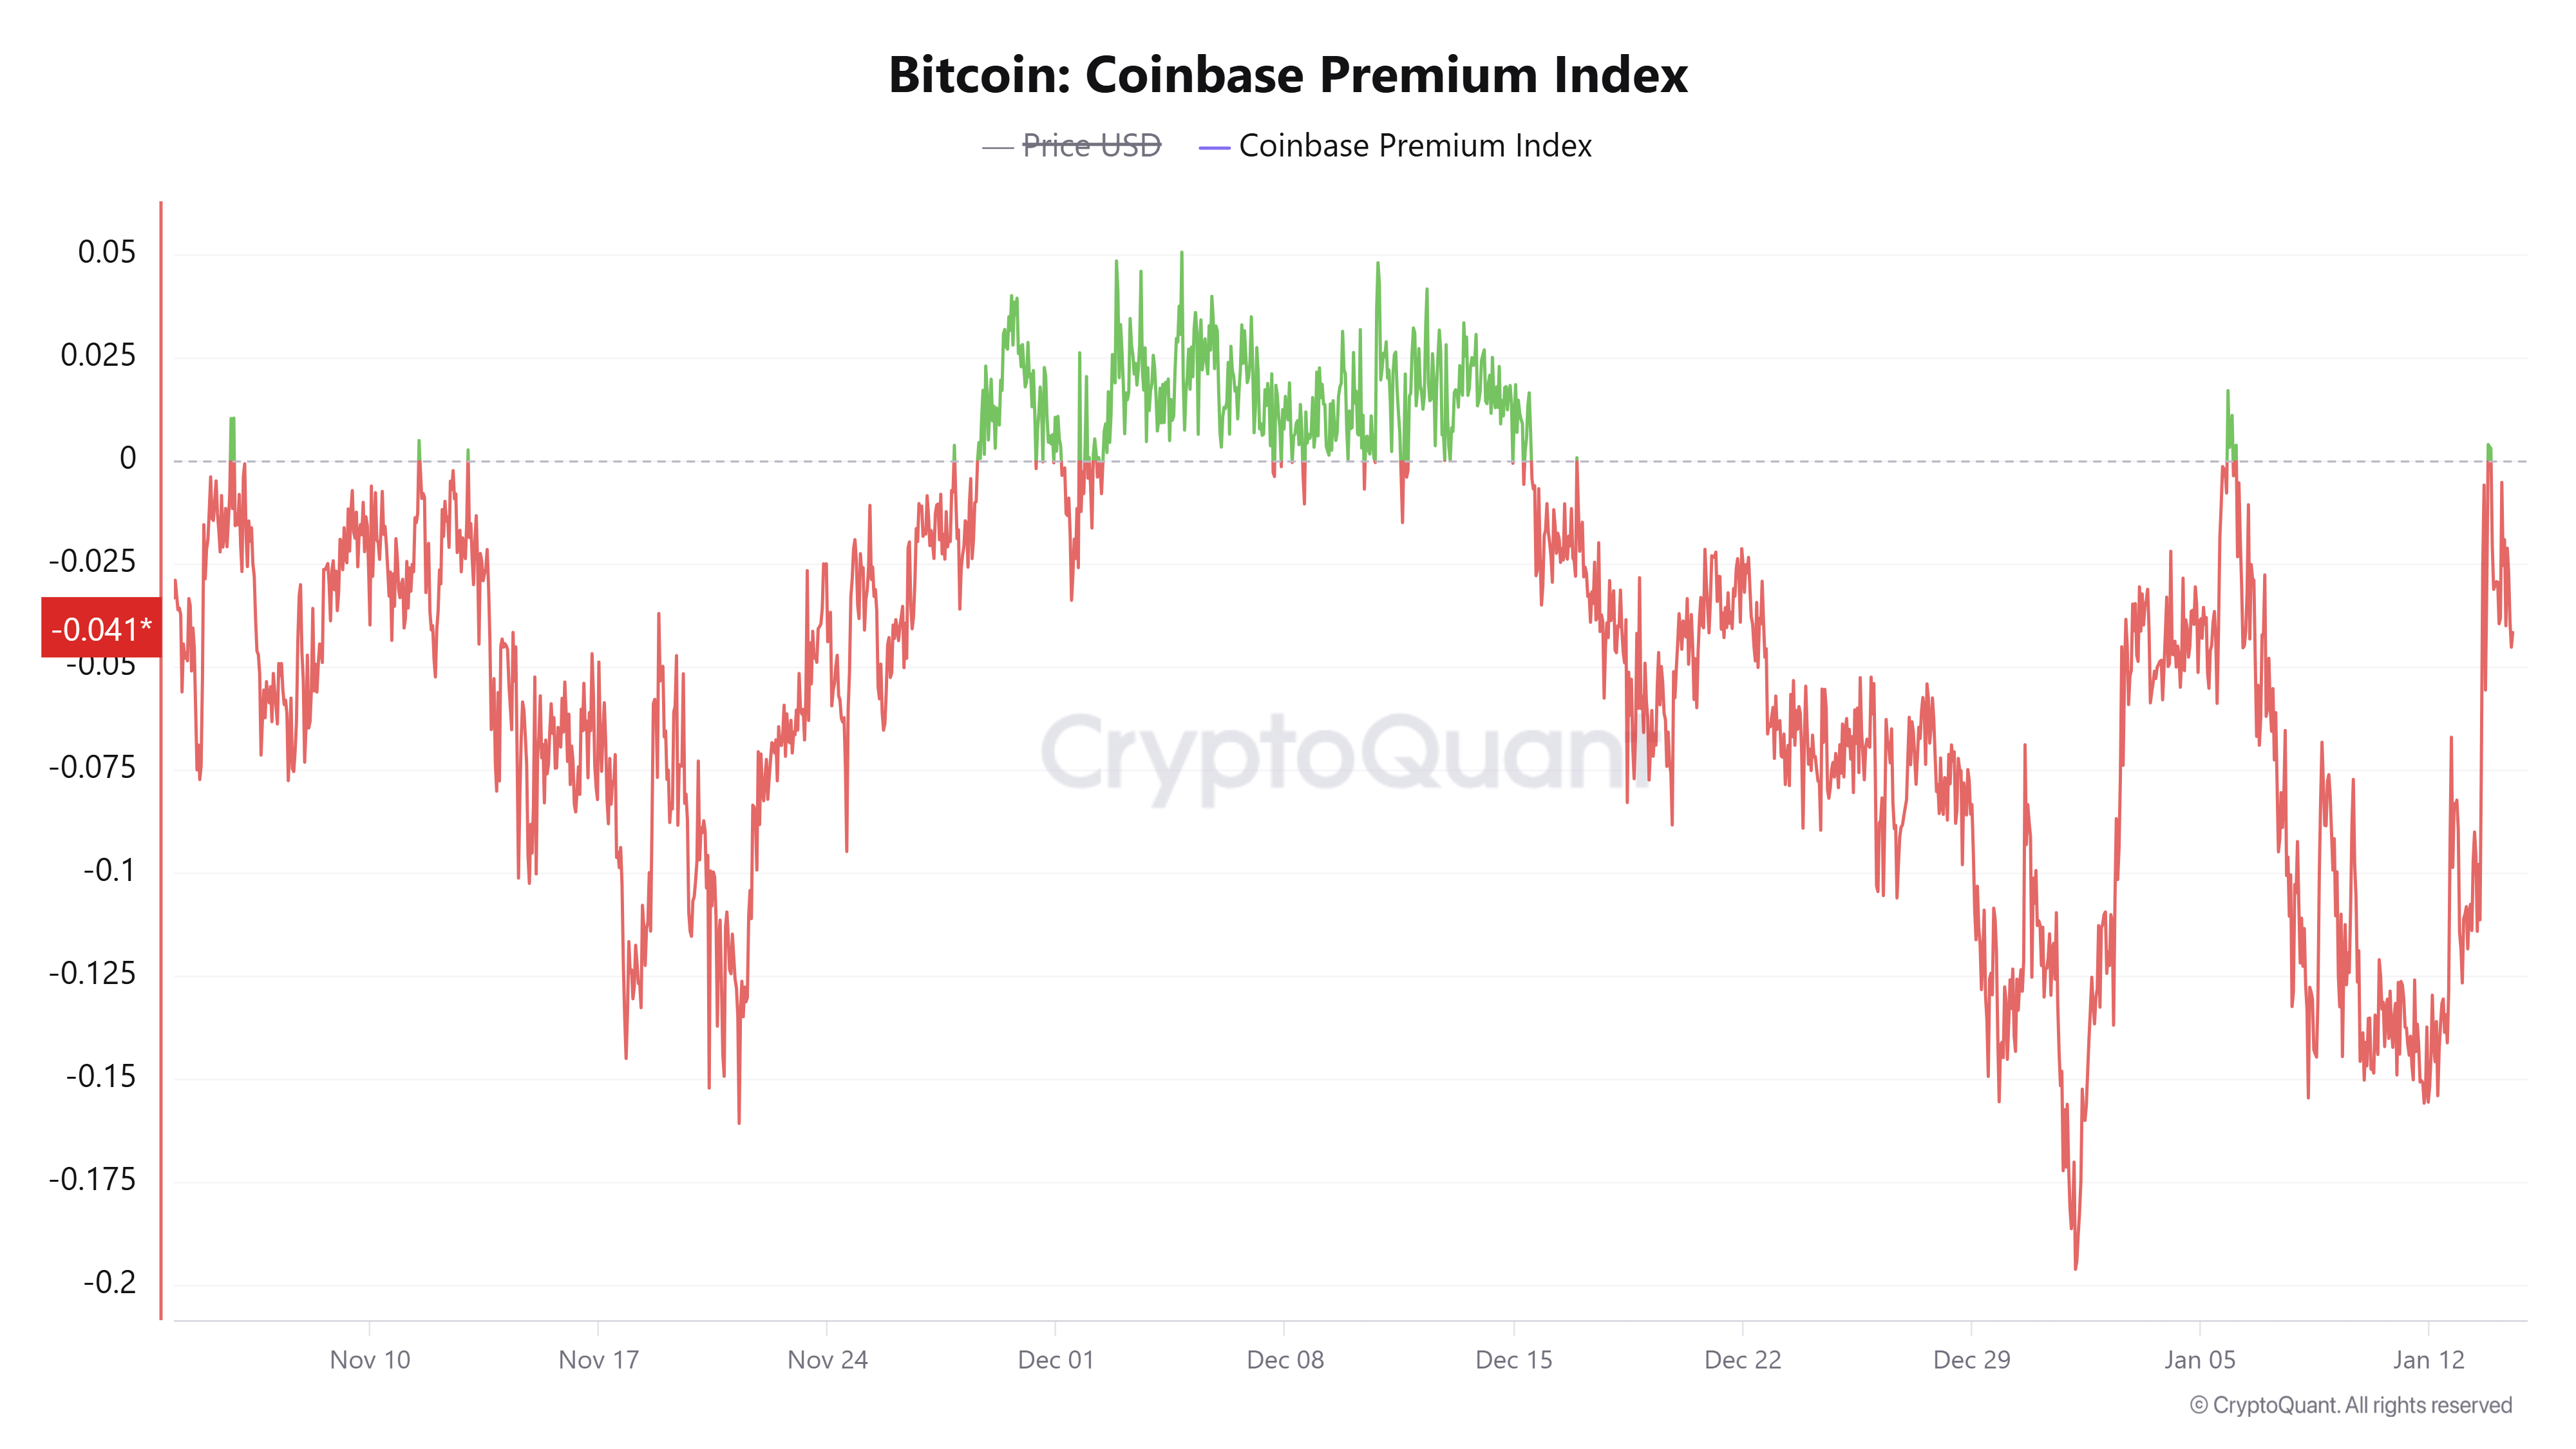
Image source: Cointelegraph Coinbase premium index shows easing US selling pressure, with inflows into Coinbase Advanced reaching 2.5 times the baseline
Crypto trading firm QCP Capital also believes that despite turbulence in Venezuela and Iran, and US involvement, the overall economic environment remains in a Goldilocks state, indicating moderate growth—neither overheating (high inflation) nor cooling (recession), low unemployment, and stable interest rates.
Furthermore, as the US advances the legislative review of the crypto market structure bill and improves regulatory transparency, investor risk appetite for cryptocurrencies and other asset classes has increased.
Does Bitcoin need to hold the $93,500 support, with $100,000 within reach?
As Bitcoin approaches its all-time high, well-known analyst Rekt Capital states that Bitcoin needs to hold the critical support level of $93,500. If the price continues to rise, there is little resistance before reaching $100,000, but between $103,300 and $107,500, there could be significant selling pressure.
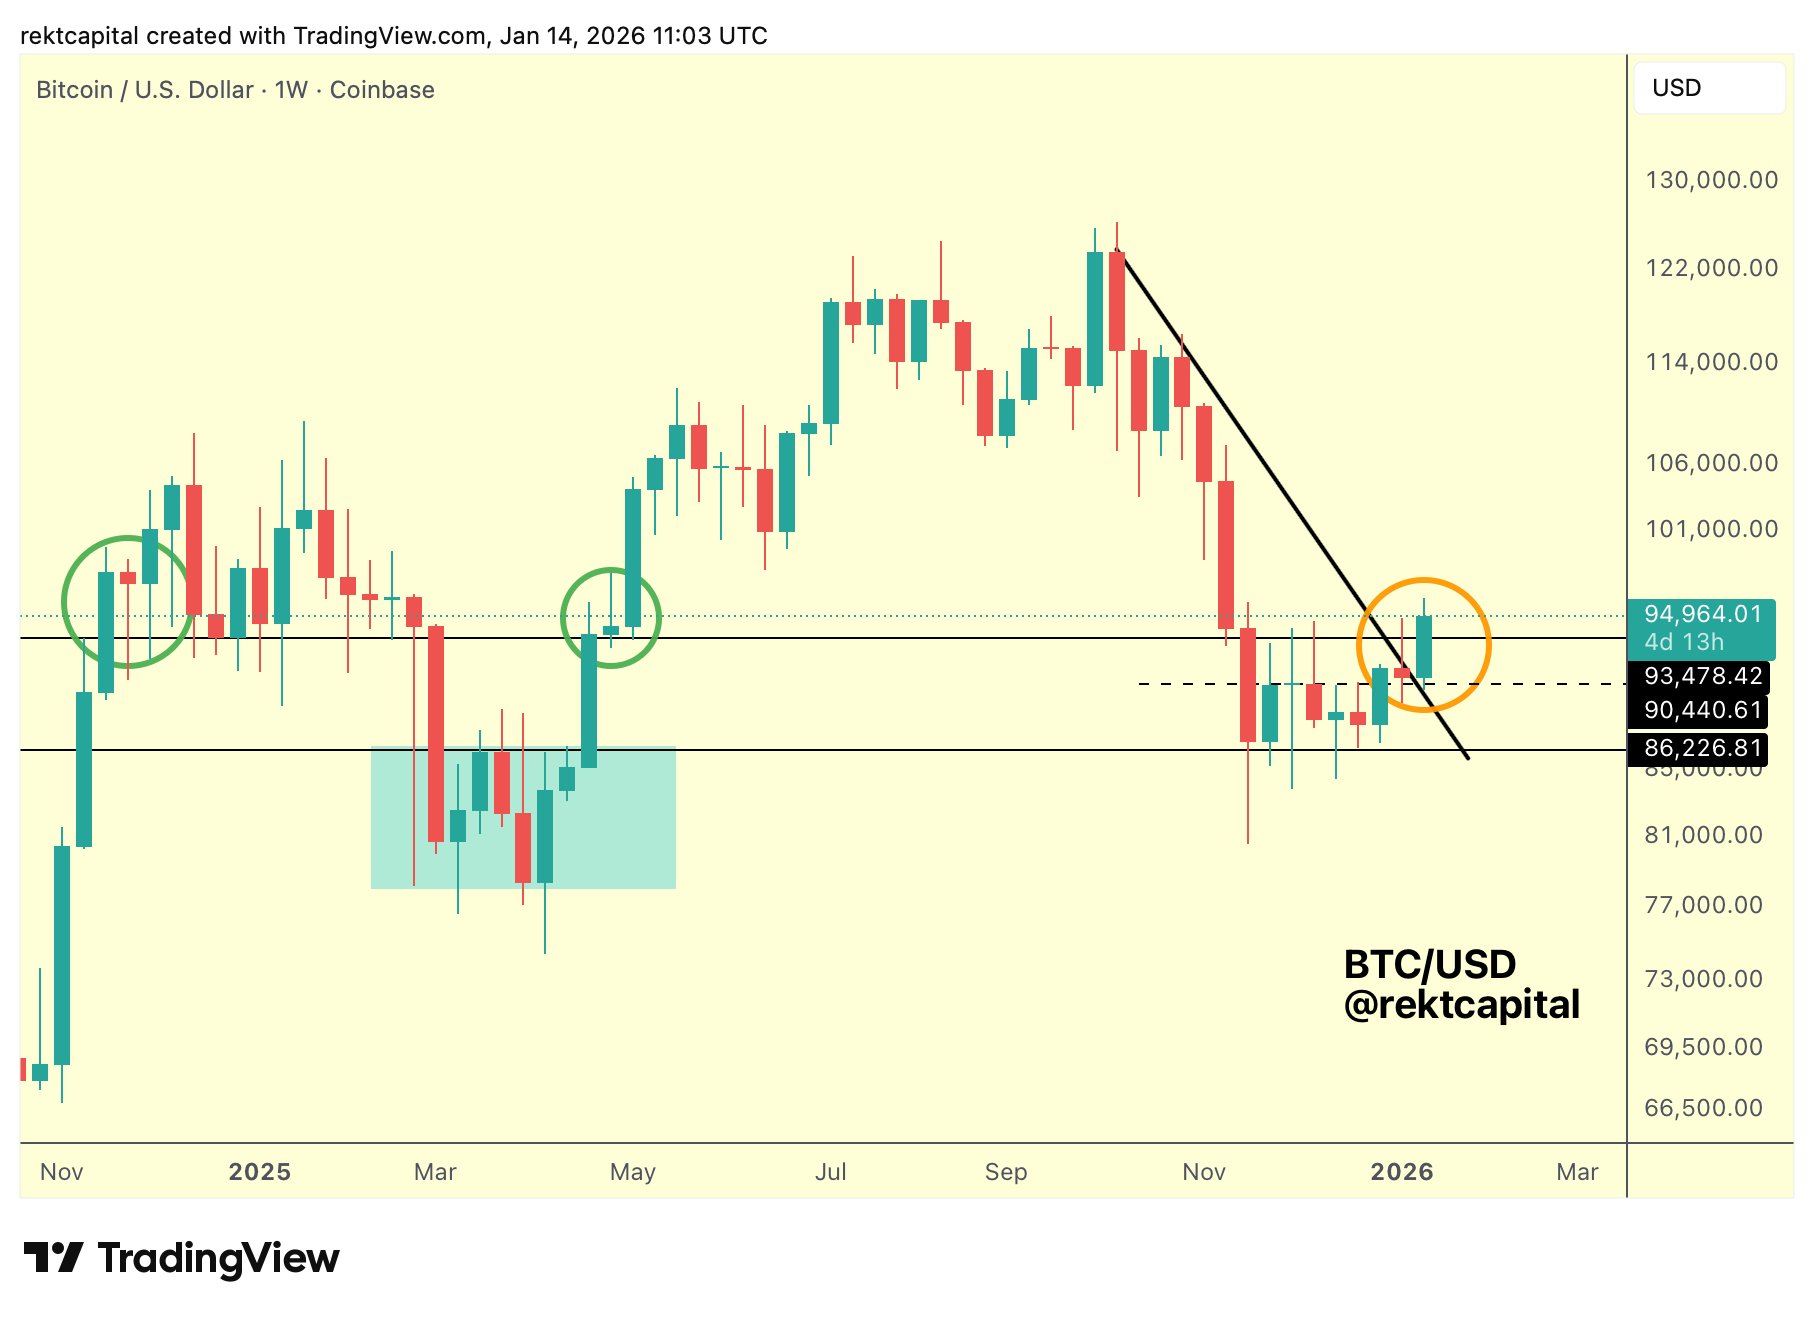
Image source: RektCapital Well-known analyst Rekt Capital states that Bitcoin needs to hold the critical support of $93,500
On the other hand, senior analyst Marcel Pechman points out that the Delta slope indicator of Bitcoin options shows that the trading price of puts remains higher than calls, indicating that professional traders are still skeptical about Bitcoin’s ability to sustain above $100,000.
Bloomberg also added that although some wealth management firms believe the US stock market is off to a good start this year, with upcoming tech earnings reports and geopolitical concerns, market volatility could increase. For Bitcoin, whether it can continue to rely on ETF capital inflows to maintain an independent trend amid these concerns will be a key focus moving forward.
Further reading:
Rumors say Venezuela has $60 billion worth of Bitcoin, will the US take it? SEC: Whether to confiscate remains to be seen
Disclaimer: The information on this page may come from third parties and does not represent the views or opinions of Gate. The content displayed on this page is for reference only and does not constitute any financial, investment, or legal advice. Gate does not guarantee the accuracy or completeness of the information and shall not be liable for any losses arising from the use of this information. Virtual asset investments carry high risks and are subject to significant price volatility. You may lose all of your invested principal. Please fully understand the relevant risks and make prudent decisions based on your own financial situation and risk tolerance. For details, please refer to
Disclaimer.
Related Articles
Bittensor (TAO) Hits a 3-Month Peak: What Caused the Rally and What Comes Next?
Many leading cryptocurrencies have posted slight declines or negligible increases over the past 24 hours, but this isn’t the case for Bittensor (TAO), whose price soared by 15%.
The question now is whether this momentum can hold or if a pullback is coming next.
Further Gains
CryptoPotato24m ago
ETH falls 0.85% in 15 minutes: Exchange outflows and ETF trimming in sync amplify volatility
From 23:00 to 23:15 (UTC) on March 28, 2026, the price of ETH fluctuated downward within the range of 1,989.32 to 2,012.0 USDT, recording a return of -0.85%, with a volatility of 1.13%. During this period, market attention increased, and short-term fluctuations intensified, prompting traders to closely monitor the performance of key support zones.
The main driver of this volatility is the continuous outflow of ETH from major exchanges to on-chain wallets since March, with a total outflow of 31.6 million coins, leading to a contraction in exchange liquidity and causing prices to be sensitive to large orders. Meanwhile,
GateNews32m ago
Is the XRP Bottom Finally Here? 3 Massive Bullish Signals You Need to See
Although in a more modest manner, XRP whales have returned to the scene, amassing more tokens over the past week, which is categorized as the first bullish sign for the underlying asset.
Another could come in the form of the technical tool used to determine whether that asset’s move in either
CryptoPotato1h ago
Bitcoin’s Most Dangerous Pattern Just Triggered: Will BTC Dump to $26K Next?
Although bitcoin has already dumped by over 50% from its all-time high of over $126,000 marked in October to a multi-year low of $60,000, the asset’s troubles might not be over, warned Merlijn The Trader.
The popular analyst indicated that the “most dangerous bitcoin pattern just completed phase
CryptoPotato1h ago
Ethereum (ETH) on the Edge: Critical Level Stands Between New Bull Run and a Major Crash
While the second-largest cryptocurrency has registered a significant rebound over the past month, it remains at risk of plummeting to drastically low levels during this cycle.
On the other hand, some important indicators suggest that the worst might be over and the price could be gearing up for a m
CryptoPotato2h ago
Solana Price at $80 and Maxis Are Nowhere to Be Found – Analyst Says That Tells You Everything
Solana is down to $82 on the weekly chart. From the highs near $250, that’s a 77% drop. Crypto Patel asks “Where Are All The Solana Maxis Now?.” They told their followers to buy above $250, and screamed “to the moon” at the all-time high. Now the price is $80, and they’re silent. Not a single t
CaptainAltcoin2h ago
