
Date: Thu, Jan 01, 2026 | 10:30 AM GMT
As the new year 2026 begins, the broader cryptocurrency market is showing modest weakness, with both Bitcoin (BTC) and Ethereum (ETH) trading slightly in the red. This soft start has weighed on sentiment across the altcoin space as well, including Monad (MON). However, beneath the surface, MON’s chart structure is beginning to tell a more constructive story.
MON is currently down around 4% on the day, extending its 60-day decline to roughly 21%. While short-term price action remains subdued, the more important signal is emerging on the daily chart, where price structure is beginning to hint at a meaningful shift. If confirmed, this setup could mark the early stages of a bullish continuation following a prolonged corrective phase.
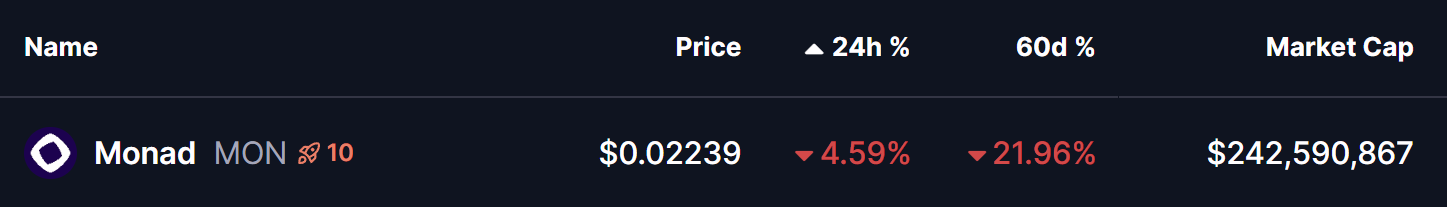
Source: Coinmarketcap
Rounding Bottom in Play
On the daily timeframe, MON appears to be forming a textbook rounding bottom pattern — a classic bullish reversal structure that typically develops after extended downside pressure. This pattern reflects a gradual transition from distribution to accumulation, where selling momentum weakens and buyers begin to step in more consistently.
Previously, MON faced strong rejection near the $0.04923 neckline zone, triggering a sharp decline that unfolded through late November and December. That move eventually found a floor near the $0.017 level, which has since acted as a key demand zone. Repeated defenses of this area prevented any deeper breakdown and helped establish a stable base for a potential trend reversal.
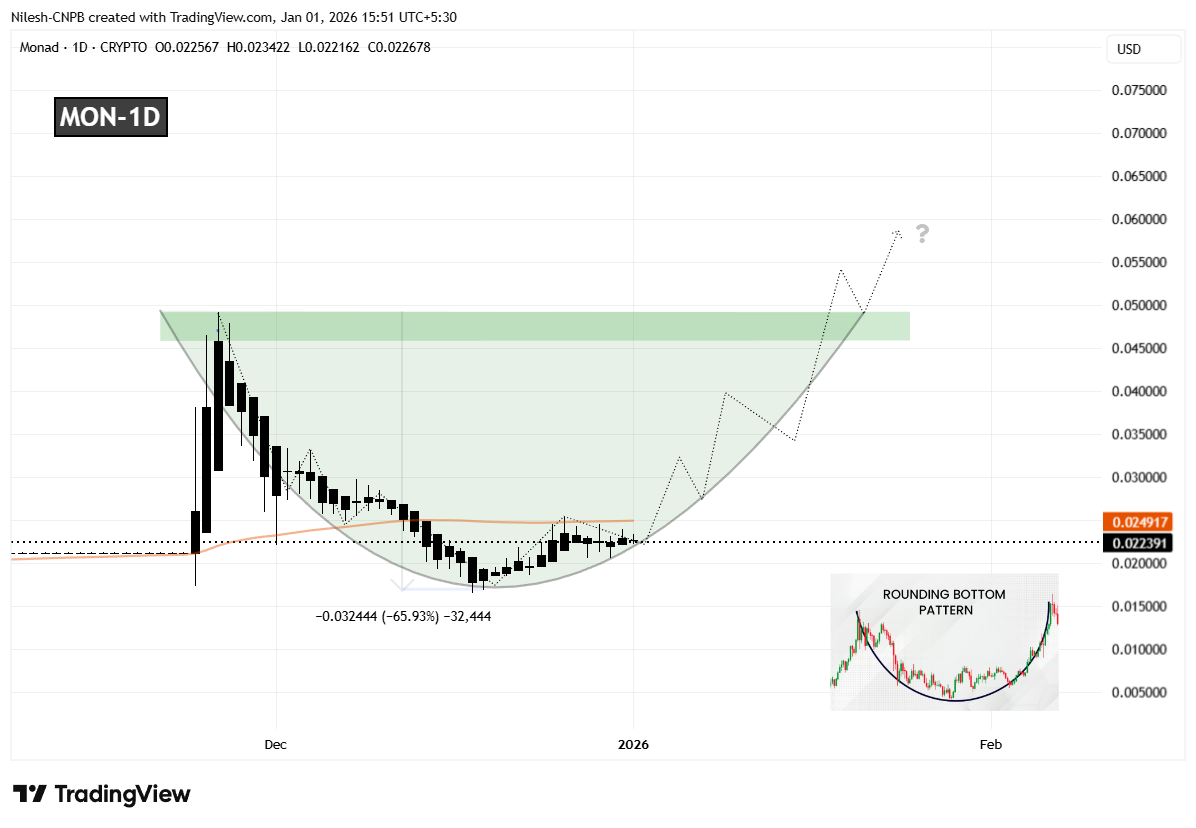
Monad (MON) Daily Chart/Coinsprobe (Source: Tradingview)
Since forming that bottom, MON has started to curve higher in a rounded fashion, closely matching the classic structure of a developing bottoming pattern. This gradual recovery suggests that selling pressure is fading rather than accelerating. The recent stabilization and recovery back above the $0.022 region further indicate that accumulation may be taking place as the market quietly prepares for a larger move.
What’s Next for MON?
For the rounding bottom pattern to move into confirmation, MON needs to reclaim the 50-day moving average, currently positioned near the $0.02491 level. A sustained move above this area would signal a shift in short-term momentum and confirm that buyers are beginning to regain control after months of corrective price action.
Looking ahead, the most significant technical hurdle remains the neckline resistance around $0.04923. A clean and decisive breakout above this zone would validate the entire reversal structure and could open the door for a broader bullish expansion phase, with momentum traders likely returning to the market.
Until those levels are reclaimed, the pattern remains in its early development stage. Short-term pullbacks or consolidation remain possible if MON struggles near the 50-day moving average. However, as long as price continues to hold higher lows above the $0.017 base, the broader bottoming structure remains intact.
Overall, MON’s emerging rounding bottom formation suggests the token may be approaching an important inflection point. While confirmation is still pending, the improving structure and alignment with a classic bullish pattern indicate that the coming sessions could be decisive for Monad’s next directional move.
Disclaimer: The views and analysis presented in this article are for informational purposes only and reflect the author’s perspective, not financial advice. Technical patterns and indicators discussed are subject to market volatility and may or may not yield the anticipated results. Investors are advised to exercise caution, conduct independent research, and make decisions aligned with their individual risk tolerance.
About Author: Nilesh Hembade is the Founder and Lead Author of Coinsprobe, with over 5 years of experience in the cryptocurrency and blockchain industry. Since launching Coinsprobe in 2023, he has been providing daily, research-driven insights through in-depth market analysis, on-chain data, and technical research.
Disclaimer: The information on this page may come from third parties and does not represent the views or opinions of Gate. The content displayed on this page is for reference only and does not constitute any financial, investment, or legal advice. Gate does not guarantee the accuracy or completeness of the information and shall not be liable for any losses arising from the use of this information. Virtual asset investments carry high risks and are subject to significant price volatility. You may lose all of your invested principal. Please fully understand the relevant risks and make prudent decisions based on your own financial situation and risk tolerance. For details, please refer to
Disclaimer.
Related Articles
Bitcoin Rejects $76K as War and PPI Rock Markets
_ Bitcoin rejected $76,000 resistance as US strikes on Iran, hot PPI at 3.4%, and Powell’s FOMC tone sent crypto and risk assets into a sell-off._
Bitcoin hit $76,000 and turned back around. The rejection was clean. Sellers were waiting right at the level that traders had marked for
LiveBTCNews52m ago
Why Is the River (RIVER) Price Pumping Today
River is suddenly awake again while the rest of the market is just kind of hanging out. The RIVER price jumped more than 14% in the last 24 hours, pushing up toward $25.65, and honestly, there’s no obvious catalyst. No big partnership announcement, no exchange listing, no protocol upgrade.
CaptainAltcoin1h ago
Ethereum Approaches Cycle Low as Bitmain Indicates Violent Belief
The article explores Ethereum's potential market bottom, highlighting its correlation with past S&P 500 trends and significant institutional investment by Bitmain. Despite mixed market sentiment, historical patterns suggest possible recovery.
CryptoBreaking1h ago
DOGE Stabilizes At $0.09438 As TD Sequential Buy Signal Suggests Rising Accumulation Phase and Po...
Dogecoin (DOGE) shows potential for a significant rally as it flashes a TD Sequential buy signal, indicating early accumulation despite recent declines. With key support at $0.0892 and strong whale activity, a price surge to $0.18876 could be on the horizon.
BlockChainReporter2h ago
BTC Breaks Through $73,000, Mainstream CEX Cumulative Short Liquidation Intensity Reaches $834 Million
According to Coinglass data, if the Bitcoin price breaks through $73,000, it will trigger $834 million in short liquidations; if it falls below $69,000, it will trigger $940 million in long liquidations. This demonstrates the potential impact of market liquidity fluctuations.
GateNews5h ago
Ethereum Bottom In at $2,156, Says Tom Lee! Spike Soon?
Ethereum shows signs of stabilization with long-term holders increasing positions despite cautious institutional ETF outflows. This suggests a potential market bottom, though recovery may take time influenced by external factors.
Coinfomania6h ago
