
**Date: **Sat, Jan 03, 2025 | 01:26 PM GMT
As 2026 kicks off, the broader cryptocurrency market is showing renewed stability. Ethereum (ETH) has reclaimed the $3,100 level, and several major altcoins are already beginning to pick up momentum. Against this improving backdrop, Kaspa (KAS) is quietly positioning itself as a potential late mover, with its chart structure starting to flash early bullish signals.
While KAS is trading slightly in the red today and remains mostly flat on the weekly timeframe, the more important story is unfolding beneath the surface. Recent price action suggests a meaningful structural shift may be underway — one that could mark the early stages of a bullish continuation if confirmed.
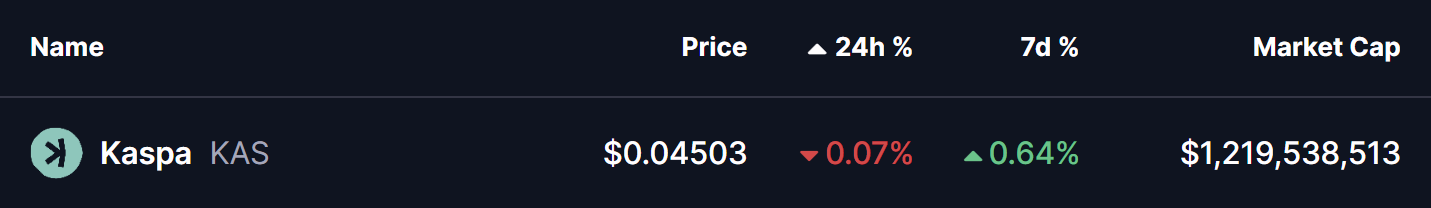
Source: Coinmarketcap
Rounding Bottom in Play
On the 4-hour timeframe, Kaspa appears to be forming a rounding bottom pattern, a classic bullish reversal structure that typically develops after a prolonged corrective phase. This pattern reflects a slow but steady transition from distribution to accumulation, as selling pressure weakens and buyers gradually regain control.
The setup began after KAS faced strong rejection near the $0.06310 neckline zone, which triggered a sharp decline through late November and December. That downside move eventually found strong demand near the $0.040 level, which has since acted as a key support area. Multiple defenses of this zone prevented further downside and helped establish a stable base for a potential trend reversal.
Since carving out that bottom, KAS has started to curve higher in a smooth, rounded fashion — closely matching the textbook structure of a developing rounding bottom. The recent stabilization above the $0.045 region further supports the idea that downside momentum is fading.
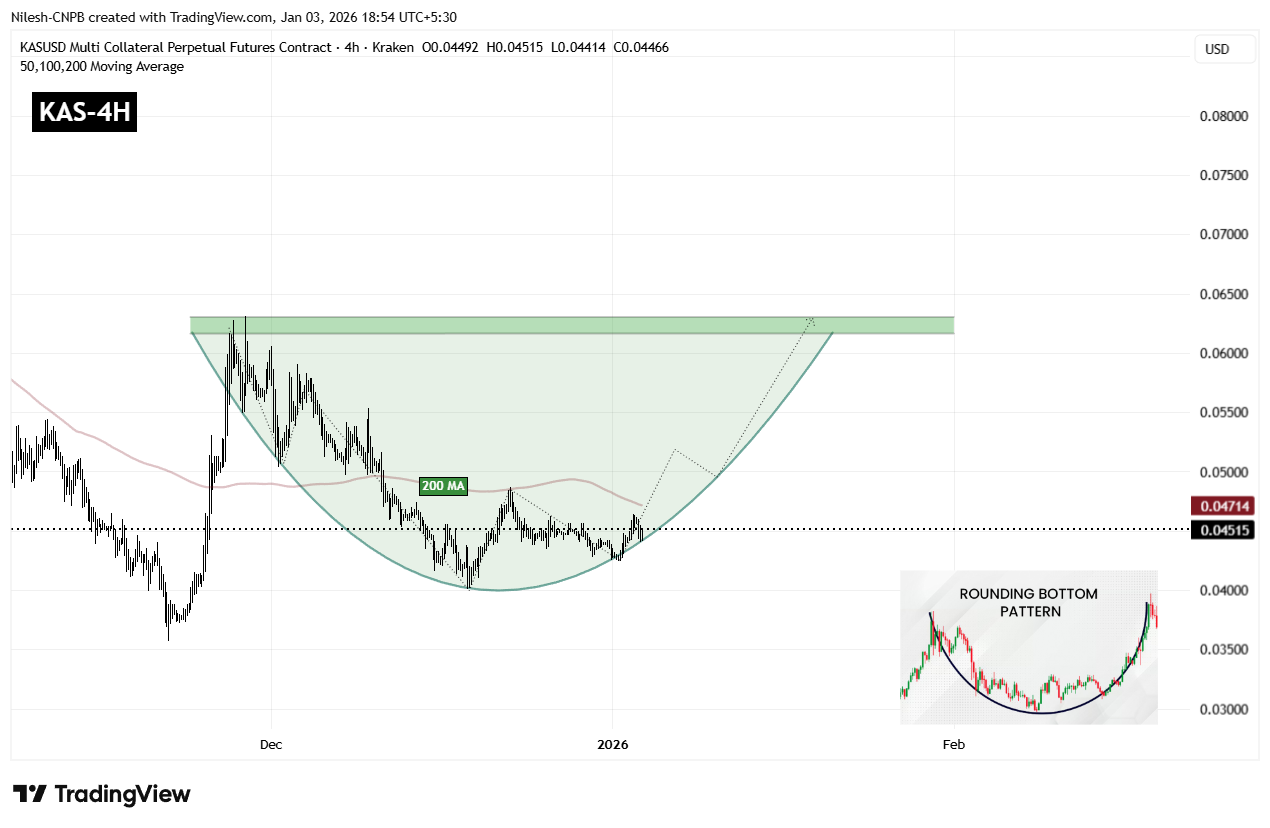
Kaspa (KAS) 4H Chart/Coinsprobe (Source: Tradingview)
A key technical level now comes into focus: the 200-period moving average, currently hovering near $0.04714. This level has acted as dynamic resistance during the recovery phase, and reclaiming it would mark an important shift in short-term market structure.
A sustained move above the 200 MA would indicate that buyers are regaining control after months of corrective price action and could act as the trigger for a stronger upside continuation.
What’s Next for KAS?
For full confirmation of the rounding bottom pattern, KAS must eventually reclaim the $0.06310 neckline resistance. A clean breakout above this zone would validate the entire reversal structure and could open the door to a broader bullish expansion phase, with momentum traders likely re-entering the market.
Until that breakout occurs, the pattern remains in development. Short-term consolidation or shallow pullbacks remain possible, especially near moving average resistance. However, as long as price continues to hold above the $0.04245 support base and maintains higher lows, the broader bottoming structure remains intact and constructive.
In the near term, all eyes remain on the 200 MA and the neckline zone. How Kaspa reacts around these levels will likely determine whether this emerging bullish setup evolves into a confirmed breakout move or requires more time to mature.
Disclaimer: The views and analysis presented in this article are for informational purposes only and reflect the author’s perspective, not financial advice. Technical patterns and indicators discussed are subject to market volatility and may or may not yield the anticipated results. Investors are advised to exercise caution, conduct independent research, and make decisions aligned with their individual risk tolerance.
About Author: Nilesh Hembade is the Founder and Lead Author of Coinsprobe, with over 5 years of experience in the cryptocurrency and blockchain industry. Since launching Coinsprobe in 2023, he has been providing daily, research-driven insights through in-depth market analysis, on-chain data, and technical research.

Disclaimer: The information on this page may come from third parties and does not represent the views or opinions of Gate. The content displayed on this page is for reference only and does not constitute any financial, investment, or legal advice. Gate does not guarantee the accuracy or completeness of the information and shall not be liable for any losses arising from the use of this information. Virtual asset investments carry high risks and are subject to significant price volatility. You may lose all of your invested principal. Please fully understand the relevant risks and make prudent decisions based on your own financial situation and risk tolerance. For details, please refer to
Disclaimer.
Related Articles
Onchain Perp DEX Volume Falls for Fifth Straight Month as March Drops to $699B
Onchain perpetual futures trading has sharply declined for five consecutive months, with March 2026 volume dropping to $699 billion from a peak of $1.36 trillion in October 2025. Hyperliquid dominates the market, capturing 34% of recent trading activity.
CryptoNewsFlash15m ago
XRP Whales Accumulate as Ripple Executives Head to Key XRPL Event in Japan
XRP has gained 5% from a support level of $1.28 due to increased whale accumulation, with large holders now buying over 11 million XRP daily. Ripple executives are attending a significant XRPL event in Japan, though broader market sentiment remains cautious amid geopolitical tensions.
CryptoNewsFlash1h ago
Global Markets Shift as Oil Jumps and Bitcoin Holds Ground
Global markets moved unevenly as geopolitical tensions intensified and energy prices climbed sharply. Oil prices surged above key levels while Bitcoin maintained stability despite pressure. Meanwhile, equities fluctuated as traders reacted to escalating rhetoric and uncertain diplomatic outcomes.
O
CryptoBreaking1h ago
HYPE Price Break Signals Deeper Pullback Amid Weak Momentum
Key Insights:
HYPE broke below $37 support after repeated tests, signaling weakening buyer strength and confirming growing bearish control across short-term price structure movements.
Fibonacci levels identify $32.44 and $29.5 as critical demand zones, where buyers may re-enter as
CryptoNewsLand2h ago
Solana Price Faces Downside Risk as Bears Eye $74 Zone
Key Insights
Solana trades near eighty dollars as bearish momentum builds, with indicators signaling weakness and increasing probability of testing lower support levels soon.
Technical signals, including weak MACD and low RSI momentum, indicate sellers remain dominant, reinforcing downside p
CryptoNewsLand2h ago
BNB Price Struggles Below $600 as Weak Momentum Persists
Key Insights
BNB lost $600 support, shifting short-term momentum and placing price under pressure as sellers strengthened control and limited recovery attempts across sessions.
Price consolidation between $560 and $580 reflects cautious buying activity, while weak indicators continue to limi
CryptoNewsLand2h ago
