The recent trend of PiCoin presents a contradiction: the Chaikin Money Flow (CMF) index has risen above zero, indicating continuous capital inflow, but between December 19 and January 3, the price made a lower high while RSI made a higher high, forming a hidden bearish divergence. PiCoin is currently facing strong resistance at $0.214. A breakout could challenge $0.226, while a drop below $0.207 would test the critical support at $0.199.
Capital Inflow and Price Divergence Reveal Bull-Bear Tug-of-War

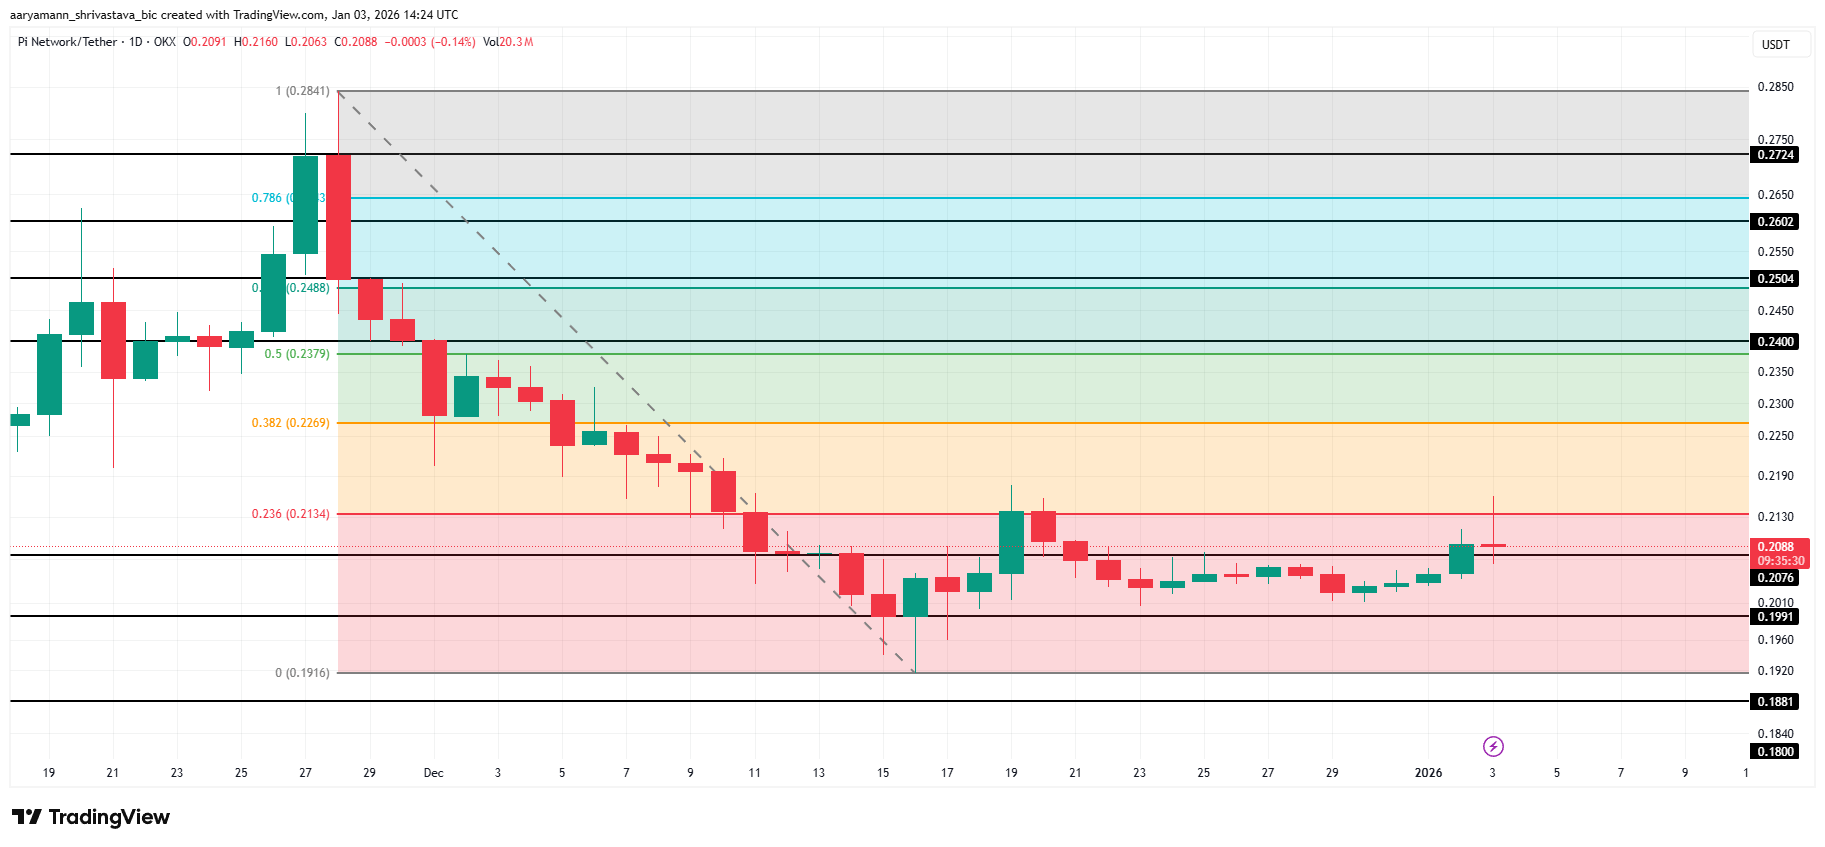
(Source: Trading View)
The most peculiar aspect of PiCoin’s current trend is the severe divergence between the capital side and technical indicators. The Chaikin Money Flow (CMF) has risen above zero, approaching the monthly high. CMF tracks volume-weighted capital flow and reliably measures investor confidence. Its rise indicates sustained accumulation rather than speculative surges, supporting recent price stability and limiting further declines, providing a short-term buffer against overall market volatility.
However, the technical picture tells a completely different story. PiCoin has formed a hidden bearish divergence pattern on the chart, one of the most dangerous signals in a downtrend. From December 19 to January 3, the price created a lower high, while RSI created a higher high. This divergence suggests that the upward momentum lacks strong underlying strength, and buying pressure is weakening.
Hidden bearish divergence often appears during retracement rebounds within a downtrend. Despite short-term market optimism, underlying selling pressure remains dominant. This pattern indicates that once the temporary buying interest wanes, the main downtrend could resume, increasing PiCoin’s downside risk. Historical data shows that within 1 to 2 weeks after such divergence forms, prices often experience a significant pullback.
The coexistence of capital inflow and technical divergence reveals internal market tug-of-war. On one hand, ongoing capital inflow shows some investors remain confident and are willing to accumulate at current levels. On the other hand, RSI divergence warns that these buyers may be nearing exhaustion, and a sudden sell-off could cause prices to fall rapidly. For PiCoin investors, close monitoring of these indicators is essential; if CMF turns negative or RSI breaks key support levels, a bearish scenario is confirmed.
$0.214 Resistance as a Key Breakout Level
(Source: Trading View)
The primary challenge for PiCoin is the resistance at $0.214. This level aligns closely with the 23.6% Fibonacci retracement, highlighting its technical significance. Multiple rejections near this zone indicate traders are exerting selling pressure to defend higher cost bases. This price range represents a large volume of trapped positions; as prices approach, profit-taking and stop-loss selling naturally increase.
(# PiCoin Key Price Levels and Trading Strategies
) Resistance Analysis
First Resistance: $0.214 (23.6% Fibonacci retracement)
Breakout Target: $0.226 (confirmation requires volume support)
Extreme Optimism: $0.240 (previous high resistance zone)
Support Analysis
First Support: $0.207 (recent low)
Critical Defense Line: $0.199 (strong support zone)
Extreme Pessimism: $0.185 (deep correction target)
Technical Indicator Key Levels
· RSI must stay above 45 to maintain rebound validity
· CMF turning negative will confirm capital outflow signals
· Volume needs to increase by over 30% compared to the 10-day average to confirm a breakout
Breaking free from the downtrend requires decisive action. If the closing price remains above $0.214, it confirms the breakout of the descending trendline. This could open upward space, with a target of $0.226. If volume increases and market sentiment improves, further upward movement is possible. However, the breakout must be volume-supported; if volume diminishes during the breakout, it often signals a false breakout, and prices may quickly retreat.
From the perspective of order book structure, there are many historical transaction records around $0.214, indicating many investors’ cost bases are concentrated in this zone. These holders are highly motivated to defend or exit when prices reach their cost, creating a tug-of-war. Bulls need to not only break above $0.214 but also stabilize above it for at least 3 to 5 trading days to confirm a trend reversal.
Conversely, if the upward momentum fails to sustain, PiCoin faces the risk of a new decline. Falling below $0.207 could trigger a sell-off, as this level is a recent low where technical traders typically set stop-loss orders. In this case, the price may test the key support at $0.199. If buyers fail to hold this level, it will reinforce the current bearish outlook and possibly open a downtrend toward $0.185.
Investor Confidence and Market Sentiment Divergence
Despite mixed technical signals, PiCoin investors still seem willing to allocate capital. CMF remaining above zero indicates that, despite the warning signs of hidden bearish divergence, there is still steady buying interest. This phenomenon reflects the unique nature of the PiCoin community: compared to purely technical traders, PiCoin holders are more driven by faith in the project’s long-term vision rather than short-term price fluctuations.
However, this faith-driven buying also carries fragility. If prices break below key support, it could trigger a confidence collapse and panic selling. The $0.199 support zone is not only a technical key level but also a psychological barrier. If this level is breached, it may shake the confidence of long-term holders and trigger a chain reaction.
The current trend of PiCoin offers a clear operational framework. Conservative investors should wait for a confirmed breakout above $0.214 and stabilization before entering, with a target of $0.226 and a stop-loss below $0.207. Aggressive traders might consider small positions near $0.207, adding more if the price drops to $0.199, with a stop-loss at $0.195. Regardless of strategy, closely monitoring the synchronized changes in CMF and RSI is crucial; if both weaken simultaneously, a prompt exit is advised.
Disclaimer: The information on this page may come from third parties and does not represent the views or opinions of Gate. The content displayed on this page is for reference only and does not constitute any financial, investment, or legal advice. Gate does not guarantee the accuracy or completeness of the information and shall not be liable for any losses arising from the use of this information. Virtual asset investments carry high risks and are subject to significant price volatility. You may lose all of your invested principal. Please fully understand the relevant risks and make prudent decisions based on your own financial situation and risk tolerance. For details, please refer to
Disclaimer.
Related Articles
Bitcoin Rebounds to $74K on U.S.-Iran Framework Deal, But Market Skepticism Remains
Bitcoin's recent rise to mid-$74,000 followed a risk asset rally linked to a U.S.-Iran nuclear framework, but skepticism remains due to flat Treasury yields and unchanged gold prices. The core issue of uranium enrichment persists, and while on-chain data shows BTC's gradual advance, options markets reflect doubts about a sustained breakout. Overall, analysts see the rally as temporary, with macro conditions still tight and potential downside risks.
GateNews6h ago
Cardano Traders Watch $0.243 Support Level as ADA Price Faces Critical Decision
Cardano (ADA) is at a crucial support level of $0.243, with potential gains to $0.30 if it holds. A daily close below this could lead to declines toward $0.10. Currently, trading volume is around $500 million, with ADA notably below its all-time high.
GateNews7h ago
ETH/BTC Price Ratio Rebounds to 0.0313 in Q1 2026 as Ethereum User Base Surges 82%
In Q1 2026, the Ethereum-to-Bitcoin price ratio reached a three-month high at 0.0313. Ethereum added 284,000 users and surpassed $180 billion in stablecoin supply. Bitcoin remained strong above $74,000, driven by significant ETF inflows.
GateNews12h ago
Why is Bitcoin up today? Trump says Iran is seeking a truce, and risk assets move higher across the board
On April 15, Bitcoin rebounded about 6% after Trump said Iran is seeking to reach an agreement, breaking above $75,000. Expectations for the resumption of U.S.-Iran negotiations warmed up, lifting Asian stock markets. Technically, roughly $6 billion worth of short positions were forced to close, accelerating the rebound. Analysts said that if the U.S.-Iran situation continues to ease, Bitcoin could break through $80,000, and they predicted it may reach $150,000 by year-end.
MarketWhisper16h ago
Bitmine is promoted to the NYSE main board! Tom Lee: US stocks may be at a bottom, and selling pressure on Ether could ease
Bitmine officially transferred from the NYSE American market to the main board, marking a significant milestone for the company. Despite a sharp drop in its share price, it still increased the share repurchase program to $4 billion. The company holds a large amount of Ether, and expects that a rebound in the crypto market will help improve its assets and share price performance.
CryptoCity16h ago
ETH 15-minute up 0.66%: On-chain large transfers in sync drove a net inflow of funds, boosting spot buying pressure
2026-04-15 00:00 to 00:15 (UTC), ETH shows a local anomaly. The 15-minute return rate is +0.66%. The trading price range is 2321.93–2343.2 USDT, with a range of 0.92%. During this period, market attention increased, volatility slightly intensified, buy pressure in the order book shifted upward in the short term, and quickly pushed spot prices up into a key resistance area.
The main drivers of this anomaly are large on-chain transfers and inflows of capital in combination. At the beginning of the window, multiple large ETH transfers appeared, including 8,676 ETH and 6,551 ETH, respectively, transferring from a large source to the
GateNews17h ago
