
Date: Mon, Dec 29, 2025 | 12:25 PM GMT
The broader cryptocurrency market is experiencing a short-term pullback, with Bitcoin (BTC) slipping to $87K level after briefly reclaiming $90K earlier today. This mild retracement has weighed on sentiment across the market, with several altcoins also trading under pressure — including Filecoin (FIL).
FIL is trading in the red today, but beneath the surface, its technical structure is beginning to show signs of recovery. Despite the short-term weakness, the chart is now flashing a harmonic setup that could support a continued upside move if key levels are reclaimed.
Source: Coinmarketcap
Harmonic Pattern Hints at Potential Upside
On the 4-hour chart, Filecoin appears to be forming a Bearish Bat harmonic pattern — a structure that often allows for a bullish advance during the CD leg before reaching the Potential Reversal Zone (PRZ).
The pattern originated near Point X around $1.595, followed by a sharp decline into Point A. From there, FIL rebounded into Point B before pulling back once more into Point C near the $1.201 region. This area acted as a strong demand zone, where buyers stepped in aggressively to prevent further downside.
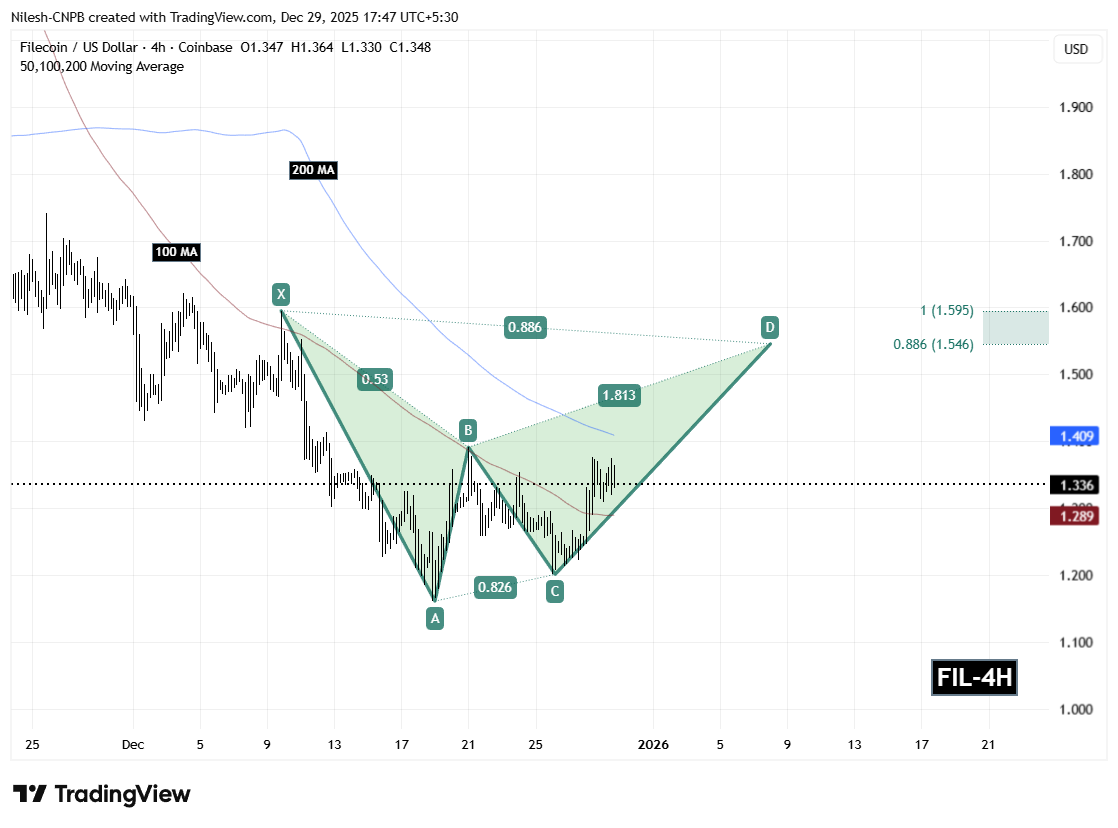
Filecoin (FIL) 4H Chart/Coinsprobe (Source: Tradingview)
Since establishing the Point C low, FIL has staged a steady recovery and is now trading near $1.336. Importantly, price has reclaimed the 100-hour moving average around $1.289 — a key short-term signal that selling pressure is easing and buyers are beginning to regain control.
The next major technical hurdle sits at the 200-hour moving average near $1.409. A clean break and sustained hold above this level would confirm the continuation of the CD leg and significantly strengthen the bullish case.
What’s Next for Filecoin (FIL)?
If FIL continues to defend the 100-hour MA and manages to flip the 200-hour MA into support, the harmonic structure points toward a move into the PRZ zone. Based on Fibonacci projections, this target area lies between $1.546 (0.886 extension) and $1.595 (1.0 extension).
This zone represents the completion of the Bearish Bat pattern and aligns with prior resistance, making it a logical area where price could react or consolidate. Until then, the short-term trend remains constructive as long as FIL continues to print higher lows and maintain its reclaimed moving average support.
On the downside, failure to hold above the 100-hour MA could result in temporary consolidation or a shallow pullback, though the broader recovery structure would remain intact as long as the $1.20 support zoneC remains protected.
Overall, Filecoin is approaching a technically important phase. While broader market volatility persists, the harmonic setup, improving structure, and key moving average reclaim suggest FIL may have room to extend higher in the near term if momentum continues to build.
Disclaimer: The views and analysis presented in this article are for informational purposes only and reflect the author’s perspective, not financial advice. Technical patterns and indicators discussed are subject to market volatility and may or may not yield the anticipated results. Investors are advised to exercise caution, conduct independent research, and make decisions aligned with their individual risk tolerance.
About Author: Nilesh Hembade is the Founder and Lead Author of Coinsprobe, with over 5 years of experience in the cryptocurrency and blockchain industry. Since launching Coinsprobe in 2023, he has been providing daily, research-driven insights through in-depth market analysis, on-chain data, and technical research.

Disclaimer: The information on this page may come from third parties and does not represent the views or opinions of Gate. The content displayed on this page is for reference only and does not constitute any financial, investment, or legal advice. Gate does not guarantee the accuracy or completeness of the information and shall not be liable for any losses arising from the use of this information. Virtual asset investments carry high risks and are subject to significant price volatility. You may lose all of your invested principal. Please fully understand the relevant risks and make prudent decisions based on your own financial situation and risk tolerance. For details, please refer to
Disclaimer.
Related Articles
XRP Breaks Above $1.40 as Spot ETF Inflows Hit $17.6M Milestone
XRP breaks $1.40 after Ripple partnership boosts investor confidence and market momentum.
Spot XRP ETFs record $17.6M inflows, signaling rising institutional demand and interest.
Technical indicators show resistance ahead, with support holding near $1.40 and $1.3840.
Ripple’s XRP is
CryptoNewsLand1h ago
PEPE Reclaims 0.00000400 — Is This 1.8% Move the Start of a Bigger Run?
PEPE rebounds from 0.00000385 support, forming higher lows and stronger bullish structure.
Technical indicators like MACD and RSI show momentum with room for further upside.
Key resistance at 0.00000410; support at 0.00000380 critical for trend continuation.
PepeCoin — PEPE, has
CryptoNewsLand6h ago
ETH drops 0.58% in 15 minutes: derivatives liquidity contraction and proactive position reduction dominate short-term pullback
From 2026-04-19 04:30 to 2026-04-19 04:45 (UTC), within ETH’s 15-minute candlestick chart, the return recorded -0.58%, and the price range was 2321.62 to 2342.04 USDT, with an amplitude of 0.87%. The short-term selloff occurred against a backdrop of increased overall market volatility and a broad decline in the prices of major crypto assets; overall market risk appetite clearly fell, and traders’ wait-and-see sentiment strengthened.
The main driver behind this abnormal move is a sharp contraction in liquidity in the derivatives market and leveraged funds proactively reducing positions. Data shows that over the past 24 hours, the ETH/USD perpetual contract trading volume dropped 67.16% to approximately 74.87 million, open interest edged down 3.33% to 329 million, and liquidation amounts did not expand unusually. This structure indicates that the market lacks the risk of passive cascades; more funds chose to proactively step aside and wait on the sidelines, intensifying short-term selling pressure.
In addition, the long/short structure in which shorts held the upper hand (long/short ratio 47.48%:52.52%) and sentiment synchronization with the panic range reinforced the downward price trend. During the same period, major coins such as BTC and SOL also fell 2%-3.4% in tandem, further showing that this pullback was driven by system-wide risk sentiment. On-chain funds did not show any large abnormal transfers or large-scale liquidations of DeFi protocols; spot and on-chain liquidity remained generally stable, and no sudden system risk resonance was observed.
Current volatility-related risks still need close monitoring, especially as overall risk appetite continues to contract—ETH’s short-term price may face further downside probing. Watch subsequent changes in derivatives trading volume and open interest, extreme shifts in the long/short ratio and funding rate, and promptly monitor on-chain fund flows, large transfers, and any signs of amplified platform net outflows. For more market anomalies and deeper analysis, please continue to follow our upcoming market updates.
GateNews7h ago
Spark Protocol's January delisting of rsETH proves prudent as Aave faces ETH liquidity crisis
Spark Protocol's strategy of delisting low-usage assets and tightening collateral has faced initial backlash but proved wise during market turmoil. While maintaining higher interest rate caps, SparkLend ensures liquidity, unlike Aave, which now faces significant risks.
GateNews7h ago
Request Network (REQ) Surges 23.68% in 15 Minutes, 24-Hour Gain Reaches 116.52%
Request Network (REQ) surged 23.68% in just 15 minutes, reaching $0.152, with a 24-hour rise of 116.52% and trading volume over $8 million. Factors include retail interest and whale accumulation. Resistance at $0.160 and support at $0.122 are under observation.
GateNews8h ago
Solana Price Stalls Near $80 as ETF Outflows Weigh
Solana trades around $80, facing bearish sentiment due to ETF outflows and declining retail participation. Technical indicators show mixed signals, with resistance at $87 and $98, while support at $77 remains critical for stability.
CryptoFrontNews13h ago
