 Pump.fun enters January 2026 in a fragile spot. After a steep drop from its late-2025 highs, the PUMP price is now trading near $0.001964 and trying to find a floor. The sharp swings are gone, volume is thin, and price has slowed into a tight range.
Whale buying gave the token a brief lift at the end of December, but concerns around the platform’s model and falling user numbers continue to hang over the market.
The PUMP price spent most of December trending lower after losing the $0.003 level. The move was steady, not panicked, which suggests sellers stayed in control while buyers stepped aside.
Late in december, on-chain data showed several large wallets accumulating Solana DeFi tokens, including PUMP. That helped price stabilize, but it did not trigger a strong recovery.
At the same time, large off-chain transfers and renewed criticism of Pump.fun’s bonding curve design raised fresh questions about long-term sustainability. Right now, the PUMP price is stuck between speculative interest and growing doubts.
Pump.fun enters January 2026 in a fragile spot. After a steep drop from its late-2025 highs, the PUMP price is now trading near $0.001964 and trying to find a floor. The sharp swings are gone, volume is thin, and price has slowed into a tight range.
Whale buying gave the token a brief lift at the end of December, but concerns around the platform’s model and falling user numbers continue to hang over the market.
The PUMP price spent most of December trending lower after losing the $0.003 level. The move was steady, not panicked, which suggests sellers stayed in control while buyers stepped aside.
Late in december, on-chain data showed several large wallets accumulating Solana DeFi tokens, including PUMP. That helped price stabilize, but it did not trigger a strong recovery.
At the same time, large off-chain transfers and renewed criticism of Pump.fun’s bonding curve design raised fresh questions about long-term sustainability. Right now, the PUMP price is stuck between speculative interest and growing doubts.
- What the Pump.fun Chart Is Showing
- What Market Indicators Are Saying
- PUMP Price Short-Term Outlook for January 2026
What the Pump.fun Chart Is Showing
On the 4H chart, the trend is still pointing lower. Since the October breakdown, price has continued to form lower highs, and every bounce has faded quickly.
The PUMP price is now moving sideways around the $0.0019–$0.0020 area. This zone has acted as short-term support, with sellers failing to push price much lower. Still, buyers have not shown enough strength to reverse the trend.
The large sell-off earlier in the move marked a shift away from hype trading. Since then, the pump price has drifted lower in a slow grind, which often reflects declining retail participation rather than forced selling.
For the structure to improve, PUMP would need to move back above the $0.0024–$0.0026 range. Until that happens, the chart remains weak.
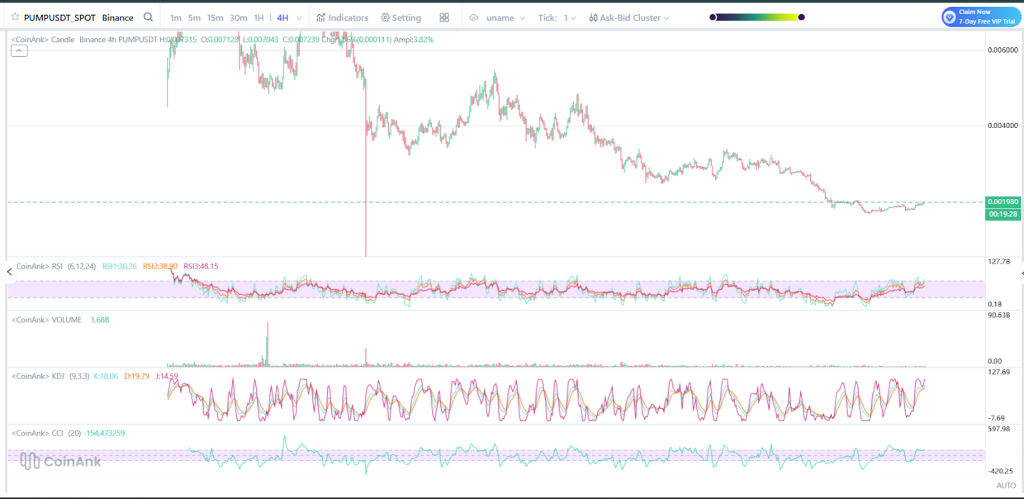
Source: Coinank
What Market Indicators Are Saying
Momentum indicators reflect caution, not confidence.
The RSI is sitting in the low 30s and slowly ticking higher. That shows selling pressure is easing, but buyers are still careful.
Volume is much lower than it was earlier in the year. This usually points to reduced interest rather than accumulation. Without a pickup in volume, upside moves are likely to stall.
_Read Also: _****Bitcoin to $32k In January? The 4-Year Cycle Argument That Has Traders Nervous
KDJ and CCI remain choppy, swinging quickly between levels. That behavior matches the sideways price action and short-term trading seen on the chart. Overall, indicators suggest stabilization near lows, not a confirmed bottom.
PUMP Price Short-Term Outlook for January 2026
Through January, PUMP is likely to stay range-bound unless sentiment across Solana DeFi improves.
As long as the Pump.Fun price holds above the $0.0018–$0.0019 zone, downside risk looks contained. A clear break below that area would bring the $0.0016 level into view.
On the upside, a move above $0.0022 would be an early sign of strength. A push through $0.0025 could open the door to a larger bounce, but that would require stronger volume and renewed confidence in the platform.
For now, the PUMP price is in stabilization mode. Whale interest offers some support, but price still needs clear confirmation before January can turn constructive.
Disclaimer: The information on this page may come from third parties and does not represent the views or opinions of Gate. The content displayed on this page is for reference only and does not constitute any financial, investment, or legal advice. Gate does not guarantee the accuracy or completeness of the information and shall not be liable for any losses arising from the use of this information. Virtual asset investments carry high risks and are subject to significant price volatility. You may lose all of your invested principal. Please fully understand the relevant risks and make prudent decisions based on your own financial situation and risk tolerance. For details, please refer to
Disclaimer.
Related Articles
Bitcoin meltdown to $10,000 remains likely unless prices reclaim $75,000, analyst says
A familiar voice is back with a familiar, and controversial, call on bitcoin BTC$66,860.50.
Mike McGlone, senior commodity strategist for Bloomberg Intelligence, is reiterating that bitcoin could crash to $10,000.
But this time, he's framed it with a very clear line in the sand: $75,000.
If bitco
CoinDesk10m ago
Arthur Hayes: Bitcoin’s long-term target price is $250k to $750k, and in the short term it could fall below $60k
Arthur Hayes said on a podcast that, because the Federal Reserve has not expanded liquidity, he will not put more money into Bitcoin. He expects his medium- to long-term target price to be between $250,000 and $750,000. He warned that if the Iran–U.S. conflict continues, Bitcoin could fall below $60,000 in the short term. Meanwhile, Charles Schwab will launch spot trading for Bitcoin and Ethereum. Research shows that after major shocks, Bitcoin has performed better than gold and the S&P 500, and its current price has rebounded to $67,300.
GateNews4h ago
The Crypto Fear and Greed Index rises to 13 today, and the market is still in an extreme fear state
Gate News message, April 6, according to Alternative.me data, today the Crypto Fear & Greed Index rose to 13, up 1 point from yesterday’s 12. Despite the index recovering, market sentiment is still in an “extreme fear” state.
GateNews4h ago
Michael Saylor dismisses Schiff's warning that 'MSTR will collapse,' citing 36% annual profits from Bitcoin
Michael Saylor, CEO of MicroStrategy, defends the company's Bitcoin strategy against investor Peter Schiff's warning about MSTR stock. Despite losses, Saylor emphasizes Bitcoin's superior performance compared to gold and the S&P 500 since 2020.
TapChiBitcoin4h ago
BTC 15-minute rise of 0.79%: Institutional pullback and structural fund outflows driving market fluctuations
2026-04-05 22:30 to 2026-04-05 22:45(UTC), the BTC price fluctuated in the range of 67416.0 to 67986.7 USDT. Within 15 minutes, the return reached +0.79%, and the amplitude was 0.85%. The rapid change on the market quickly drew attention, with volatility increasing, but overall trading volume did not show extreme amplification, and sentiment was mainly cautious and volatile.
The main drivers behind this move are the continued withdrawal of institutional funds and large capital net outflows to outside trading platforms. On-chain data shows that in the past 24 hours, the whole-network BTC net outflow was -2,1
GateNews6h ago
Bitcoin tends to outperform gold and stocks after global shocks, Mercado Bitcoin finds
Bitcoin BTC$67,345.02 tends to outperform traditional safe haven assets like gold in the two months following major global crises, according to new analysis from Brazilian crypto exchange Mercado Bitcoin.
The study, led by Rony Szuster, head of research at the Latin American crypto platform,
CoinDesk8h ago
