Bitcoin surged past $90,000 on December 29 but retraced all gains within 12 hours, a V-shaped reversal that has occurred 30 times in December. Traders accuse Binance and Wintermute of manipulation, with CVD data showing aggressive buying pushing prices up followed by aggressive selling reversing the trend. On-chain data indicates that 87 BTC were transferred from Binance to Wintermute wallets, with total liquidations reaching tens of millions of dollars.
The Perfect Crime Scene for Stop Hunt Killers
The price action on December 29 appears to be a carefully crafted trap. Bitcoin rapidly rose from $85,000 to break $90,000, attracting many retail traders to chase the rally. However, once the price hit a key psychological level, aggressive sell orders suddenly appeared, causing the price to fall back to the starting point within hours. This pattern is known in professional trading as a “Stop Hunt,” a classic tactic where market makers manipulate prices during periods of low liquidity.
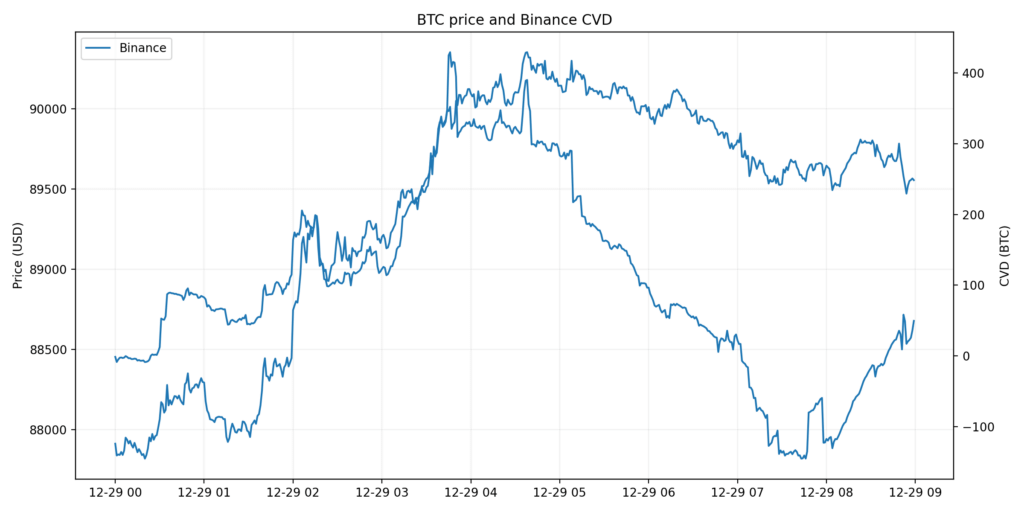
Binance’s CVD data reveals the microstructure of this process. Intraday trading was driven by a sharp surge in aggressive buying, with the volume difference spiking as market orders pushed the bid higher. Subsequently, aggressive selling caused an equally sharp reversal, with the volume difference collapsing. The price ultimately returned roughly to the starting point, and net CVD remained near flat throughout the trading session. This was not a natural trend-building movement but a rapid rise and fall, profitable for traders controlling the pace.
CoinGecko data shows Binance’s trading volume during the holiday period remained below $10 billion, while other major exchanges recently failed to break the $1 billion mark. This liquidity drought created a perfect environment for manipulation. In normal markets, manipulating Bitcoin’s price would require billions of dollars, but during holiday low-liquidity periods, tens of millions are enough to cause significant volatility.
Coinglass data indicates that over the past 1 hour, 4 hours, and 24 hours, open interest changed by 0.08%, -0.67%, and 0.03%, respectively. During these periods, total liquidations reached tens of millions of dollars, with both longs and shorts incurring losses. However, this was not a scenario of massive one-sided liquidations typical of large-scale squeeze events. This bidirectional liquidation pattern is characteristic of stop hunt tactics: triggering short stops upward, then long stops downward, with market makers arbitraging in between.
Market Makers’ Dual Roles and the Gray Area
Wintermute and other market makers play dual roles in the crypto market. In theory, they provide liquidity, narrow bid-ask spreads, and improve market efficiency. But in periods of low liquidity, these institutions with vast capital and high-frequency trading systems can easily turn into market manipulators. On-chain snapshots show over 87 BTC transferred from Binance to Wintermute wallets, though the specific intent is unclear, the timing aligns closely with sharp price swings.
Three Advantages Market Makers Have in Manipulating the Market
1. Asymmetric Information Advantage
· Access to full order book depth data
· Knowledge of retail stop-loss concentration levels
· Ability to precisely calculate the capital needed to trigger stops
2. Technical Execution Advantage
· Millisecond response times with high-frequency trading systems
· Cross-exchange arbitrage capabilities
· Ability to hedge risks across multiple platforms simultaneously
3. Capital Scale Advantage
· During low liquidity periods like holidays, a few tens of millions can manipulate prices
· Push prices on weaker platforms, then hedge on other exchanges
· Quickly rebalance inventories and collateral before market reversals
Wimar X’s claim of “billions of dollars in manipulation” may exaggerate the actual scale, but the core logic holds. In highly liquid markets, manipulation requires astronomical sums. But during holidays, when most institutional traders are on leave and retail attention is scattered, market depth plummets. Traders with sufficient size and speed can easily push prices on weak platforms and then rebalance inventories across venues before the market turns.
Importantly, such operations exist in a legal gray area. Traditional financial markets have clear definitions and strict penalties for manipulation, but crypto market regulation remains imperfect. Market makers can claim they are merely “providing liquidity” and engaging in “normal trading,” even if their actions effectively hunt retail stop-loss orders.
Suspicious Cross-Platform Synchronization Patterns
(Source: Ted Pillows, Trading View)
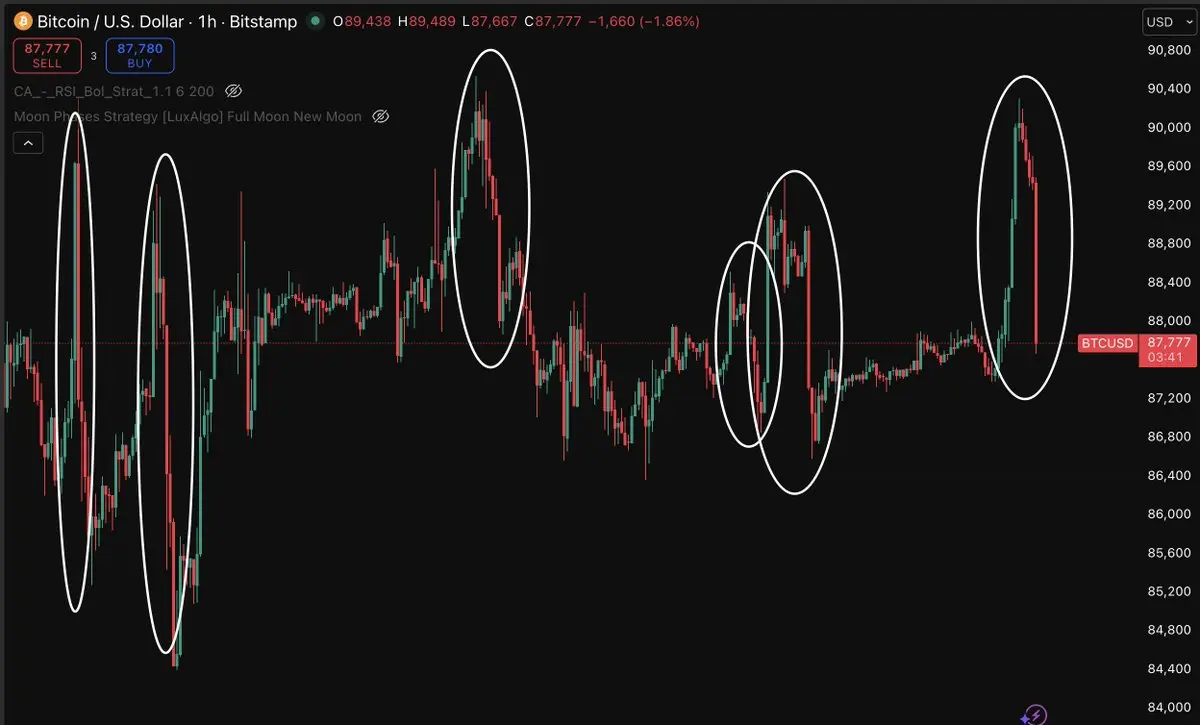
The most troubling evidence comes from price synchronization across platforms. Multiple CEXs repeatedly showed the same V-shaped peaks and drops throughout December. Different exchanges, similar patterns, repeated over time.
This suggests two possibilities. First, the market structure itself is fragile, where even slightly larger buy or sell orders can trigger chain reactions. Second, coordinated operations by market makers executing the same strategies across multiple platforms. The truth may lie somewhere in between: market fragility provides fertile ground for manipulation, while opportunistic behavior by market makers repeatedly exploits this vulnerability.
TedPillows’ charts show recurring peaks and troughs, with clown emojis added. This visual pattern reveals a key fact: the price movements are too regular to be explained by natural supply and demand. If genuine, fluctuations should appear more random. But when the same jagged pattern repeats 30 times, it indicates systemic forces at play.
Prices on other platforms generally track Binance’s prices closely, with no signs of disconnection, indicating this is not merely a technical glitch or isolated incident. Instead, it’s a cross-platform, systemic phenomenon. Active trading volumes surged, on-chain data shows inflows to market maker and exchange addresses across platforms, all pointing to well-capitalized traders exploiting the current environment for short-term gains.
Retail Survival Tips and Market Warnings
Evidence suggests the current environment is highly susceptible to stop-loss attacks structurally. The behaviors described by traders are plausible and consistent with known trading patterns, but data does not identify specific behind-the-scenes manipulators, nor can it exclude reasonable suspicion of intent. However, for retail investors, the existence of a clear manipulation conspiracy is less important than how to protect oneself in this environment.
The primary strategy is to avoid using high leverage during low liquidity periods. During holidays, trading volume shrinks, and price swings are artificially amplified; opening leveraged positions at such times is akin to self-sabotage. Second, when setting stop-loss orders, avoid obvious psychological levels. Round numbers like $90,000 or $85,000 are hotspots for stop-loss clustering and prime targets for market makers’ hunts. Third, be alert to sudden one-sided moves. Rapid price increases or decreases over short periods without clear fundamental catalysts are often signs of stop-loss hunting.
