 Trusted Editorial content, reviewed by leading industry experts and seasoned editors. Ad Disclosure
Bitcoin continues to trade below the $90,000 level after multiple failed attempts to break higher since December 14, reinforcing a growing sense of caution across the market. Each rejection near this psychological threshold has added weight to the bearish narrative, with an increasing number of analysts now warning that Bitcoin may be entering a prolonged corrective phase in the year ahead.
Trusted Editorial content, reviewed by leading industry experts and seasoned editors. Ad Disclosure
Bitcoin continues to trade below the $90,000 level after multiple failed attempts to break higher since December 14, reinforcing a growing sense of caution across the market. Each rejection near this psychological threshold has added weight to the bearish narrative, with an increasing number of analysts now warning that Bitcoin may be entering a prolonged corrective phase in the year ahead.
Related Reading: Bitcoin Capital Continues to Exit: Why A Negative 7dMA Signals A High-Risk RegimeDespite this muted price action, on-chain data suggests a more nuanced picture beneath the surface. Top analyst Axel Adler recently shared a chart tracking Bitcoin realized losses using a seven-day moving average and a z-score framework, highlighting a clear transition from November’s extreme capitulation to a period of normalization in December.
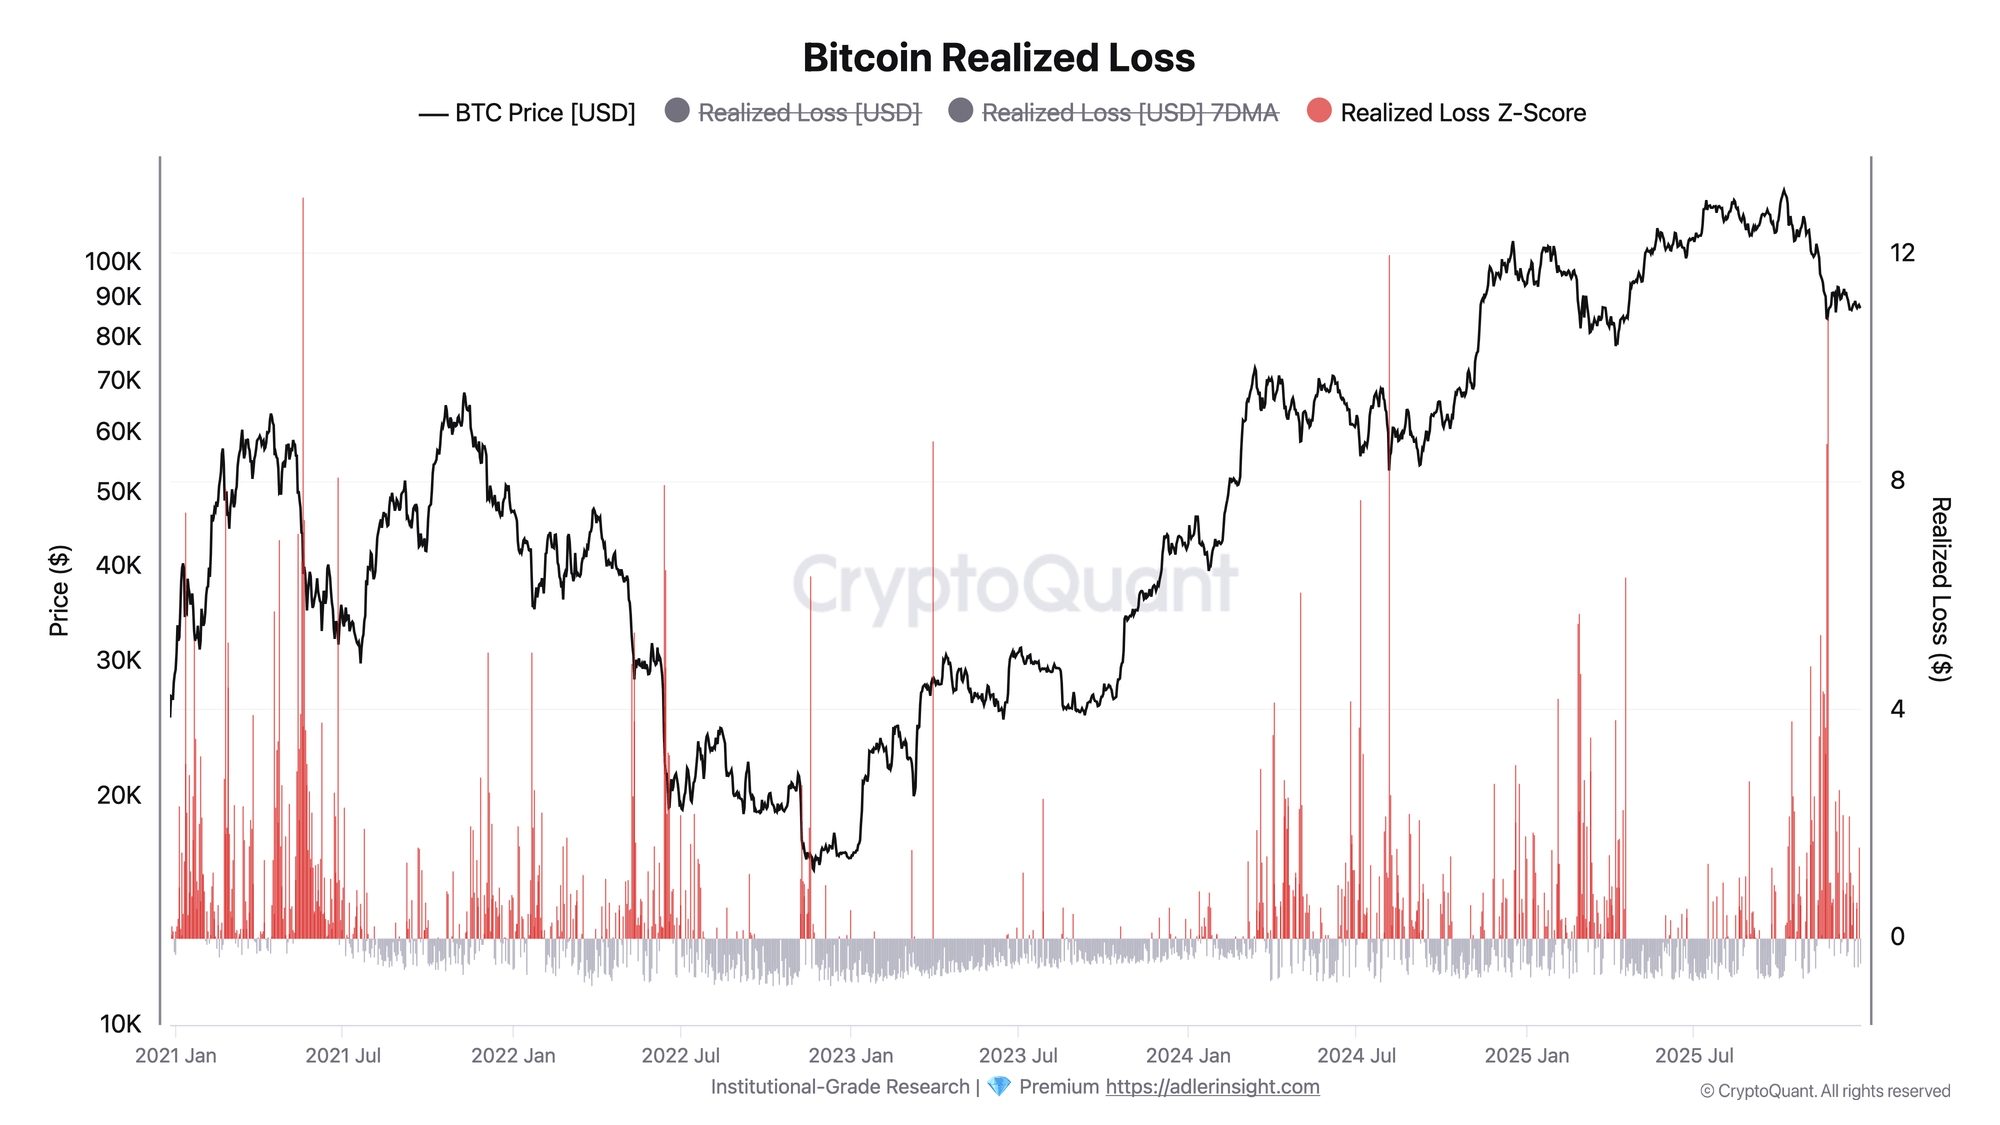 Bitcoin Realized Loss (Z-Score) | Source: Axel AdlerThis metric measures the volume of losses realized when coins move, with the z-score used to identify stress extremes within the market.
November marked the peak of selling pressure. On November 21–22, the realized loss z-score surged to between 8.7 and 10.9, with daily losses exceeding $5 billion. In comparison, the late-December spike on December 26, which reached a z-score near 1.6, appears relatively minor. More importantly, weekly realized losses have collapsed from roughly $2.4 billion at the peak to around $0.5 billion, returning to levels last seen in September and October.
According to Adler, this sharp decline points to structural seller exhaustion rather than a temporary lull. Historically, markets often stabilize after such conditions, suggesting that while the price remains weak, downside pressure may be fading.
Bitcoin Indicator Signals Fading Downside Pressure
Adler’s report also highlights Bitcoin’s Net Realized Profit/Loss (P/L) metric, smoothed using a seven-day moving average, offering further insight into the market’s internal dynamics. This indicator tracks the balance between realized profits and realized losses over time. When the value is negative, losses dominate and capital is being destroyed; when positive, profit-taking outweighs loss realization.
Currently, Bitcoin’s net realized P/L remains in negative territory, confirming that the market has not fully exited a risk-off regime. However, the direction of travel is notable. Over the final week of December, the depth of negative net P/L shrank by nearly half, signaling a meaningful reduction in loss intensity.
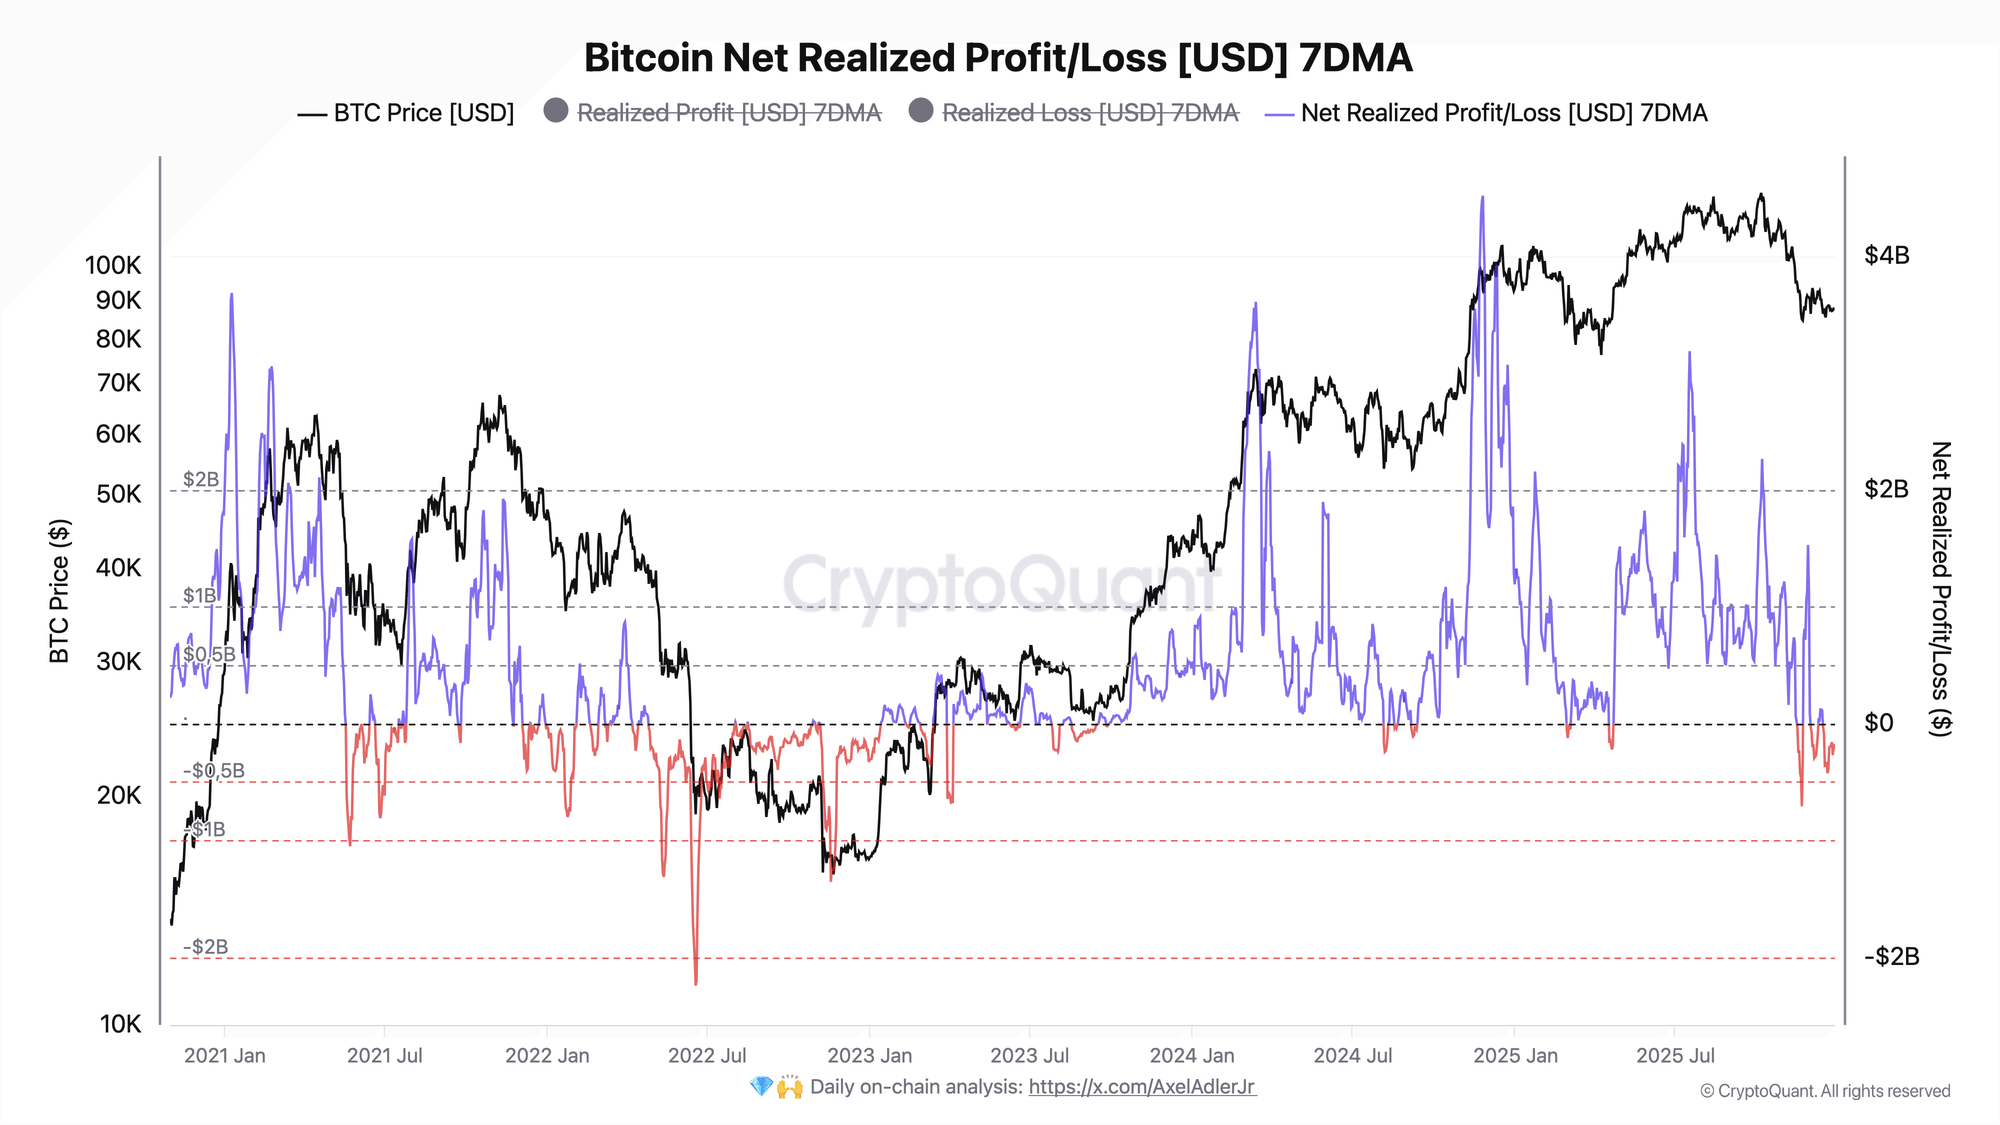 Bitcoin Net Realized Profit/Loss | Source: CryptoQuantImportantly, this improvement has unfolded without a strong price recovery, suggesting that the change is driven by seller exhaustion rather than an artificial price squeeze or short-term speculation.
According to Adler, this behavior is structurally significant. When net realized P/L trends upward toward the zero line, it reflects a transition phase in which forced selling subsides, and marginal supply weakens. Historically, a sustained move back into positive territory has coincided with the early stages of local market recoveries.
Taken together, the realized loss and net P/L charts present a consistent narrative. November appears to have absorbed the majority of weak hands, December functioned as an absorption and stabilization phase, and January could represent a potential inflection point—provided new demand begins to enter the market.
Related Reading: Ethereum In Limbo As Muted On-Chain Flows Reflect Market Indecision
Price Remains Range-Bounded
Bitcoin remains locked in a tight consolidation below the $90,000 level, as shown on the 4-hour chart, reflecting persistent indecision after repeated failed breakout attempts. Price is currently trading near $87,600, holding within a narrow range that has defined market behavior throughout the second half of December. This structure highlights a balance between buyers defending local support and sellers consistently fading rallies.
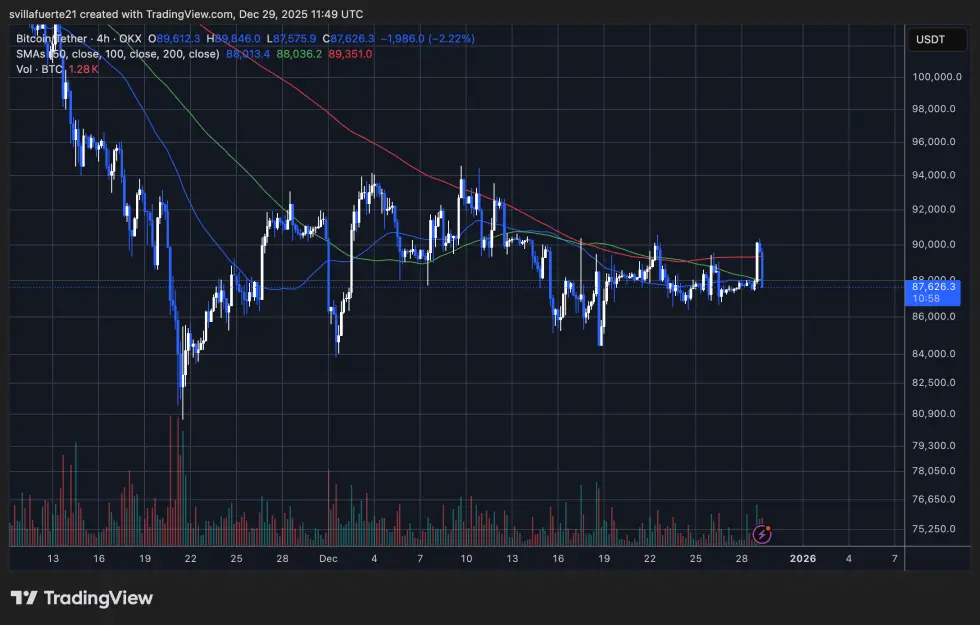 BTC consolidates around critical price level | Source: BTCUSDT chart on TradingView
From a technical standpoint, Bitcoin is trading below the declining 200-period moving average, which continues to act as a key dynamic resistance near the $89,000–$90,000 zone. The 100-period moving average has flattened and is closely aligned with price, signaling a lack of momentum in either direction.
BTC consolidates around critical price level | Source: BTCUSDT chart on TradingView
From a technical standpoint, Bitcoin is trading below the declining 200-period moving average, which continues to act as a key dynamic resistance near the $89,000–$90,000 zone. The 100-period moving average has flattened and is closely aligned with price, signaling a lack of momentum in either direction.
Meanwhile, the shorter-term moving average has rolled over, reinforcing the short-term bearish bias and confirming that upside attempts are being absorbed.
Related Reading: Bitcoin OG Moves 100,000 Ethereum To Binance, Raising Questions On Positioning
The price action since mid-December shows a clear compression pattern, with lower highs forming beneath resistance and higher lows developing above the $86,000–$87,000 support region. This tightening range suggests that volatility is being suppressed, often preceding a decisive move.
Structurally, the $86,000 level remains critical. A clean breakdown below this support could open the door to a deeper retracement toward the low $80,000s. Conversely, reclaiming and holding above $90,000 would invalidate the current bearish structure and signal renewed upside momentum.
Featured image from ChatGPT, chart from TradingView.com
![]() Editorial Process for bitcoinist is centered on delivering thoroughly researched, accurate, and unbiased content. We uphold strict sourcing standards, and each page undergoes diligent review by our team of top technology experts and seasoned editors. This process ensures the integrity, relevance, and value of our content for our readers.
Editorial Process for bitcoinist is centered on delivering thoroughly researched, accurate, and unbiased content. We uphold strict sourcing standards, and each page undergoes diligent review by our team of top technology experts and seasoned editors. This process ensures the integrity, relevance, and value of our content for our readers.
Disclaimer: The information on this page may come from third parties and does not represent the views or opinions of Gate. The content displayed on this page is for reference only and does not constitute any financial, investment, or legal advice. Gate does not guarantee the accuracy or completeness of the information and shall not be liable for any losses arising from the use of this information. Virtual asset investments carry high risks and are subject to significant price volatility. You may lose all of your invested principal. Please fully understand the relevant risks and make prudent decisions based on your own financial situation and risk tolerance. For details, please refer to
Disclaimer.
Related Articles
NYSE Welcomes Morgan Stanley’s MSBT Launch as First Spot Bitcoin ETF Issued by a Major US Bank
Bank-backed bitcoin ETFs are accelerating institutional adoption and strengthening market credibility. The NYSE marked a new milestone as Morgan Stanley Investment Management rang the closing bell and celebrated the launch of MSBT, which the NYSE described as the first spot bitcoin ETF by a major
Coinpedia2h ago
BTC falls 0.49% in 15 minutes: fragile long leverage and active sell-off pressure resonate to weigh on the short term
From 18:00 to 18:15 (UTC) on 2026-04-17, the BTC price fluctuated and trended downward within the 77097.4 to 77573.2 USDT range. Over these 15 minutes, the return rate recorded -0.49%, and the amplitude reached 0.61%. During this period, market trading was active; short-term volatility was amplified, and trading attention increased significantly. The main driver behind this abnormal move is that the overall leverage structure is bearish and long positions are fragile. At present, the BTC perpetual contract funding rate has remained negative for 11 consecutive days, indicating that the bears have the upper hand in the market. In addition, futures open interest (OI) is about 628.3 billion USDT, which is at a historical high. During the anomaly window, trading volume increased noticeably. On-chain data shows large amounts of BTC flowing from long-term holder addresses to exchanges, suggesting that active sell orders may have triggered longs to passively reduce positions, amplifying downward price pressure. Moreover, institutional positioning enthusiasm in the mainstream contract market has cooled off; liquidity boundaries have tightened, causing large-trade activity to have an amplified effect on market volatility. In the options market, implied volatility rose to 39.81%, increasing demand for downside protection and reflecting a defensive posture among market participants. Macro-environment volatility and some capital flowing into safe-haven assets, together with the recent regulatory uncertainty-related historical events, reinforced the move, pushing overall market risk appetite lower. Current BTC leverage risks still remain. If, in the future, there are concentrated sell-offs, volatility may be further amplified. It is recommended to continue monitoring sustained high OI levels, the persistence of negative funding rates, and on-chain transfers of large amounts of funds, and to stay alert for whale behavior and any disruptions to market sentiment caused by macro-policy developments. For subsequent price action, please watch key support levels, institutional and whale on-chain moves, and relevant global market news, and guard against short-term risks.
GateNews3h ago
Bitcoin Liquidations Hit $815M as BTC Surges Above $78K Amid Iran Strait Opening
Over $815 million in leveraged cryptocurrency positions were liquidated recently, mainly due to short positions against Bitcoin. Markets improved as Iran reopened the Strait of Hormuz and Trump hinted at a deal with Iran, boosting Bitcoin prices significantly.
GateNews3h ago
Cardano Founder Hoskinson Warns BIP-361 Could Freeze 1.7M Bitcoin
Charles Hoskinson warned that Bitcoin's BIP-361 upgrade, meant to address quantum threats, is wrongly classified as a soft fork. It could freeze 1.7 million BTC, including 1 million from Satoshi Nakamoto, as early coin owners can't prove ownership.
GateNews4h ago
BTC drops 0.45% in 15 minutes: Whale concentrated transfers into exchanges stack up sell pressure while leverage withdrawals amplify the pullback
From 17:00 to 17:15 (UTC) on 2026-04-17, BTC saw a brief drop. The return rate recorded was -0.45%, with the price ranging from 77354.3 to 77916.9 USDT and a swing of 0.72%. During the event, market attention warmed up, volatility intensified, and spot market liquidity changed significantly.
The main driver of this price anomaly was that whale wallets concentrated transfers to exchanges. In a single 15-minute period, the exchange inflow surged to 11,000 BTC, reaching a new high since December 2025. The average amount deposited per transaction was as high as 2.25 BTC, indicating that large holders chose key price levels to concentrate and release their positions, clearly lifting sell pressure. At the same time, BTC futures open interest fell to a 14-month low of $841 million, as leverage funds exited sharply. The spot market’s pull on price fluctuations became the main factor, further magnifying the impact of whale trading.
In addition, although ETF funds had a net inflow with a hedging effect—bringing the April cumulative inflow to $5.651 billion—within this anomaly window they were not able to fully absorb large sell orders. The spot market mainly relied on institutional buying to digest the selling pressure, and overall risk appetite contracted. On-chain data shows that 41% of the BTC supply is in a loss-making range, and some holders who bought at lower prices face take-profit and stop-loss pressure. With multiple factors converging, short-term tension formed among exchange inflows, leverage withdrawal, profit realization, and institutions’ ability to absorb, increasing the magnitude of spot volatility.
Short-term risks are worth watching closely. Users should closely monitor core indicators such as the subsequent exchange inflow volume, the pace of ETF net inflows, and futures open interest. If whale sell orders still have not eased and ETF inflows cannot accelerate in step, the BTC price may remain under sustained pressure. Users should focus on on-chain transfers and changes in major holders’ positions, watch the spot market’s key support ranges and trading structure, obtain more market information in a timely manner, and stay alert to risks brought by sharp volatility.
GateNews4h ago
