
Date: Sat, Dec 27, 2025 | 10:25 AM GMT
Dash (DASH), the privacy-focused token, has struggled alongside the broader altcoin market over the past month, shedding nearly 35% of its value amid persistent selling pressure. However, price action is now starting to stabilize, with DASH trading in the green today and posting a modest 4% recovery. More importantly, the latest chart structure suggests that the recent rebound may not be just a short-lived bounce, but part of a developing bullish setup.
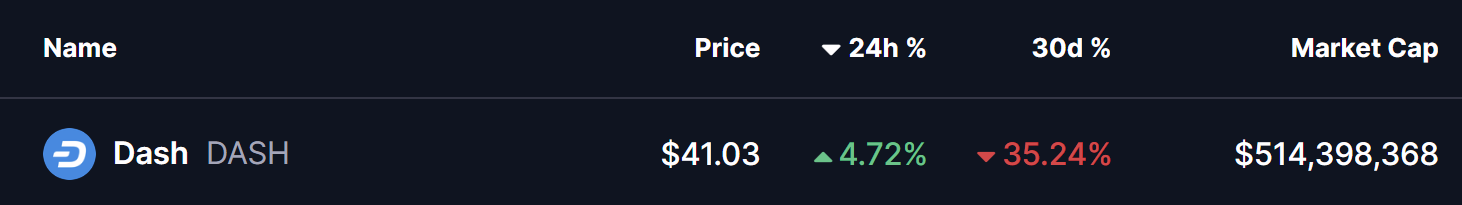
Source: Coinmarketcap
Harmonic Pattern Hints at Potential Upside
On the 4-hour timeframe, DASH is forming a Bearish Butterfly harmonic pattern. While the name may sound negative, this pattern typically allows for a strong upside move during its CD leg before price reaches the final reversal zone.
The structure began at Point X near $42.64, followed by a sharp decline into Point A. From there, DASH rebounded toward Point B, where sellers briefly reasserted control, before price dipped once again into Point C around $36.17. This region has since acted as a firm base, with buyers stepping in aggressively to defend the lows.
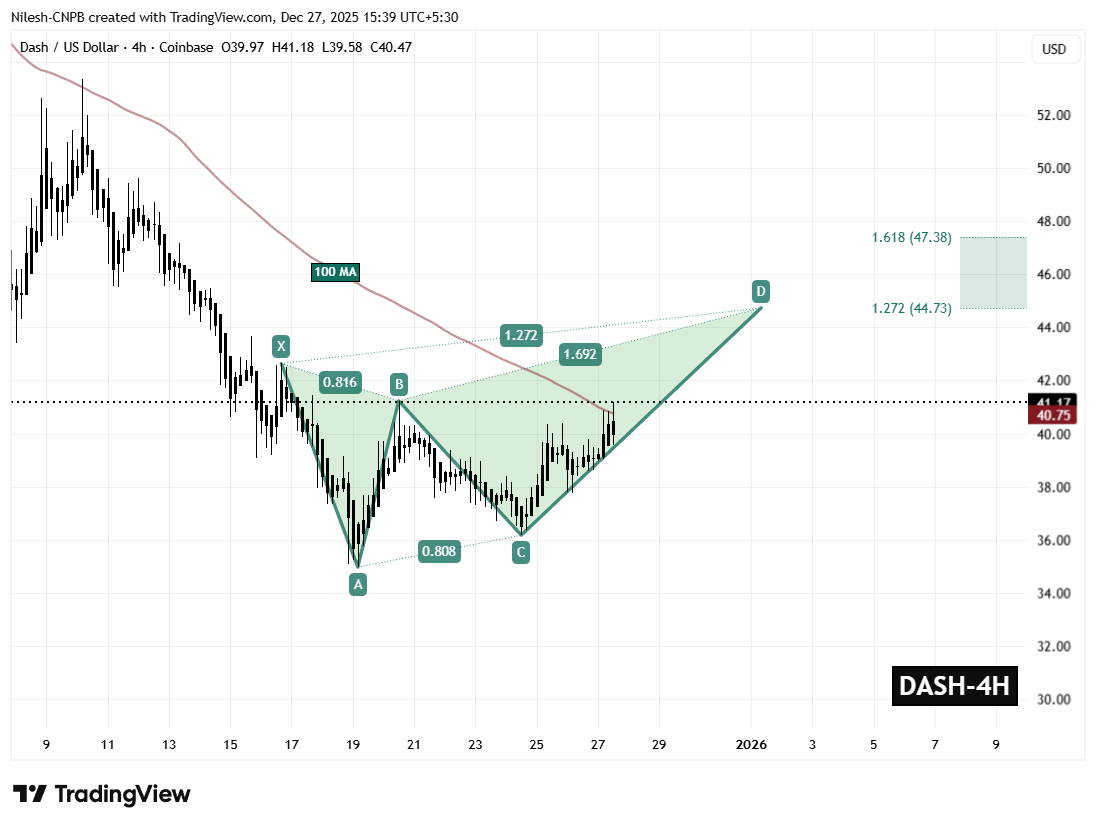
Dash (DASH) 4H Chart/Coinsprobe (Source: Tradingview)
From Point C, DASH has staged a steady recovery and is currently trading near $41.17. This move indicates improving momentum and suggests that the CD leg of the harmonic structure is actively unfolding.
Adding further strength to this setup is DASH’s successful reclaim of the 100-period moving average near $40.75. This level had previously acted as dynamic resistance throughout the downtrend, and flipping it into support marks a meaningful shift in short-term market structure.
What’s Next for DASH?
As long as DASH holds above the $39.58 support zone, the bullish harmonic structure remains intact. Continued strength above the 100 MA would likely reinforce buyer confidence and keep the CD leg in play.
If momentum persists, the Bearish Butterfly projection points toward the Potential Reversal Zone (PRZ) between $44.73 and $47.38. This area represents the typical completion zone for the pattern and offers an upside window of roughly 14% from current levels before sellers may attempt to regain control.
On the flip side, a breakdown below $39.58 would weaken the bullish outlook and risk invalidating the harmonic structure. Such a move could expose DASH to renewed downside pressure and delay any sustained recovery attempt.
For now, DASH’s ability to hold above reclaimed moving average support and continue building higher lows will be critical in determining whether this recovery can extend further in the sessions ahead.
Disclaimer: The views and analysis presented in this article are for informational purposes only and reflect the author’s perspective, not financial advice. Technical patterns and indicators discussed are subject to market volatility and may or may not yield the anticipated results. Investors are advised to exercise caution, conduct independent research, and make decisions aligned with their individual risk tolerance.
Disclaimer: The information on this page may come from third parties and does not represent the views or opinions of Gate. The content displayed on this page is for reference only and does not constitute any financial, investment, or legal advice. Gate does not guarantee the accuracy or completeness of the information and shall not be liable for any losses arising from the use of this information. Virtual asset investments carry high risks and are subject to significant price volatility. You may lose all of your invested principal. Please fully understand the relevant risks and make prudent decisions based on your own financial situation and risk tolerance. For details, please refer to
Disclaimer.
Related Articles
Bitmine Upgrades to the NYSE Main Board! Tom Lee: US stocks may have bottomed out, and selling pressure on Ether could ease
Bitmine has officially moved from the New York Stock Exchange U.S. board to the main board, marking a major milestone for the company. Despite a sharp drop in the stock price, it has still increased the share repurchase plan to $4.0 billion. The company holds a large amount of Ethereum, and expects that a rebound in the crypto market will help strengthen its assets and stock price performance.
CryptoCity1h ago
RAVE’s hype surge triggers a flood of copycat coin mania, as FF and INX expose the “pump-and-dump” scheme
Recently, altcoins represented by RAVE have sparked a fierce investment craze, but some old star projects like FF and INX have used this wave of hype to carry out “pump-and-dump” operations—rapidly driving up coin prices to lure retail investors to buy, and then dumping them heavily, causing the price to plunge rapidly. Such behavior not only exposes the project team’s funding difficulties, but also damages investors’ trust. Investors need to stay alert to signals like abnormal short-term surges in order to avoid the risk of being manipulated by the market.
MarketWhisper1h ago
Bitmine gets promoted to the NYSE main board! Tom Lee: US stocks may have bottomed out, and sell pressure on Ether could ease
Bitmine has officially moved from the NYSE American board to the main board, marking an important milestone for the company. Despite the sharp decline in its share price, it has still increased the share repurchase plan amount to $4 billion. The company holds a large amount of Ethereum, and it expects that a rebound in the crypto market will help boost its assets and share price performance.
CryptoCity4h ago
Why Is Bitcoin Up Today? Hormuz Blockade Triggers Short Squeeze and a BTC Test of $75k
On April 13, Bitcoin rose from its early-session low of 70,741 to trade as high as $74,900 during the session, approaching the $75,000 level. The main drivers came from two directions: after Trump ordered the blockade of the Strait of Hormuz, traders began to view Bitcoin as a geopolitical hedge asset; and a massive net short position that had been building as funding rates stayed persistently negative was met with liquidation, triggering a chain of liquidations totaling millions of dollars near the $70,000 support level.
MarketWhisper6h ago
Bitmine gets promoted to the NYSE main board! Tom Lee: U.S. stocks may have bottomed out, and Ether’s selling pressure may ease
Bitmine has officially moved from the NYSE American board to the main board in the United States, marking an important milestone for the company. Despite a sharp drop in its stock price, it has still increased its share repurchase authorization to $4.0 billion. The company holds a large amount of Ether, and it predicts that a rebound in the crypto market will help boost its assets and stock price performance.
CryptoCity7h ago
U.S. stocks have recovered the losses since the Iran war, while Bitcoin pushes up to 74K
Due to market expectations that the United States and Iran will reach an agreement, the S&P 500 index has rebounded to its highest level since the war, and Bitcoin has also surged to $74,900. Despite the failure of peace talks between the U.S. and Iran, the U.S. has imposed a maritime blockade to pressure Iran. MicroStrategy once again made a large-scale purchase of Bitcoin, indicating that investor confidence is picking up.
ChainNewsAbmedia7h ago
