Since being rejected at the resistance zone of $0.146 about a month ago, Conflux has entered a prolonged correction trend, moving within a downtrend channel and retreating to a local bottom around $0.06.
After several weeks of continuous weakness, this token has begun to show the first signs of recovery, with a notable rebound to $0.078 before facing profit-taking pressure and pulling back.
At the time of writing, Conflux (CFX) is trading around the $0.072 mark, up 8.7% in 24 hours. Market liquidity has significantly improved as trading volume surged by 358%, reaching approximately $58 million, while market capitalization approaches the $400 million threshold.
This development reflects a return of short-term capital flow and more positive speculative sentiment, although the overall trend structure remains not fully sustainable and requires further confirmation.
Partnership with PlaysOut improves market sentiment
In an effort to provide substantial support for CFX during this difficult period, PlaysOut and Conflux have just announced a strategic partnership, focusing on exploring AI-powered gaming solutions and cross-chain interaction capabilities.
According to the announcement, both parties will collaborate to build highly scalable blockchain infrastructure, develop AI-supported interaction tools, and shape next-generation gaming scenarios aligned with Web3 trends.
The partnership also opens up the possibility of deploying mini-games directly on Conflux’s Layer 1 environment, alongside initiatives to attract users from Web2 to Web3 and regional market expansion strategies.
Immediately after the announcement, market sentiment was activated in the short term, serving as a catalyst for a strong speculative buying wave in the spot market.
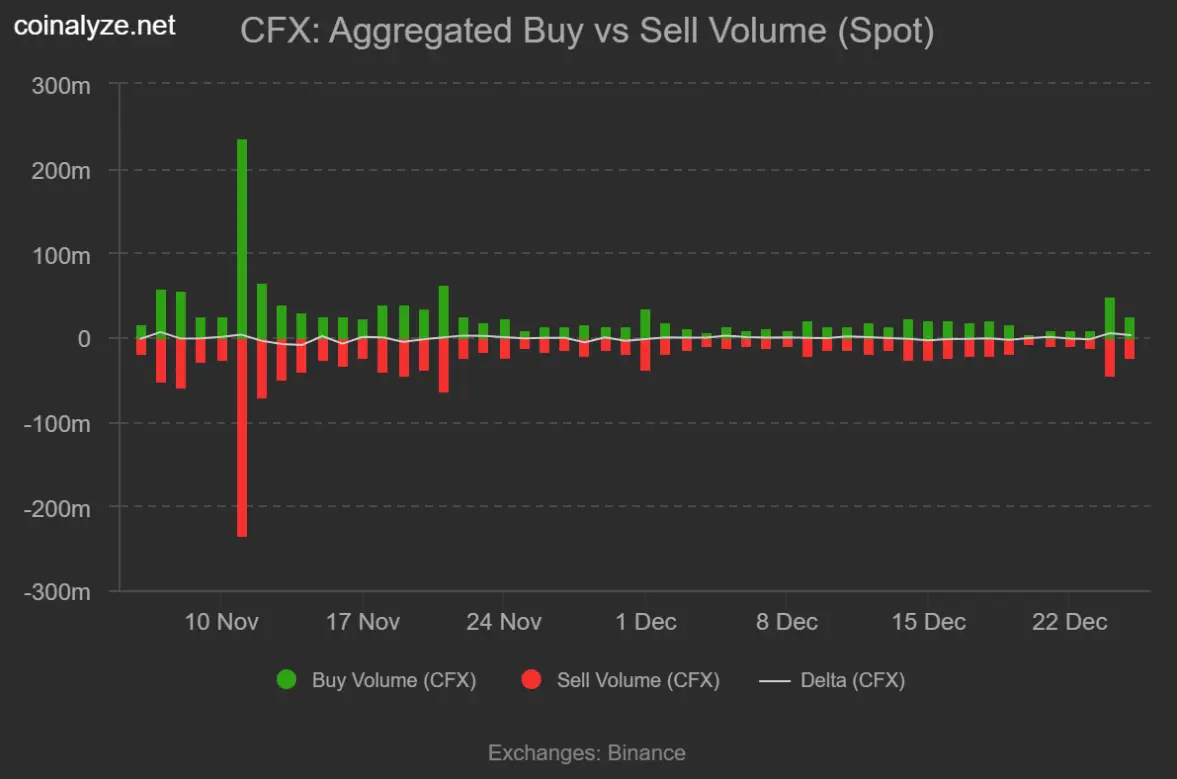
Binance buyers dominate
Following the official announcement of the partnership between Conflux and PlaysOut, demand for CFX surged rapidly in a short period. On Binance, FOMO sentiment quickly spread as buying inflows flooded in, indicating investors’ high expectations for profit potential from this connection.
According to data from Coinalyze, from December 24 to 25, the buy volume reached 74.83 million CFX, far exceeding the 67 million CFX in sell volume. This difference created a positive Buy–Sell Delta of 7.8 million, reflecting a clear accumulation trend in the spot market.
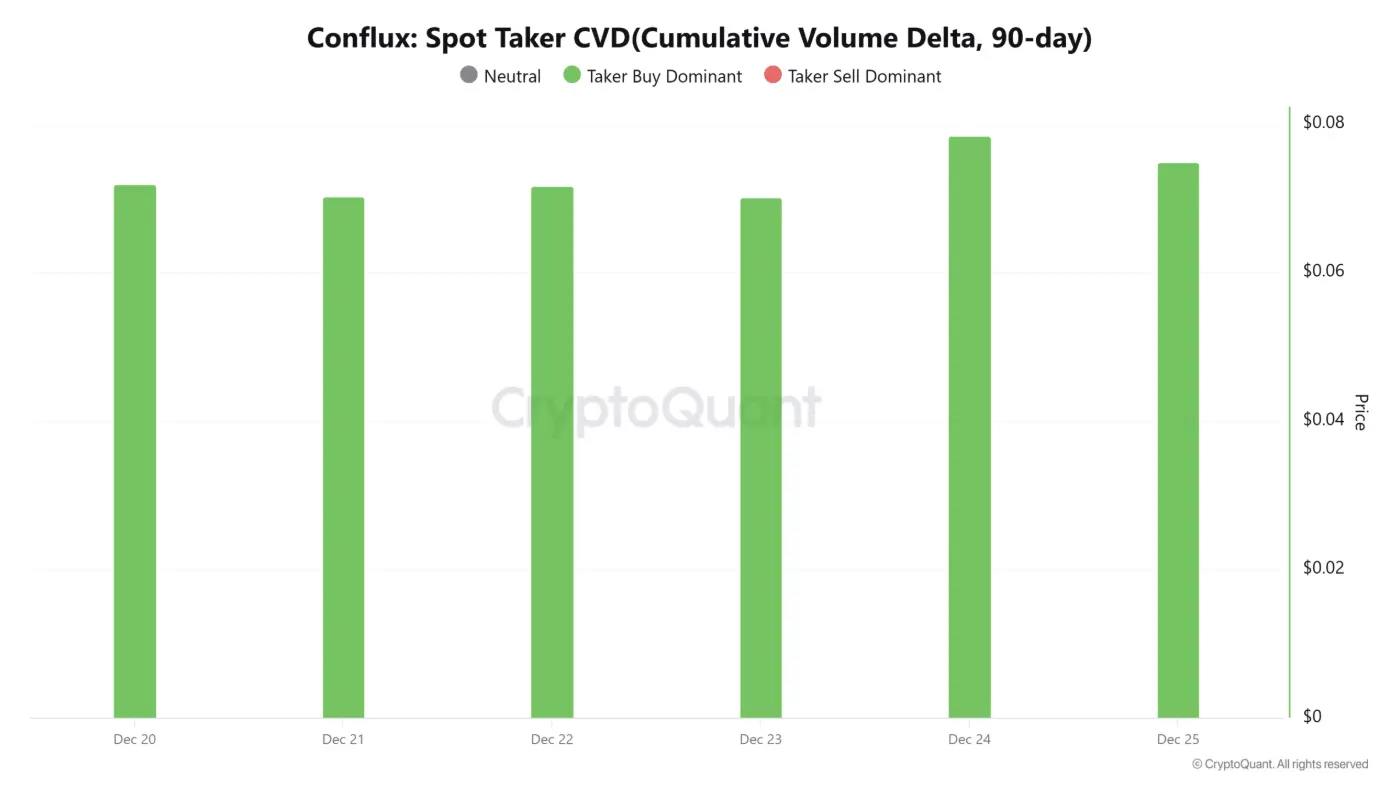
 Source: Coinalyze Notably, spot demand is not only concentrated on Binance but also spreading across the entire market, indicating systemic buying pressure rather than isolated activity. Supporting this view, CryptoQuant’s Spot Taker CVD data shows bullish control increasing to the highest weekly level on December 24, confirming the emergence of a new and strong demand wave for CFX.
 Source: CryptoQuant## Profit-taking pressure returns as price stalls
Although the market is showing signs of recovery, distribution signals have quickly appeared. Data from CoinGlass shows that Spot Netflow unexpectedly turned positive for the first time in nearly three weeks of silence.
At the time of writing, net inflow into exchanges reached about $1.73 million — the highest since August. This indicates an increasing amount of tokens being deposited onto exchanges, a typical signal associated with profit-taking after short-term price rallies.
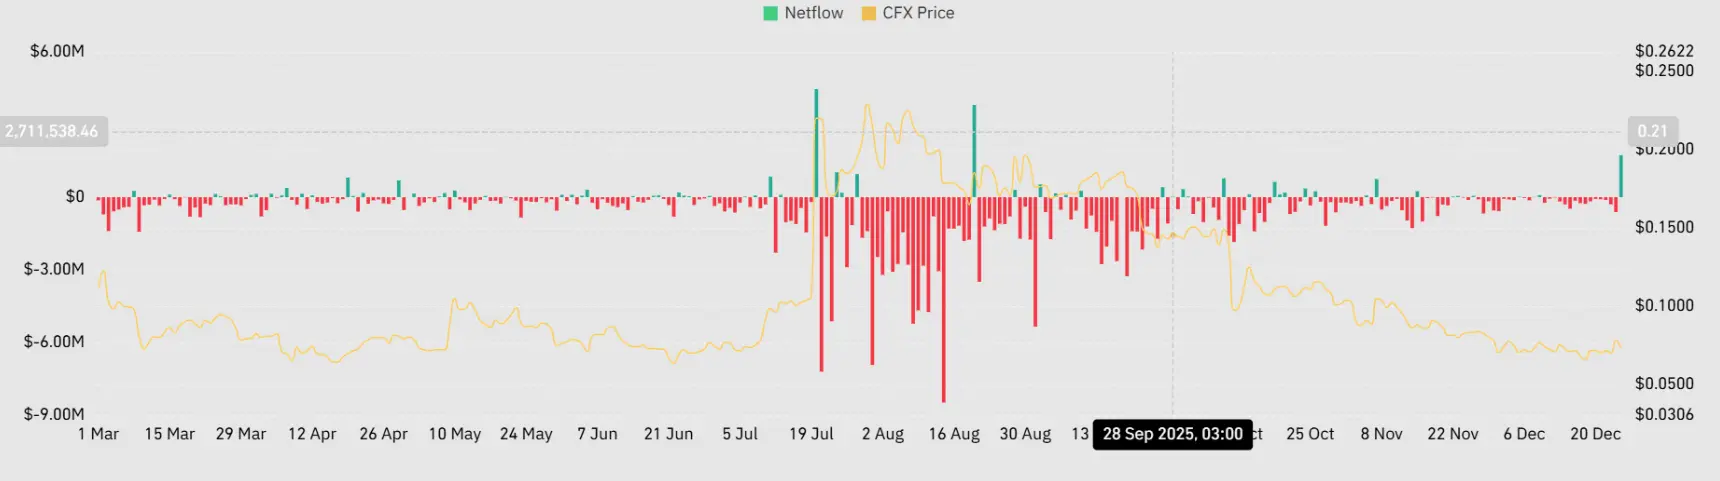 Source: CoinGlass Historically, such profit-taking phases often create new selling pressure for CFX, especially when the overall market trend has not yet been firmly established. This raises concerns that the current recovery could soon face significant challenges.
Is it just a short-term “bubble”?
Current technical signals depict a picture of intense indecision and lack of clear consensus.
Specifically, Conflux’s RSI once broke into positive territory, reaching 54, before quickly cooling down and retreating to around 47 at the time of writing. This movement indicates increased selling pressure, absorbing much of the previous buying momentum and halting the upward movement.
Meanwhile, the Trend Strength Index (TSI) remains deeply in negative territory, at -11, reflecting that the downtrend still dominates and selling pressure has not shown clear signs of weakening.
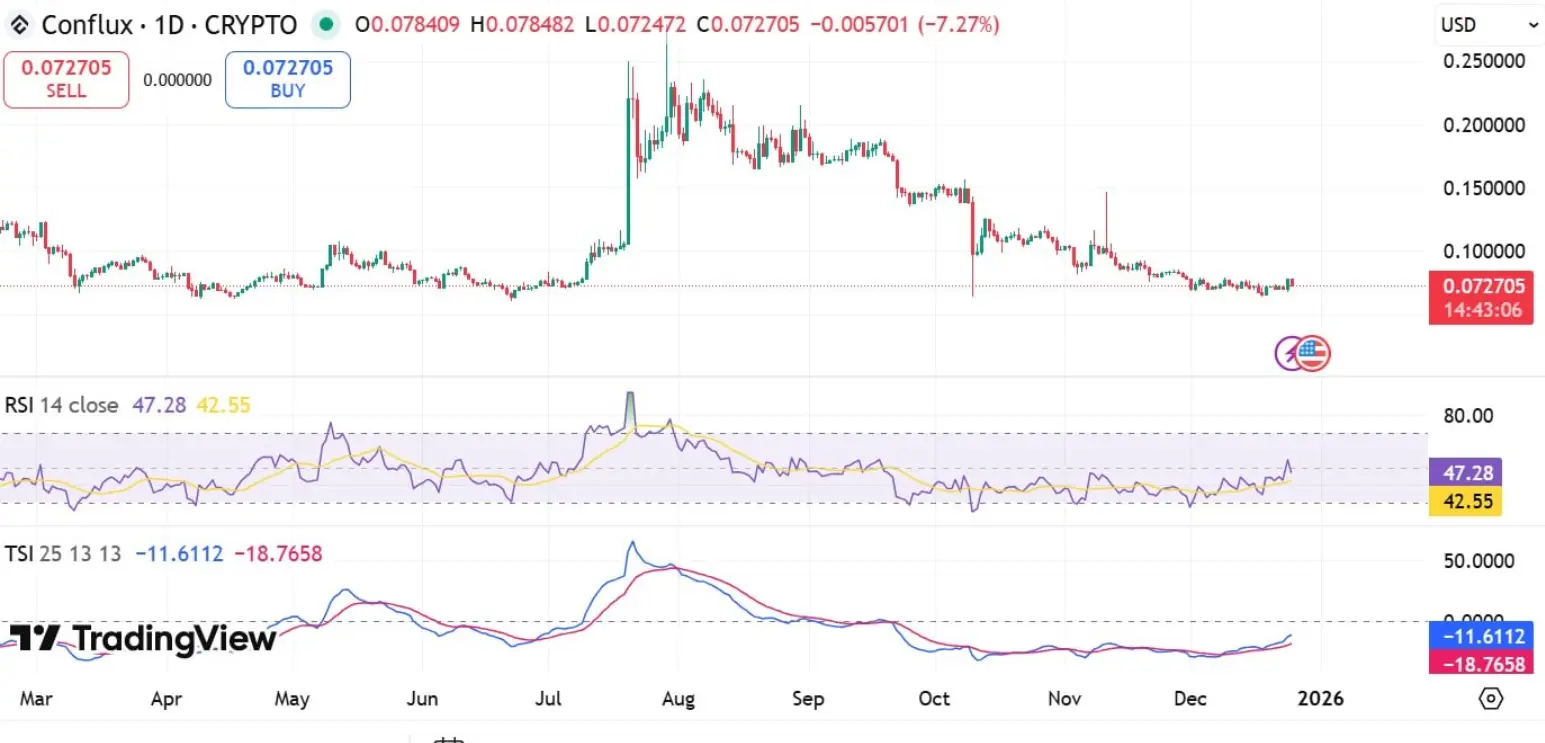 Source: TradingView These conflicting signals suggest the market is in a fierce tug-of-war, with bulls and bears continuously contesting short-term trend control. Therefore, the next price move will largely depend on which side can dominate the other.
In a positive scenario, if the bulls sustain the momentum they have built, Conflux could target resistance around $0.093. Conversely, if selling pressure returns and gains the upper hand, CFX faces the risk of a deeper correction, retreating to the $0.068 zone.
Disclaimer: The information on this page may come from third parties and does not represent the views or opinions of Gate. The content displayed on this page is for reference only and does not constitute any financial, investment, or legal advice. Gate does not guarantee the accuracy or completeness of the information and shall not be liable for any losses arising from the use of this information. Virtual asset investments carry high risks and are subject to significant price volatility. You may lose all of your invested principal. Please fully understand the relevant risks and make prudent decisions based on your own financial situation and risk tolerance. For details, please refer to
Disclaimer.
Related Articles
Bitcoin Rebounds to $74K on U.S.-Iran Framework Deal, But Market Skepticism Remains
Bitcoin's recent rise to mid-$74,000 followed a risk asset rally linked to a U.S.-Iran nuclear framework, but skepticism remains due to flat Treasury yields and unchanged gold prices. The core issue of uranium enrichment persists, and while on-chain data shows BTC's gradual advance, options markets reflect doubts about a sustained breakout. Overall, analysts see the rally as temporary, with macro conditions still tight and potential downside risks.
GateNews17m ago
Cardano Traders Watch $0.243 Support Level as ADA Price Faces Critical Decision
Cardano (ADA) is at a crucial support level of $0.243, with potential gains to $0.30 if it holds. A daily close below this could lead to declines toward $0.10. Currently, trading volume is around $500 million, with ADA notably below its all-time high.
GateNews1h ago
ETH/BTC Price Ratio Rebounds to 0.0313 in Q1 2026 as Ethereum User Base Surges 82%
In Q1 2026, the Ethereum-to-Bitcoin price ratio reached a three-month high at 0.0313. Ethereum added 284,000 users and surpassed $180 billion in stablecoin supply. Bitcoin remained strong above $74,000, driven by significant ETF inflows.
GateNews6h ago
Why is Bitcoin up today? Trump says Iran is seeking a truce, and risk assets move higher across the board
On April 15, Bitcoin rebounded about 6% after Trump said Iran is seeking to reach an agreement, breaking above $75,000. Expectations for the resumption of U.S.-Iran negotiations warmed up, lifting Asian stock markets. Technically, roughly $6 billion worth of short positions were forced to close, accelerating the rebound. Analysts said that if the U.S.-Iran situation continues to ease, Bitcoin could break through $80,000, and they predicted it may reach $150,000 by year-end.
MarketWhisper10h ago
Bitmine is promoted to the NYSE main board! Tom Lee: US stocks may be at a bottom, and selling pressure on Ether could ease
Bitmine officially transferred from the NYSE American market to the main board, marking a significant milestone for the company. Despite a sharp drop in its share price, it still increased the share repurchase program to $4 billion. The company holds a large amount of Ether, and expects that a rebound in the crypto market will help improve its assets and share price performance.
CryptoCity10h ago
ETH 15-minute up 0.66%: On-chain large transfers in sync drove a net inflow of funds, boosting spot buying pressure
2026-04-15 00:00 to 00:15 (UTC), ETH shows a local anomaly. The 15-minute return rate is +0.66%. The trading price range is 2321.93–2343.2 USDT, with a range of 0.92%. During this period, market attention increased, volatility slightly intensified, buy pressure in the order book shifted upward in the short term, and quickly pushed spot prices up into a key resistance area.
The main drivers of this anomaly are large on-chain transfers and inflows of capital in combination. At the beginning of the window, multiple large ETH transfers appeared, including 8,676 ETH and 6,551 ETH, respectively, transferring from a large source to the
GateNews11h ago
