
Date: Tue, Dec 23, 2025 | 07:30 AM GMT
Bitcoin (BTC) has spent the past several weeks moving through a corrective and largely sideways phase after its sharp pullback from record highs near $126,000. The correction pushed BTC into the $87,000 region, cooling momentum with 17% 60 days drop and keeping traders cautious as 2025 approaches its final days.
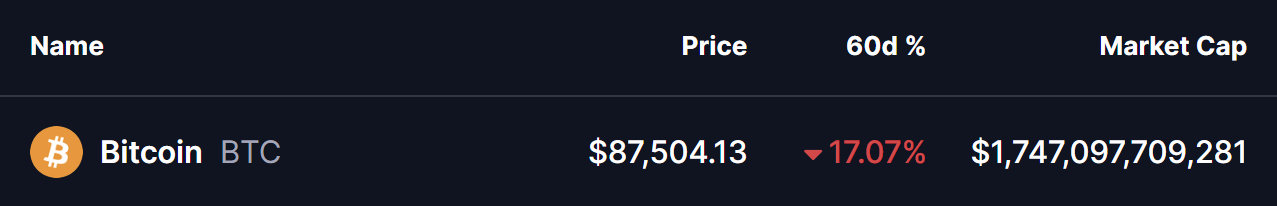
Source: Coinmarketcap
While short-term price action remains uncertain, a powerful long-term signal is flashing from the traditional markets—one that has historically preceded major Bitcoin bull runs heading into the following year.
That signal is coming from the Russell 2000.
A Pattern That Has Repeated Before Every Major BTC Bull Run
A long-term comparative chart shared by crypto analyst @AO_btc_analyst highlights a recurring pattern between Bitcoin and the Russell 2000 Index. Each time the Russell 2000 has successfully broken above a major horizontal resistance level, Bitcoin has gone on to deliver a sustained bullish expansion in the months that followed.
This relationship has played out consistently across multiple market cycles. During previous breakouts in 2013, 2017, and 2021, the Russell 2000’s move higher signaled a shift toward risk-on conditions—an environment that historically benefits Bitcoin.
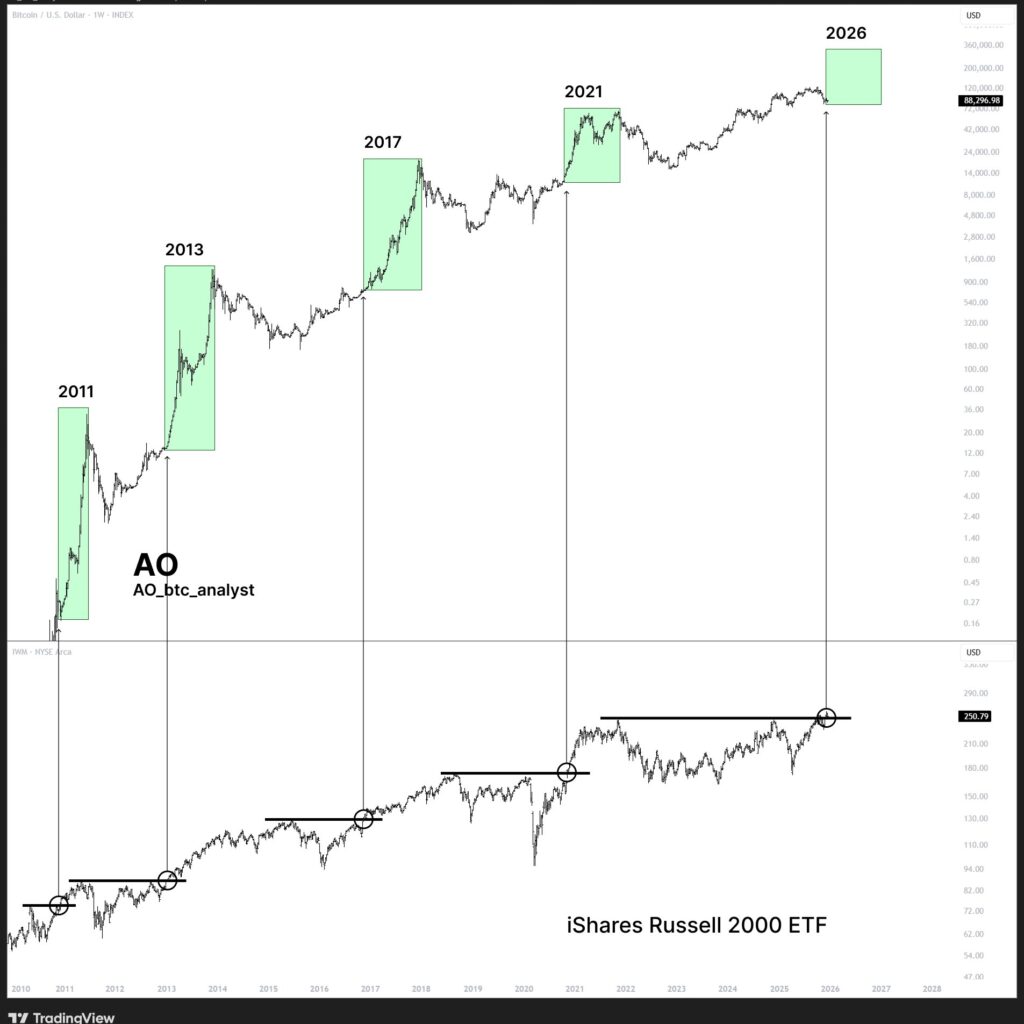
BTC and RUSSELL Fractal Chart/Credits: @AO_btc_analyst (X)
In each of those cycles, Bitcoin lagged initially before accelerating sharply once liquidity and investor confidence expanded.
Russell 2000 Breakout Strengthens the 2026 BTC Case
What makes the current setup especially notable is that the Russell 2000 has now decisively broken above its long-term horizontal resistance. This breakout confirms bullish momentum in small-cap equities and signals improving risk appetite across global markets.
Bitcoin’s current structure closely mirrors earlier cycle setups. Despite the recent correction, BTC continues to hold its broader range, suggesting the market may be building a base rather than transitioning into a prolonged bearish phase.
If this long-term pattern continues to hold, the Russell 2000 breakout could act as an early confirmation that Bitcoin is positioning for another expansion phase in 2026.
What’s Next for Bitcoin?
From a higher-timeframe perspective, Bitcoin’s outlook remains constructive as long as key support zones around the $80,000–$85,000 region remain intact. A sustained recovery and acceptance above major resistance levels would further validate the bullish thesis.
While historical patterns are never guarantees, the consistency of this signal across multiple market cycles makes it difficult to ignore. As 2026 approaches, the Russell 2000 breakout could emerge as one of the most important macro clues pointing toward renewed upside for Bitcoin, potentially setting the stage for a move toward significantly higher—though still debatable—price targets ahead.
Disclaimer: The views and analysis presented in this article are for informational purposes only and reflect the author’s perspective, not financial advice. Technical patterns and indicators discussed are subject to market volatility and may or may not yield the anticipated results. Investors are advised to exercise caution, conduct independent research, and make decisions aligned with their individual risk tolerance.
Disclaimer: The information on this page may come from third parties and does not represent the views or opinions of Gate. The content displayed on this page is for reference only and does not constitute any financial, investment, or legal advice. Gate does not guarantee the accuracy or completeness of the information and shall not be liable for any losses arising from the use of this information. Virtual asset investments carry high risks and are subject to significant price volatility. You may lose all of your invested principal. Please fully understand the relevant risks and make prudent decisions based on your own financial situation and risk tolerance. For details, please refer to
Disclaimer.
Related Articles
BTC 15-minute drop of 0.54%: Liquidity worsens and whales actively reduce positions, putting short-term pressure on the market
From 22:15 to 22:30 (UTC) on 2026-04-14, BTC saw a short-term pullback of 0.54% within the high-range band of 73911.6 - 74314.4 USDT, with a return of -0.54%. During this period, market swings were evident, volatility intensified, attention from the market quickly increased, and downward pressure on the order book was prominent.
The main drivers behind this unusual move were the continued deterioration of market liquidity and a clear lack of order book depth, which made the BTC price extremely sensitive to large sell orders. At the same time, during the key time window, whale wallets carried out large transfers and also engaged in active de-risking,
GateNews48m ago
Bitcoin Price Prediction: BTC CME Gap Near $69,500, Tron Expands USDT Utility, and APEMARS Stage ...
The crypto market is heating up again, are you ready for the next big move? With the latest Bitcoin price prediction signaling potential upside and major ecosystems like Tron expanding utility, investors are actively searching for the next breakout opportunity and the best crypto presale. Timing
BlockChainReporter57m ago
Goldman Sachs Files for Bitcoin Premium Income ETF with SEC
Goldman Sachs has applied to the SEC to launch a Bitcoin Premium Income ETF, marking its entry into the Bitcoin ETF market. This follows Morgan Stanley's recent launch of a similar product, highlighting growth in institutional Bitcoin yield-focused investments.
GateNews4h ago
BTC 跌破 74000 USDT
Gate News bot 消息,Gate 行情显示,BTC 跌破 74000 USDT,现价 73999.9 USDT。
CryptoRadar4h ago
BTC drops 0.75% in 15 minutes: quick pullback triggered by short-term position trimming and capital outflows
2026-04-14 16:45 to 17:00 (UTC), the BTC market saw a clear ups-and-downs move, with a 15-minute return of -0.75%. The price quickly dropped from the 74529.4 to 75233.4 USDT range, with an amplitude of 0.94%. During this period, trading volume increased by about 12% compared with the average of the prior hour; market attention rose, and volatility significantly intensified.
The main drivers of this sudden move were short-term holders collectively cutting positions and a large outflow of exchange funds. From 16:45 to 17:00, the net outflow of BTC was approximately 4,800 BTC
GateNews6h ago
