
The broader cryptocurrency market continues to struggle with uneven and choppy price action, a phase that began after the sharp sell-off on October 10. That correction dragged Ethereum (ETH) lower by nearly 25% over the past 60 days, keeping risk appetite muted across the altcoin space. Solana (SOL) has not been immune to this pressure, remaining under sustained selling as market participants stay cautious.
SOL is now down more than 37% over the same period. However, a closer look at the weekly chart suggests that the ongoing weakness may be part of a larger corrective structure rather than the start of a prolonged downtrend. Beneath the surface, the price action is beginning to form a technical setup that could lay the groundwork for a potential bullish reversal if key levels continue to hold.
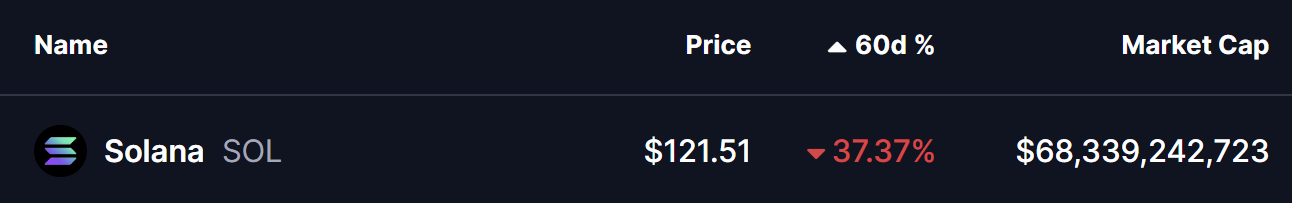
Source: Coinmarketcap
Bearish Butterfly Pattern Taking Shape
On the weekly timeframe, Solana appears to be developing a Bearish Gartley Butterfly pattern. Despite its name, this harmonic structure often signals exhaustion of the downtrend and sets the stage for an upside reversal once the pattern completes its final leg.
The structure began at Point X near the $295 region, followed by a sharp decline toward Point A. From there, SOL staged a rebound into Point B before rolling over once again. The current decline has pushed price into the $113–$122 zone, an area that aligns with the projected completion region of Point C within the pattern.
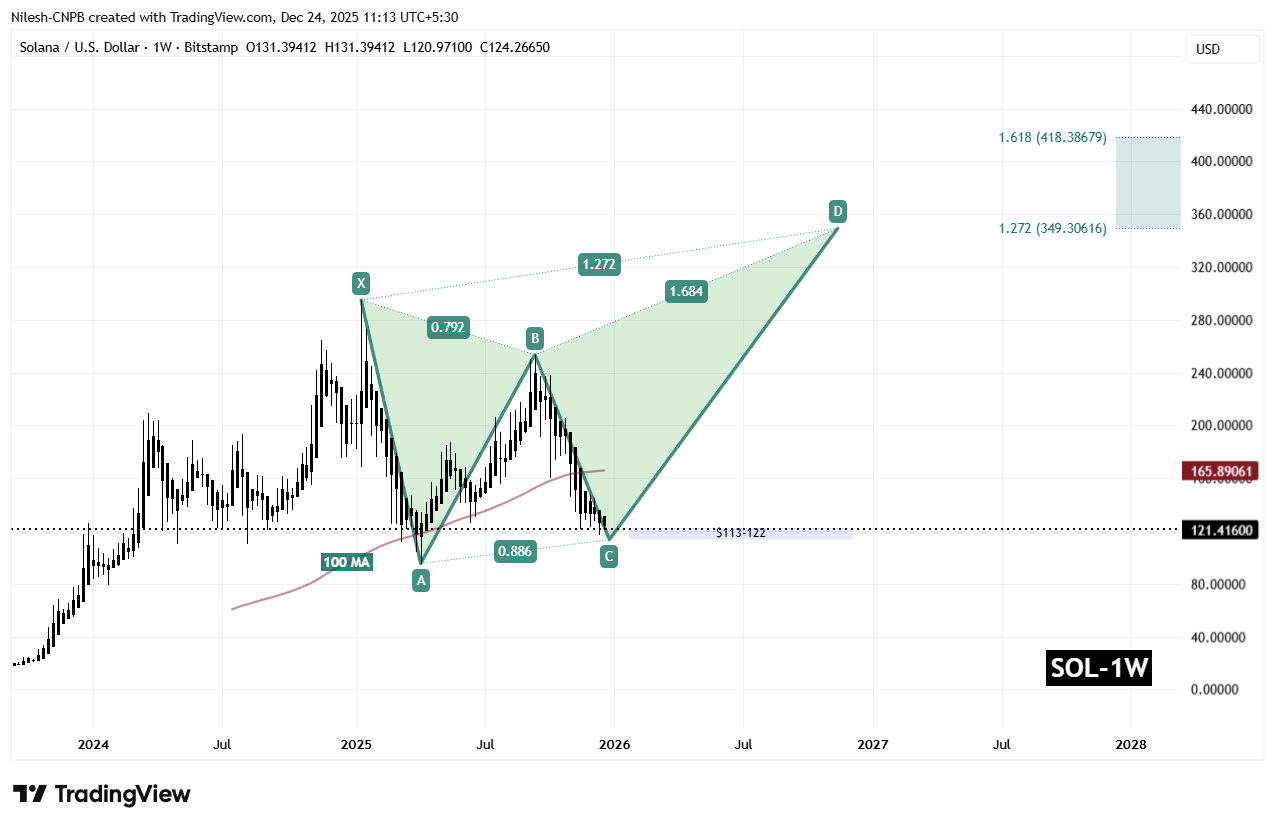
Solana (SOL) Weekly Chart/Coinsprobe (Source: Tradingview)
This zone is technically significant, as it represents a confluence of harmonic projections and historical demand. If buyers are able to defend this range, it would increase the probability that Point C is forming, opening the door for the bullish CD leg — the phase that typically drives recovery rallies in harmonic setups.
What’s Next for SOL?
If the $113–$122 support zone holds firm, Solana could begin to stabilize and attempt a reversal toward the 100-period moving average on the weekly chart, currently sitting near $165.89. A successful reclaim of this level would act as early confirmation that bullish momentum is returning.
Beyond that, the harmonic projection points to more ambitious upside targets. A sustained recovery could eventually drive SOL toward the $349.30 to $418.38 region, which aligns with the 1.272 and 1.618 Fibonacci extension levels of the pattern. From current prices, such a move would represent a potential upside of over 240%, assuming broader market conditions turn supportive.
That said, the setup remains conditional. A failure to hold the $113–$122 zone would weaken the bullish thesis, allowing sellers to regain control and potentially push SOL toward new local lows before any meaningful recovery attempt. For now, patience remains critical, and buyers may want to wait for clear confirmation before positioning for a reversal.
**Disclaimer: **The views and analysis presented in this article are for informational purposes only and reflect the author’s perspective, not financial advice. Technical patterns and indicators discussed are subject to market volatility and may or may not yield the anticipated results. Investors are advised to exercise caution, conduct independent research, and make decisions aligned with their individual risk tolerance.
Disclaimer: The information on this page may come from third parties and does not represent the views or opinions of Gate. The content displayed on this page is for reference only and does not constitute any financial, investment, or legal advice. Gate does not guarantee the accuracy or completeness of the information and shall not be liable for any losses arising from the use of this information. Virtual asset investments carry high risks and are subject to significant price volatility. You may lose all of your invested principal. Please fully understand the relevant risks and make prudent decisions based on your own financial situation and risk tolerance. For details, please refer to
Disclaimer.
Related Articles
Bitcoin ETF Sees $159.62M Single-Day Outflow While Ethereum and Solana ETFs Continue Negative Trend
Gate News message, according to April 9 data, Bitcoin ETFs recorded a single-day net outflow of 2,242 BTC (valued at $159.62M), while showing a 7-day net inflow of 2,723 BTC ($193.89M). Ethereum ETFs experienced a single-day net outflow of 23,158 ETH ($50.48M), with 7-day net outflows reaching 22,90
GateNews11m ago
DeFi Development discloses that it held 2.22 million SOL as of the end of March and more than 656k dfdvSOL.
Gate News, April 9, the Solana treasury company DeFi Development listed on Nasdaq released its March operating report. The report shows that as of the end of March, the company held 2.22 million SOL, and the amount of the liquid staking token dfdvSOL increased from 513k to more than 656k. In addition, DeFi Development said it will continue to advance its strategic investment in the stablecoin protocol Apyx.
GateNews2h ago
Solana Recovery Gains Pace While Derivatives Data Shows Split Sentiment
Key Insights
Solana records four consecutive days of gains as funding rates rise, signaling stronger retail interest while overall market conviction remains divided across participants.
Declining futures Open interest alongside rising funding rates highlights reduced trader exposure,
CryptoNewsLand5h ago
Yesterday, U.S. SOL spot ETFs saw net outflows of $1.9208 million, with GSOL and BSOL leading the declines
April 8, the U.S. SOL spot ETF saw a daily net outflow of $1.9208 million, including a $867.1k outflow from the Grayscale Solana Trust and a $779.6k outflow from the Bitwise Solana Staking ETF. Currently, the SOL spot ETF’s total net asset value is $794 million, and its historical cumulative net inflows total $963 million.
GateNews13h ago
Solana Tests Quantum-Resistant Signatures but Encounters a Sharp Speed Penalty
Solana is collaborating with Project Eleven to develop quantum-resistant signatures, facing challenges with larger signature sizes and a 90% reduction in network speed. This raises concerns about balancing future security with current performance and scalability.
CryptoNewsFlash20h ago
$285M Solana Disaster – Here’s What Actually Happened
On April 1, 2026, things fell apart on Solana (SOL). Drift Protocol got hit with a $285 million exploit, and within hours, its token crashed hard. The impact didn’t stop there, it quickly spread to other connected protocols.
This breakdown is based on reporting and analysis from Coin Bureau wi
CaptainAltcoin04-08 14:15
