
The broader crypto market has remained choppy and directionless over the past several weeks, a phase that began after the sharp sell-off on October 10. That correction dragged Ethereum (ETH) down from the sub-$4,700 region into the $2,900 area, keeping traders cautious and risk appetite muted across the market. Over the past 60 days alone, ETH has declined by more than 26%, reinforcing a short-term bearish bias and weighing heavily on sentiment.
However, while price action continues to struggle, underlying data and a familiar historical pattern suggest that Ethereum may be approaching a critical inflection point.

Source: Coinmarketcap
Ethereum (ETH) Network Activity Surges
Despite the ongoing price weakness, on-chain activity is telling a different story. According to crypto analyst Ali, Ethereum’s network activity has surged sharply, with active addresses nearly doubling in just one week — rising from around 496,000 to nearly 800,000.
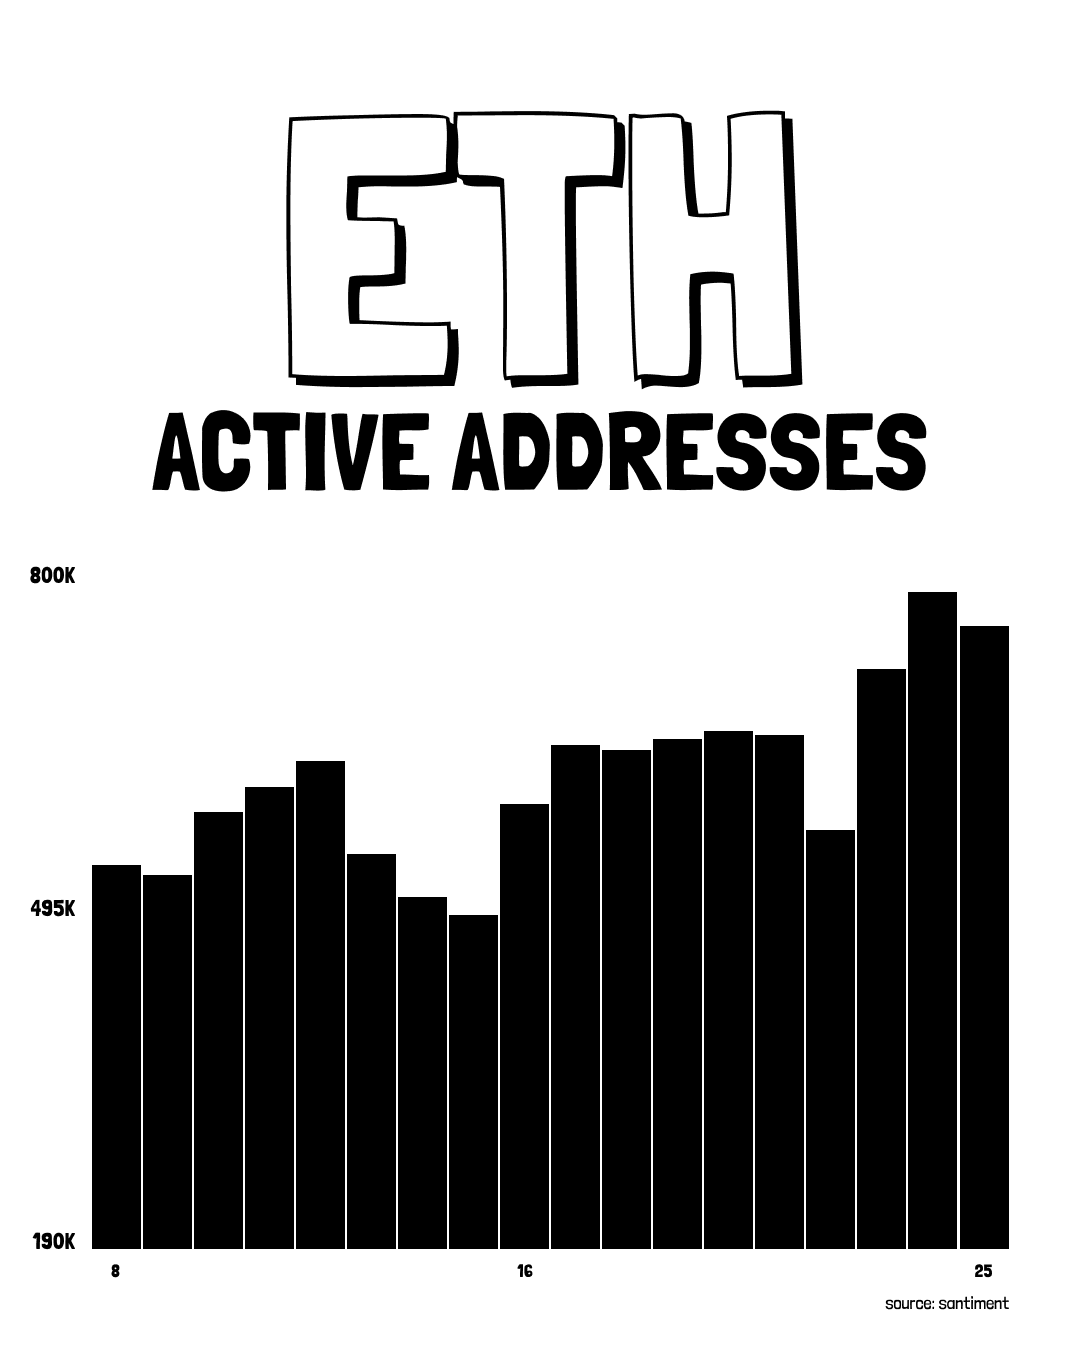
ETH Active Addresses/Source: @alicharts (X)
This spike in activity suggests renewed engagement across the network, often seen during periods of accumulation or early positioning before a meaningful directional move. Historically, sustained increases in active addresses have tended to precede volatility expansions rather than occur during market tops, adding an interesting layer of context to ETH’s current consolidation.
Could This Fractal Setup Signal a Rebound?
On the daily chart shared by crypto analyst CryptoBullet, Ethereum’s current structure closely mirrors the corrective phase seen during 2022. In both instances, ETH rallied strongly into a major cycle high, lost the 200-day moving average, and then entered a prolonged pullback marked by lower highs while respecting a rising support trendline.
In the 2022 fractal, ETH attempted multiple recoveries toward the 200-day MA, only to face rejection before one final leg lower flushed out sellers. That move ultimately marked a local bottom and paved the way for a meaningful rebound.
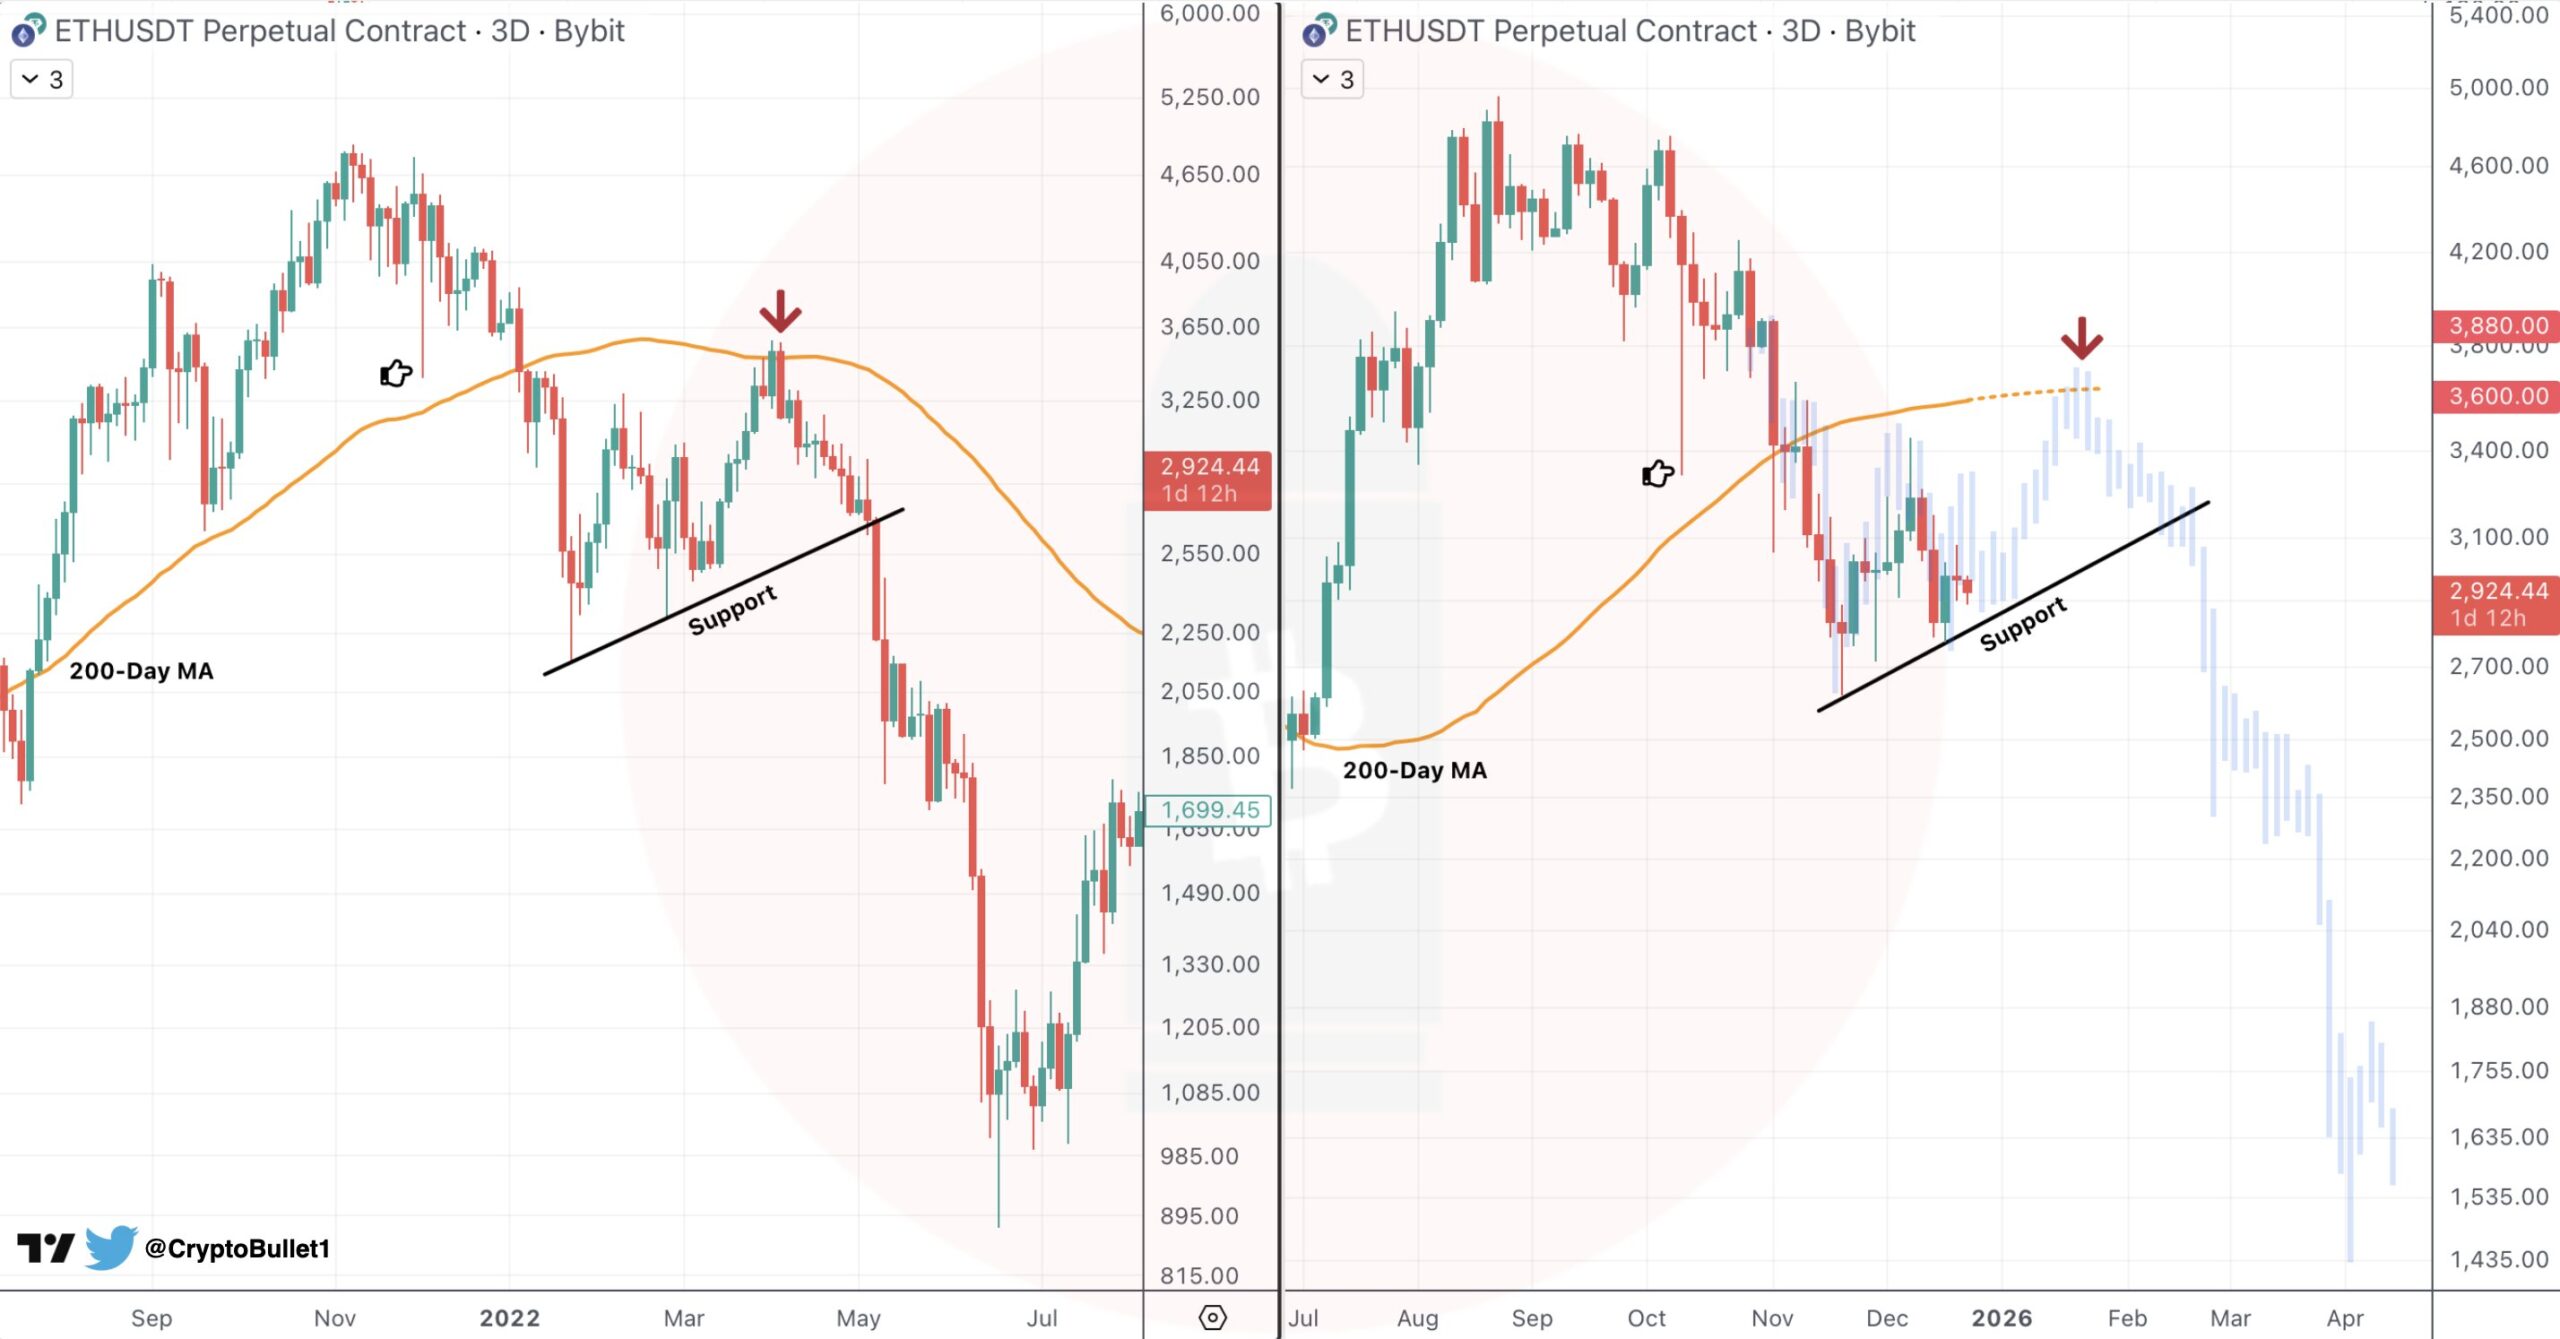
ETH Fractal Chart/Credits: @CryptoBullet1 (X)
At present, ETH appears to be following a similar roadmap. Price is consolidating just above a rising support zone while the 200-day MA continues to cap upside attempts. This confluence makes the coming weeks particularly important, as the market decides whether this fractal plays out fully or breaks away from the historical script.
Bearish Invalidation: Support Breakdown Risk
If Ethereum fails to hold the rising support structure highlighted on the chart, bearish pressure could accelerate. A confirmed breakdown below this support would likely open the door for a deeper move toward the $2,200–$2,400 region, an area that aligns with prior demand zones and historical reaction levels.
In this scenario, a sharper downside move could still act as a reset before a larger recovery, similar to what unfolded during previous corrective cycles.
Bullish Invalidation: Reclaiming the 200-Day MA
On the flip side, the bullish case hinges on ETH reclaiming the 200-day moving average. A decisive break and sustained close above this level would invalidate the bearish fractal comparison and signal a potential trend shift back in favor of buyers.
Such a move would likely coincide with improving sentiment, stronger spot demand, and confirmation that the recent drawdown was a corrective phase rather than the start of a broader downtrend.
Final Thoughts
While short-term price action remains under pressure, the combination of rising network activity and a historically significant fractal structure suggests Ethereum may be approaching a pivotal moment. Whether ETH follows the 2022 roadmap or breaks higher ahead of expectations will depend on how price reacts around key support and the 200-day moving average in the days ahead.
For now, ETH sits at a technical crossroads — and the next decisive move could set the tone for the remainder of the cycle.
Disclaimer: The views and analysis presented in this article are for informational purposes only and reflect the author’s perspective, not financial advice. Technical patterns and indicators discussed are subject to market volatility and may or may not yield the anticipated results. Investors are advised to exercise caution, conduct independent research, and make decisions aligned with their individual risk tolerance.
Disclaimer: The information on this page may come from third parties and does not represent the views or opinions of Gate. The content displayed on this page is for reference only and does not constitute any financial, investment, or legal advice. Gate does not guarantee the accuracy or completeness of the information and shall not be liable for any losses arising from the use of this information. Virtual asset investments carry high risks and are subject to significant price volatility. You may lose all of your invested principal. Please fully understand the relevant risks and make prudent decisions based on your own financial situation and risk tolerance. For details, please refer to
Disclaimer.
Related Articles
Fed Chair Nominee Kevin Warsh Discloses Crypto Investments Including Compound, Solana, and Ethereum L2s
Kevin Warsh, nominee for Federal Reserve Chair, has disclosed early-stage investments in various crypto infrastructure projects, including DeFi and layer-2 networks. His portfolio, small and illiquid, suggests indirect venture capital exposure rather than direct trading assets.
GateNews13m ago
ETH 跌破 2350 USDT
Gate News bot 消息,Gate 行情显示,ETH 跌破 2350 USDT,现价 2349.98 USDT。
CryptoRadar15m ago
Whale "pension-usdt.eth" Faces $11.7M Loss on BTC and ETH Short Positions
Gate News message, as the market rises, whale "pension-usdt.eth" is now sitting on a floating loss of over $11.7M on its $BTC and $ETH 3x short positions.
GateNews22m ago
ETH 15-minute pullback of 0.87%: After a big jump the day before, technical profit-taking triggered a high-level retreat
2026-04-14 14:30 to 14:45 (UTC), ETH’s return over 15 minutes was -0.87%. The range quotes fell from 2415.04 USDT to 2366.89 USDT, reaching a swing of 2.01%. During this time period, market attention increased, short-term volatility clearly intensified, and investors showed some caution about the subsequent direction.
The main driving force behind this abnormal move is that after ETH surged 8.1% on the previous trading day, technical indicators continued to show overbought conditions, leading short-term longs to take profits and sell into strength. The pullback pressure amid high-level consolidation is in the funds
GateNews28m ago
ETH breaks through 2400 USDT
Gate News bot message, Gate price action shows that ETH has broken through 2400 USDT, current price is 2404.84 USDT.
CryptoRadar45m ago
