Date: Mon, Dec 22, 2025 | 12:45 PM GMT
The broader cryptocurrency market is showing relative strength at the start of the week, with both Bitcoin (BTC) and Ethereum (ETH) trading in the green. This stability in the majors has helped lift sentiment across the altcoin space, and** Bittensor (TAO)** is beginning to show early signs of a potential shift in momentum.
TAO is posting modest gains, but more importantly, its recent price action is starting to outline a clear technical structure on the daily chart. While the trend has been bearish for several weeks, the current setup hints that TAO could be positioning for another upside attempt if key levels are reclaimed.
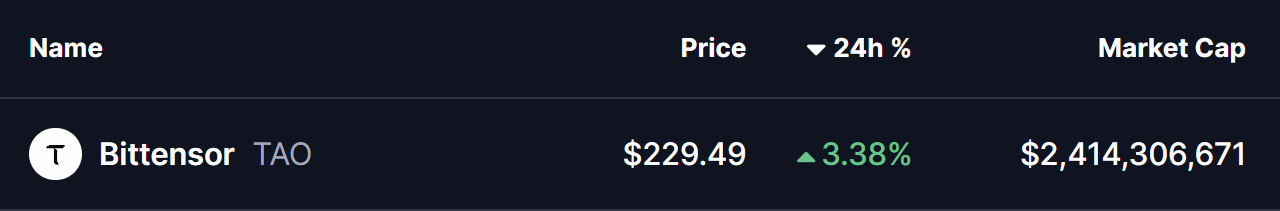
Source: Coinmarketcap
Power of 3 Pattern in Focus
On the higher-timeframe chart, TAO appears to be forming a classic Power of 3 structure, a pattern often associated with market cycle lows and early trend transitions. This structure typically unfolds in three stages: accumulation, manipulation, and expansion, with the strongest directional move usually emerging once the final phase begins.
Earlier, TAO spent a prolonged period moving sideways within a clearly defined range between $314.97 and $260.39. This low-volatility phase, highlighted by the grey box on the chart, reflects the accumulation stage, where price remained compressed and market participation gradually shifted from weak hands to stronger holders.
That period of balance eventually broke down as broader market pressure intensified. TAO lost the $260.39 support level and accelerated lower, sliding toward a recent low near $215.22. This sharp and impulsive move fits well with the manipulation phase of the Power of 3 pattern, where price briefly moves against the broader expectation to flush out late buyers and trigger stop losses.
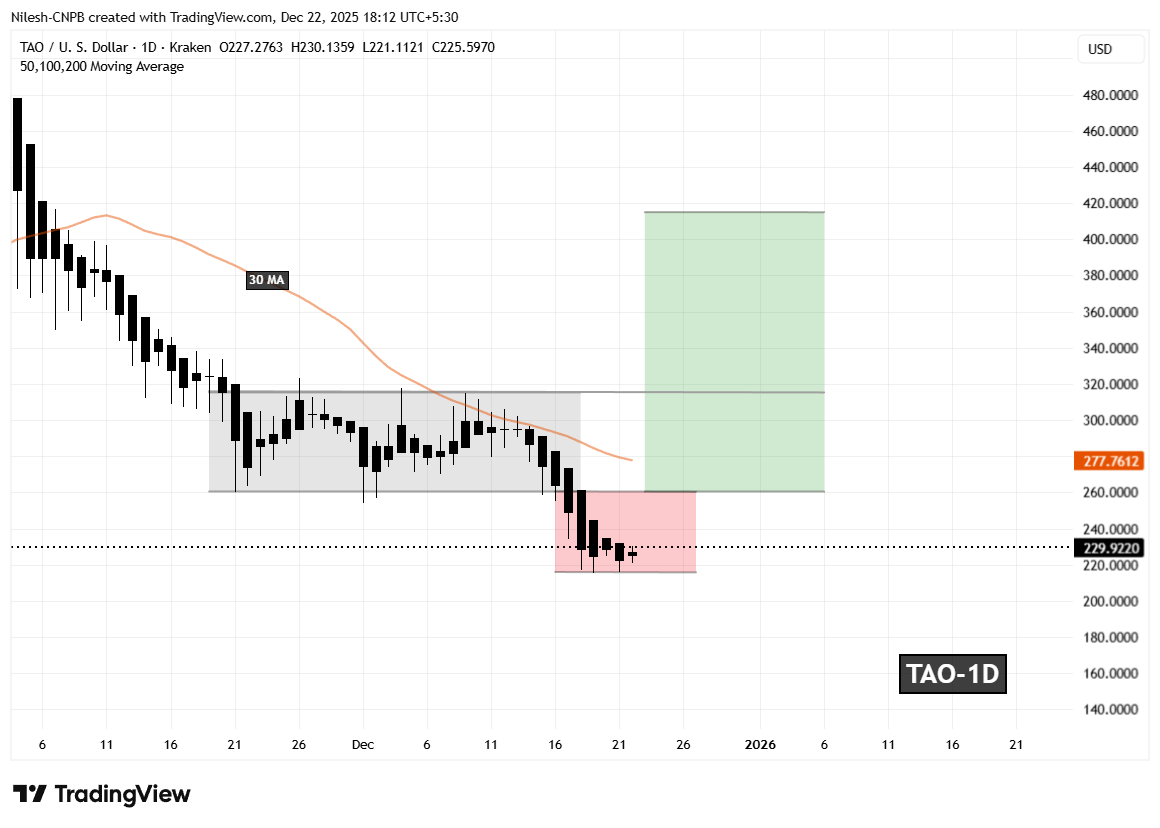
Bittensor (TAO) Daily Chart/Coinsprobe (Source: Tradingview)
Importantly, selling momentum has started to cool near this lower zone. The most recent daily candles show smaller bodies and reduced downside follow-through, suggesting that bearish pressure may be weakening. TAO is now consolidating near the lows, which often signals that the market is attempting to stabilize after an aggressive sell-off.
What’s Next for TAO?
At the time of writing, TAO continues to trade within the broader manipulation zone, which calls for caution. The trend has not yet confirmed a reversal, but the structure is beginning to develop conditions that could support one.
For the bullish scenario to gain traction, TAO needs to reclaim the $260.39 level and establish acceptance above the declining 30-day moving average, which is currently acting as dynamic resistance. A sustained move back into the previous range would suggest that the manipulation phase is likely complete and that the market may be transitioning toward the expansion phase of the pattern.
If buyers manage to push price above $314.97 and hold that level as support, the chart projection opens the door for a move toward the $414.65 region. This area represents the measured expansion target from the prior range and implies a potential upside of roughly 80% from current levels if momentum accelerates.
That said, this setup remains highly conditional. As long as TAO trades below $260.39, downside risks cannot be ruled out, and the market remains vulnerable to further volatility. Holding recent lows and reclaiming key resistance zones will be critical for bulls looking to validate a bullish reversal narrative in the days ahead.
Disclaimer: The views and analysis presented in this article are for informational purposes only and reflect the author’s perspective, not financial advice. Technical patterns and indicators discussed are subject to market volatility and may or may not yield the anticipated results. Investors are advised to exercise caution, conduct independent research, and make decisions aligned with their individual risk tolerance.
Disclaimer: The information on this page may come from third parties and does not represent the views or opinions of Gate. The content displayed on this page is for reference only and does not constitute any financial, investment, or legal advice. Gate does not guarantee the accuracy or completeness of the information and shall not be liable for any losses arising from the use of this information. Virtual asset investments carry high risks and are subject to significant price volatility. You may lose all of your invested principal. Please fully understand the relevant risks and make prudent decisions based on your own financial situation and risk tolerance. For details, please refer to
Disclaimer.
Related Articles
Solana Recovery Gains Pace While Derivatives Data Shows Split Sentiment
Key Insights
Solana records four consecutive days of gains as funding rates rise, signaling stronger retail interest while overall market conviction remains divided across participants.
Declining futures Open interest alongside rising funding rates highlights reduced trader exposure,
CryptoNewsLand38m ago
Solana Eyes $90 as Volume Surge Fuels Short-Term Rally
Key Insights:
The Solana price rebounded from recent lows near $80 as trading volume surged sharply, signaling renewed participation and stronger short-term market momentum.
A golden cross on lower time frames reinforced bullish sentiment, with technical indicators suggesting continued
CryptoNewsLand48m ago
ETH 15-minute drop of 0.69%: Price pressure from declining burn volume and short-term capital arbitrage
2026-04-09 18:00 to 2026-04-09 18:15 (UTC), ETH closed down 0.69% within a 0.88% intraday trading range, with the price fluctuating between 2203.91 and 2223.58 USDT. Trading volume in this range rose slightly, market attention stayed high, but short-term volatility increased, prompting investor caution.
The main drivers behind this unusual move are that ETH on-chain Gas fees have fallen to historical lows, causing the EIP-1559 burn amount to decline. As a result, the net-supply contraction effect weakened, and the supply-demand structure faced adjustment pressure in the short term. Meanwhile,
GateNews1h ago
BTC drops 0.62% over 15 minutes: exchange net inflows intensify and short-term arbitrage converges to trigger volatility
From 18:00 to 18:15 on April 9, 2026 (UTC), the BTC price return recorded -0.62%, closing in the range of 71857.8 to 72375.1 USDT, with a trading range of 0.72%. Market attention was notably elevated, volatility intensified, and capital moved quickly within a short period. Overall market sentiment has become more cautious, and investors’ willingness to trade in the short term has increased.
The main driving force behind this abnormal move is an increase in net inflows to BTC exchanges during the anomaly window; the 10-minute net flow reached 755.92 BTC, indicating that some investors chose to transfer funds to exchanges to seek arbitrage opportunities in the midst of the volatility issue
GateNews1h ago
PEPE Price Holds Support as Bearish Bets Build Pressure
Key Insights:
PEPE price stabilizes near strong support despite sustained negative funding rates, highlighting a clear divergence between trader sentiment and actual market behavior.
Declining open interest and reduced liquidation activity indicate leverage reset, suggesting the market has c
CryptoNewsLand1h ago
Zcash Price Rally Gains Pace as Shielded Pools Hit Record
Key Insights:
Zcash surged 25% daily and over 60% monthly as strong demand for privacy features drove increased investor participation across the network.
Shielded pool holdings reached $5.18 billion, showing over 31% of supply now locked in private transactions, signaling stronger user
CryptoNewsLand1h ago
