Date: Wed, Dec 17, 2025 | 03:00 PM GMT
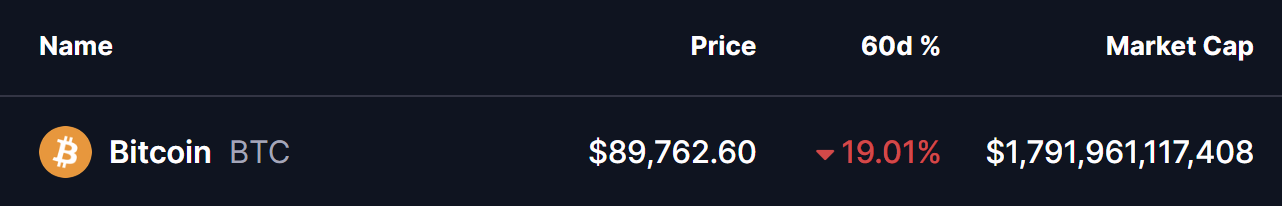
The broader cryptocurrency market has been experiencing choppy price action over the past several weeks, a phase that began after the sharp sell-off on October 10. That correction dragged Bitcoin (BTC) from sub-$120,000 levels down toward the current $88,000 zone. Over the last 60 days alone, BTC has declined by 19%, keeping overall market sentiment cautious and risk appetite subdued.
Despite the weakness, the higher-timeframe chart is beginning to reveal a familiar technical structure. Price behavior now suggests that downside momentum may be fading, raising the possibility that Bitcoin could be preparing for a trend reversal rather than a continuation of the recent decline.
Fractal Setup Hints at a Potential Bottom
According to crypto analyst JAVON, BTC’s current price structure is closely resembling a repeating fractal that has appeared multiple times throughout the ongoing macro uptrend. Historically, Bitcoin has followed a consistent rhythm: a sharp impulsive rally, followed by a corrective phase marked by consolidation and lower highs, before resuming its broader upward trajectory.
Looking at the chart, BTC has repeatedly formed local distribution patterns near highs, followed by controlled pullbacks into strong support zones. Each of these pullbacks eventually transitioned into consolidation ranges, where selling pressure gradually weakened before buyers stepped back in aggressively. These phases ultimately served as accumulation zones rather than trend reversals.
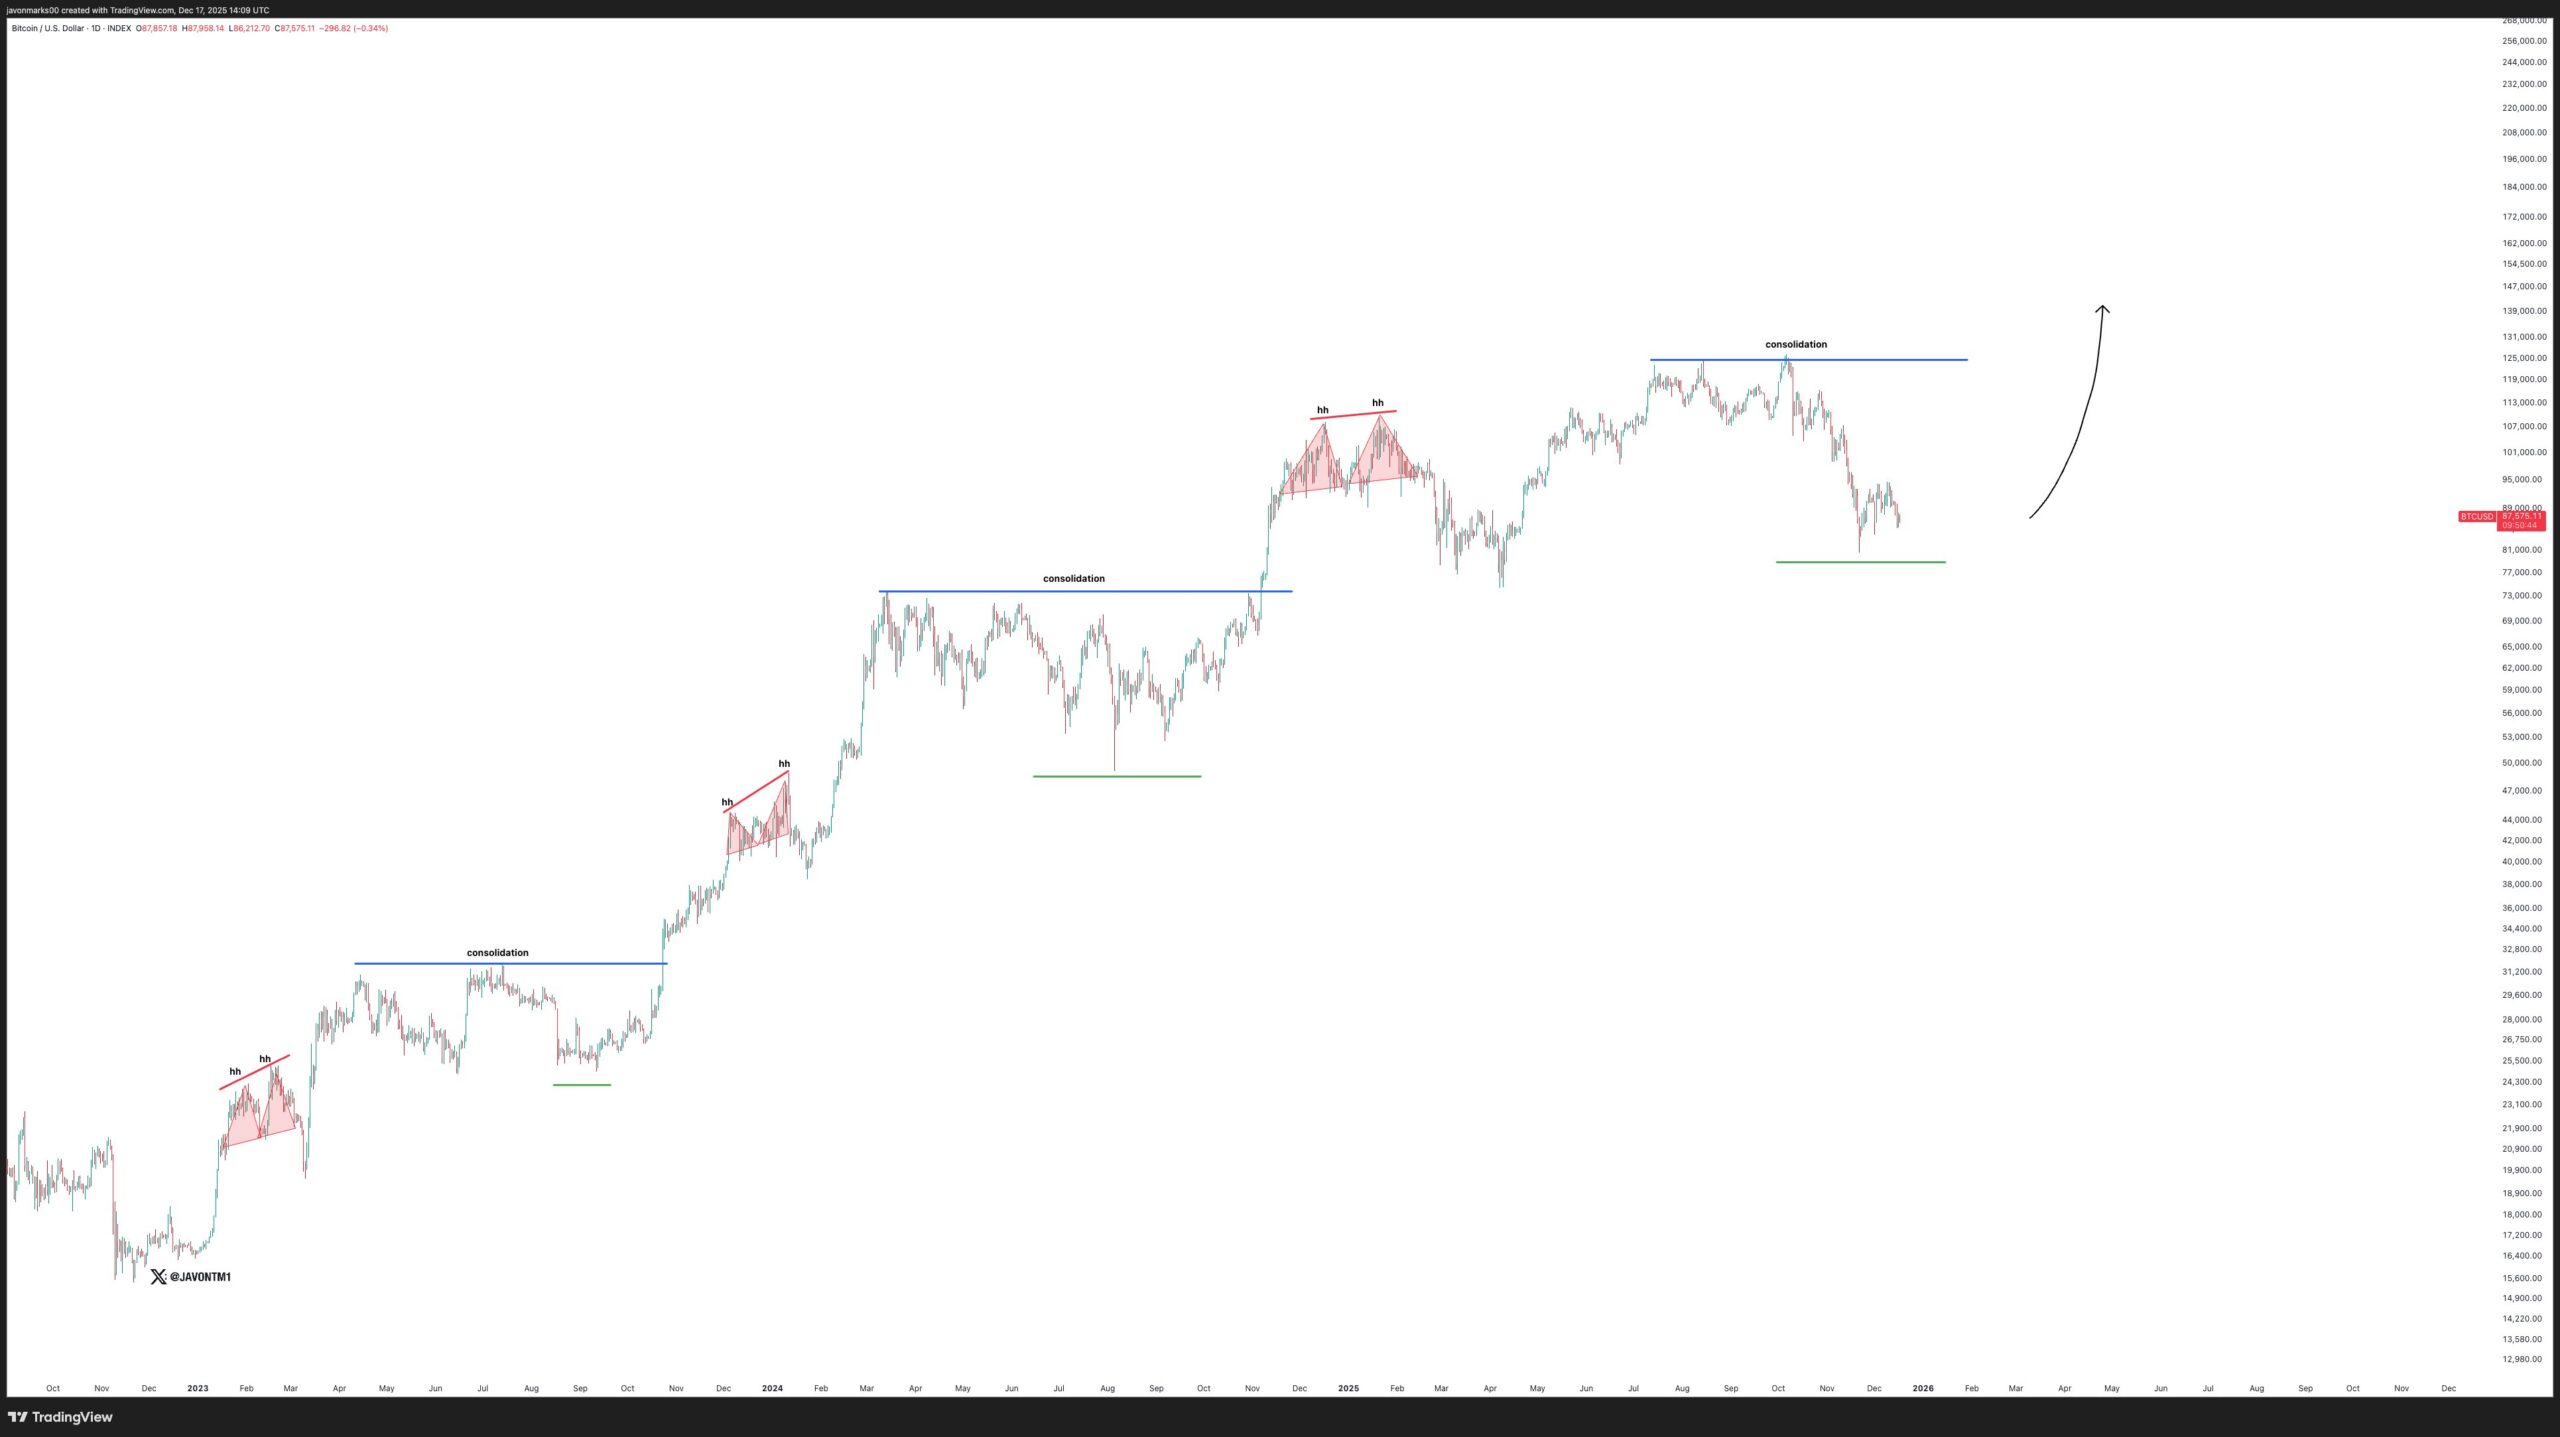
Bitcoin (BTC) Fractal Chart/Credits: @JavonTM1 (X)
At present, Bitcoin appears to be replaying the same script. After topping out near the $126,000 region, BTC entered a corrective decline that has now brought price back into a historically significant demand area around the $80,000–$88,000 range. This zone aligns closely with prior consolidation bases seen earlier in the cycle, where price previously paused before launching into its next leg higher.
Notably, the current pullback remains structurally healthy when viewed in the context of the broader trend. Higher-timeframe support is still intact, and the decline so far resembles past corrective phases rather than panic-driven breakdowns. This fractal similarity suggests that Bitcoin may be carving out a local bottom, rather than entering a prolonged bearish phase.
What’s Next for BTC?
If this fractal continues to play out as it has in previous cycles, Bitcoin could spend additional time consolidating above the current support zone before attempting a trend resumption. A period of sideways price action would allow market conditions to stabilize, flush out remaining weak hands, and rebuild bullish momentum.
A confirmed recovery above the recent consolidation resistance would strengthen the case for a renewed upside move, potentially opening the door for BTC to revisit and eventually exceed its prior highs. On the other hand, a sustained breakdown below the current support region would weaken the fractal thesis and signal that a deeper corrective phase may still be unfolding.
For now, Bitcoin’s structure remains constructive despite recent volatility. As long as BTC continues to hold above key higher-timeframe support levels, the probability of a cyclical bottom forming remains elevated. Traders and investors will be watching closely to see whether this familiar fractal once again leads to the next major expansion phase.
Disclaimer: The views and analysis presented in this article are for informational purposes only and reflect the author’s perspective, not financial advice. Technical patterns and indicators discussed are subject to market volatility and may or may not yield the anticipated results. Investors are advised to exercise caution, conduct independent research, and make decisions aligned with their individual risk tolerance.
Disclaimer: The information on this page may come from third parties and does not represent the views or opinions of Gate. The content displayed on this page is for reference only and does not constitute any financial, investment, or legal advice. Gate does not guarantee the accuracy or completeness of the information and shall not be liable for any losses arising from the use of this information. Virtual asset investments carry high risks and are subject to significant price volatility. You may lose all of your invested principal. Please fully understand the relevant risks and make prudent decisions based on your own financial situation and risk tolerance. For details, please refer to
Disclaimer.
Related Articles
Basel rule changes could unlock huge Bitcoin liquidity: Analyst
The Basel III framework governing bank capital requirements is set for an update in 2026, with potential implications for the crypto ecosystem. The outcome could hinge on how the largest digital asset is treated in risk-weight calculations, and analysts warn
CryptoBreaking4m ago
BTC 15-minute decline of 0.70%: Whale selling drives short-term pullback
2026-03-15 23:15 to 2026-03-15 23:30 (UTC), BTC price declined 0.70% in just 15 minutes, with a price range of 72464.7 to 73115.9 USDT and an intraday volatility of 0.89%. The anomaly occurred during the night when liquidity was lower, with concentrated short-term selling pressure triggering market attention, and price fluctuations notably intensified compared to daytime levels.
The primary driver of this anomaly was on-chain monitoring detecting multiple large BTC transfers flowing into exchanges, indicating that whales or institutions were conducting active selling operations, with selling pressure in liquidity
GateNews8m ago
BTC breaks through $73,000, intraday gain of 2.21%
Gate News reported that on March 15, BTC price broke through $73,000, with a daily gain of 2.21%.
GateNews45m ago
BTC Breaks Through 73,000 USDT
Gate News bot message: Gate market display shows BTC breaking through 73000 USDT, current price 73049.4 USDT.
CryptoRadar47m ago
BTC 15-minute gain of 0.63%: ETF positive news combined with institutional fund inflows triggers breakthrough
From 2026-03-15 22:30 to 2026-03-15 22:45 (UTC), BTC rose 0.63% within 15 minutes, with a price range of 71926.4 to 72500.0 USDT and a volatility amplitude of 0.80%. During the same period, trading volume increased notably with buy-side dominance, market attention heated up, and fluctuation intensity exceeded the intraday average, reflecting rising sentiment and active short-term trading activity.
The main driver of this price movement is a macro positive catalyst: The US SEC released a positive statement regarding bitcoin ETF approval progress at 22:00, which directly bolstered
GateNews53m ago
AI Just Delivered the Hardest Blow to Bitcoin Yet
For fifteen years, Bitcoin was the sole top-performing asset class on the planet. It survived regulators, exchange outages, and the never-ending predictions of its death. But now, the threat is no longer regulators or bankers. The threat is now artificial intelligence, and the problem is
CaptainAltcoin1h ago