-
ENA trades near a historically reactive $0.20 zone that previously preceded a multi-month upside expansion.
-
Volume-weighted funding remains negative, reflecting sustained short exposure without panic-driven liquidation behavior.
-
Price structure signals controlled distribution, with downside risk defined and rebounds treated as corrective.
ENA trades near a historically significant demand area as recent price action remains under pressure. Market structure shows controlled selling, muted volatility, and cautious positioning across spot and derivatives venues.
Long-Term Chart Structure Focuses on a Key Demand Zone
ENA three-day chart places emphasis on repeated interactions with the same horizontal support area. Ali Charts observed that prior visits to this zone preceded sharp upside expansions after extended consolidation. Each historical test showed price compression before reversing, signaling longer-term capital participation. This recurring behavior increases the technical relevance of the level across multiple market cycles.
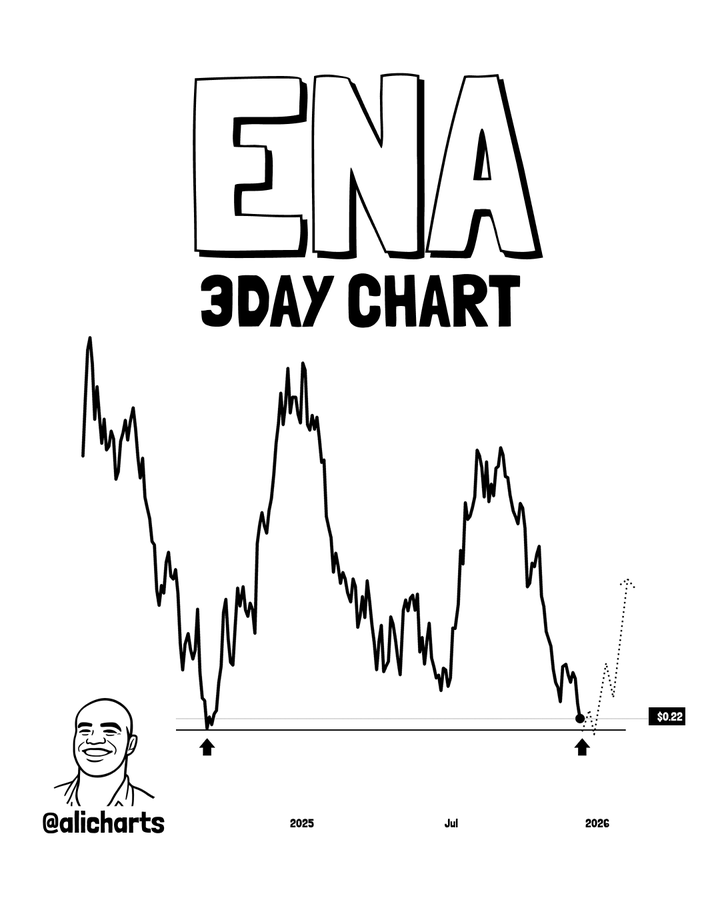
Source: X
The previous rally from this region delivered a 540% advance after sellers gradually exhausted. That move followed basing action rather than momentum-driven expansion.
This context frames the current setup as location-based instead of timing-dependent.
Structural symmetry suggests mean reversion remains active despite the corrective backdrop.
Recent price behavior shows progressively lower highs forming into the support test.
This reflects a corrective phase rather than confirmation of a structural breakdown.
Earlier cycles displayed similar retracements before volatility expanded higher.
Sustained acceptance above support would carry greater weight on higher timeframes.
Intraday Price Action Reflects Controlled Distribution
ENA lower-timeframe structure shows repeated failures near the $0.223–$0.225 resistance zone. Each advance met immediate supply, establishing a clear intraday lower-high sequence. Once price slipped below the $0.217 area, bearish control became evident. From there, price formed consistent lower lows without meaningful demand reactions.
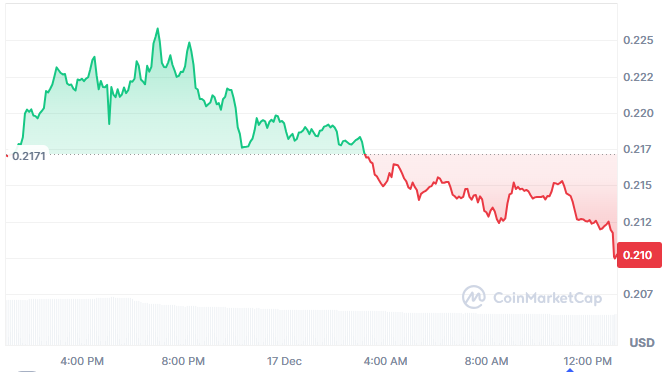
Source: coinmarketcap
Volatility remained contained, with shallow wicks and orderly candles throughout the decline.
This behavior aligns with distribution by stronger hands rather than emotional capitulation.
Such conditions often allow trends to persist as bids withdraw incrementally.
The absence of sharp liquidation events reinforces the controlled nature of selling.
The $0.210–$0.212 area now serves as the final visible shelf before deeper downside.
Acceptance below that region would likely expose liquidity near the $0.20 psychological level. For recovery attempts, reclaiming $0.217 on a closing basis remains essential.
Without that reclaim, rebounds continue to classify as corrective movements.
Funding Rates Confirm Persistent Bearish Positioning
ENA’s derivatives data reinforces the prevailing bearish market posture.
Volume-weighted funding has stayed predominantly negative since mid-September.
Repeated negative spikes show shorts paying premiums to maintain exposure.
This behavior reflects sustained bearish leverage rather than short-lived sentiment shifts.
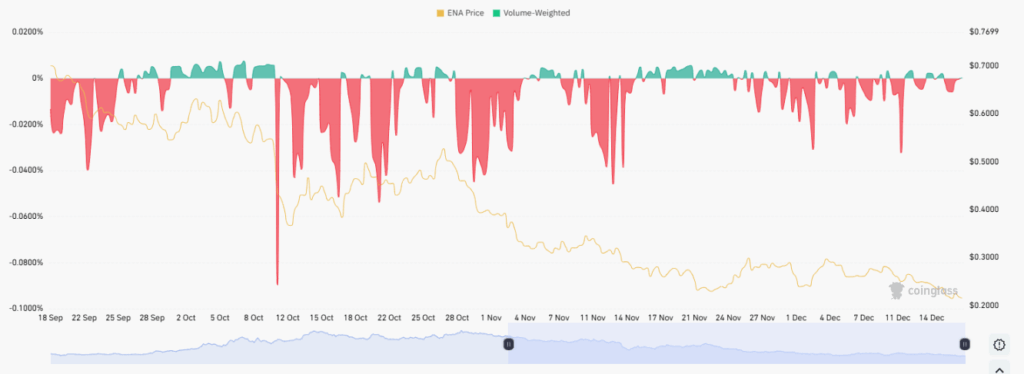
Source: Conglass
During brief rebounds in October and November, funding only flattened temporarily. Positive readings failed to persist before reverting negative. Rallies were treated as opportunities to re-establish short exposure. Despite crowding, the market did not produce a sustained short squeeze.
More recently, funding readings have compressed closer to neutral levels. This suggests downside momentum may be losing efficiency without confirming reversal signals. Such compression often precedes volatility expansion or positioning adjustments. Until funding turns positive and holds, upside moves remain structurally corrective.
Disclaimer: The information on this page may come from third parties and does not represent the views or opinions of Gate. The content displayed on this page is for reference only and does not constitute any financial, investment, or legal advice. Gate does not guarantee the accuracy or completeness of the information and shall not be liable for any losses arising from the use of this information. Virtual asset investments carry high risks and are subject to significant price volatility. You may lose all of your invested principal. Please fully understand the relevant risks and make prudent decisions based on your own financial situation and risk tolerance. For details, please refer to
Disclaimer.
Related Articles
Why Is Bitcoin Up Today? Hormuz Blockade Triggers Short Squeeze and a BTC Test of $75k
On April 13, Bitcoin rose from its early-session low of 70,741 to trade as high as $74,900 during the session, approaching the $75,000 level. The main drivers came from two directions: after Trump ordered the blockade of the Strait of Hormuz, traders began to view Bitcoin as a geopolitical hedge asset; and a massive net short position that had been building as funding rates stayed persistently negative was met with liquidation, triggering a chain of liquidations totaling millions of dollars near the $70,000 support level.
MarketWhisper1h ago
Bitmine gets promoted to the NYSE main board! Tom Lee: U.S. stocks may have bottomed out, and Ether’s selling pressure may ease
Bitmine has officially moved from the NYSE American board to the main board in the United States, marking an important milestone for the company. Despite a sharp drop in its stock price, it has still increased its share repurchase authorization to $4.0 billion. The company holds a large amount of Ether, and it predicts that a rebound in the crypto market will help boost its assets and stock price performance.
CryptoCity3h ago
U.S. stocks have recovered the losses since the Iran war, while Bitcoin pushes up to 74K
Due to market expectations that the United States and Iran will reach an agreement, the S&P 500 index has rebounded to its highest level since the war, and Bitcoin has also surged to $74,900. Despite the failure of peace talks between the U.S. and Iran, the U.S. has imposed a maritime blockade to pressure Iran. MicroStrategy once again made a large-scale purchase of Bitcoin, indicating that investor confidence is picking up.
ChainNewsAbmedia3h ago
BTC 15-minute surge up 0.77%: Spot buy-side demand and on-chain activity convergence drive short-term strength
2026-04-13 22:00 to 2026-04-13 22:15 (UTC), the BTC price fluctuated upward within 15 minutes, with a return of +0.77%. The high and low prices in the range were between 73178.0 and 73899.0 USDT, and the amplitude was 0.99%. During the event, market attention increased, volatility slightly intensified, and overall sentiment leaned positive.
The main driver behind this price deviation was active spot market buy orders stepping in, which pushed the BTC price higher in the short term. The number of active addresses on-chain remained at a high level, reflecting an increase in genuine trading demand. Trading volume was higher than in the previous period,
GateNews4h ago
