Bitcoin market capitalization has surpassed $2.1 trillion. Behind every dramatic fluctuation in 2025 are subtle shifts in collateral, basis, and ETF capital flows. The impact of financing rates, margin discounts, and spot ETF hedging on Bitcoin prices is now as significant as any macroeconomic news. The market reshuffle in October highlighted this correlation, with approximately $19 billion in positions liquidated between October 10 and 11.
Factor 1: ETF Capital Flows Become a Price-Driving Force
Bitcoin’s volatility in 2025 increasingly depends on ETF and ETP capital flows. October saw intense swings in ETF capital movement, shifting from record inflows to outflows and back again, which in turn affected spot inventory and hedging flows among traders. CoinShares reported that during the week ending October 4, $5.95 billion flowed in; then in the week ending October 20, $513 million flowed out; and in the week ending October 27, $921 million flowed in, all within days, altering traders’ hedging requirements and spot prices.
However, this October trend reversed again. By early November, digital asset funds experienced net outflows, with Bitcoin ETFs losing nearly $1 billion, underscoring how quickly ETF hedging flows can change. When capital flows are positive and the basis is large, arbitrage traders compete with ETF issuers for token sources, reducing exchange balances. When flows turn negative or reverse, closing positions increases reserves and pushes Bitcoin prices toward liquidation clusters.
Trading activity in ETPs and ETFs is a key factor in determining Bitcoin’s trajectory in 2025. When flows are positive and the basis is large, arbitrageurs compete with ETF issuers for tokens, decreasing exchange balances. When flows reverse, closing trades increases reserves and pushes prices toward liquidation zones. This mechanism was especially evident in October, where a change in flow direction completely reversed market structure within days.
For Bitcoin investors, tracking ETF capital flows has become a more important leading indicator than technical analysis. When weekly inflows exceed $3 billion, it often signals Bitcoin prices will rise in the following days. Conversely, two consecutive weeks of outflows over $1 billion typically mark a short-term top. Whether Bitcoin can break higher in 2025 largely depends on sustained ETF inflows.
Factor 2: Basis Trading and Financing Rates Determine Arbitrage Space
The basis trading mechanism is central to understanding Bitcoin price fluctuations. When perpetual or futures premiums widen, basis traders buy spot and short perpetuals or futures to lock in the spread. This causes cryptocurrencies to withdraw from exchanges, liquidity to tighten, and cash supply to increase. When funding rates are negative and the basis narrows, traders unwind by selling spot and closing short perpetuals, increasing exchange inventories and exerting downward pressure on Bitcoin prices.
In late October, the mid-term annualized basis for March Bitcoin futures was around 6-6.5%, several hundred basis points above 3-month T-bills. Subsequently, this upward momentum weakened, and the basis for March now approaches around 5%, only about 150-200 basis points above T-bills. As long as borrowing costs are controlled and collateral discounts remain stable, this level can sustain arbitrage capital participation.
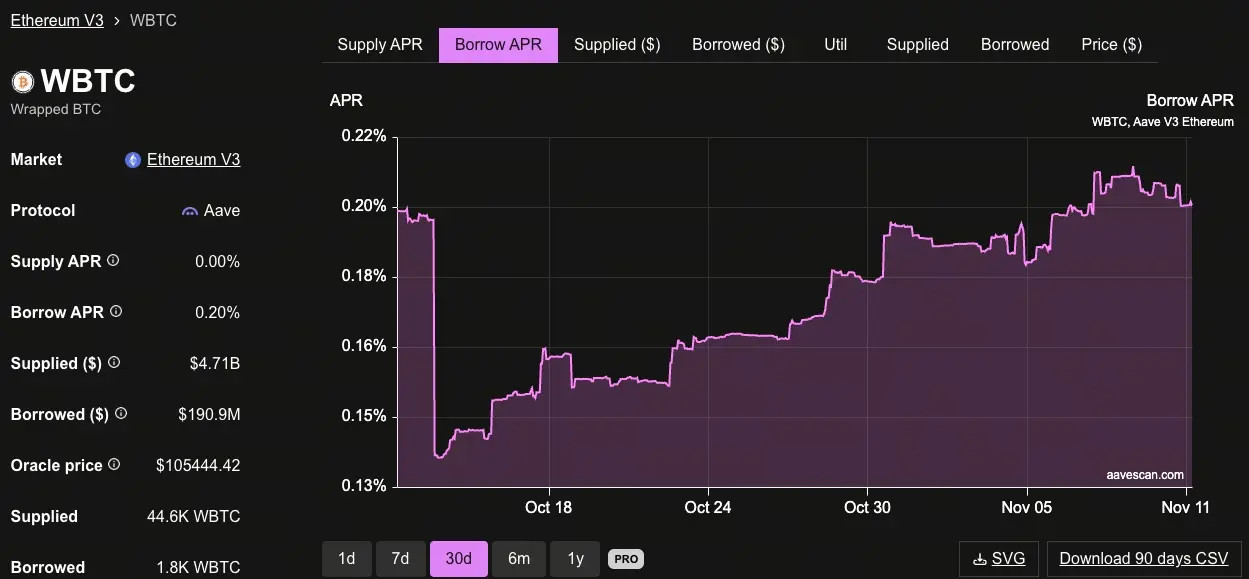
Funding rates and discounts determine the leverage supported by this spread. DeFi lending costs remain low in some areas; for example, according to Aavescan, Aave v3 WBTC borrowing costs are near 0.2%, with low utilization. Centralized exchanges show significant differences in margin lending rates for Bitcoin and stablecoins, which can reduce or increase net yields.
A simple delta-neutral template is: net return equals annualized cost minus financing costs, fees, and slippage, minus any borrowing interest rate. For example, with a mid-term rate of 6.3% and a note rate of 3.8%, the unfrictional net yield on cash financing is about 2.5%. If traders finance with stablecoins on exchanges at 3-6%, after fees, the spread may be near zero or even negative.
According to ApeX data, for perpetual contracts, 8-hour funding rates annualized (multiplied by 3 and then by 365) imply that a 0.01% 8-hour rate equates to roughly 11% annually. An annualized yield above 8%, sustained over a day or two, often attracts new hedging demand, boosting spot demand for Bitcoin.
Factor 3: Collateral Settings and Liquidation Chain Reactions
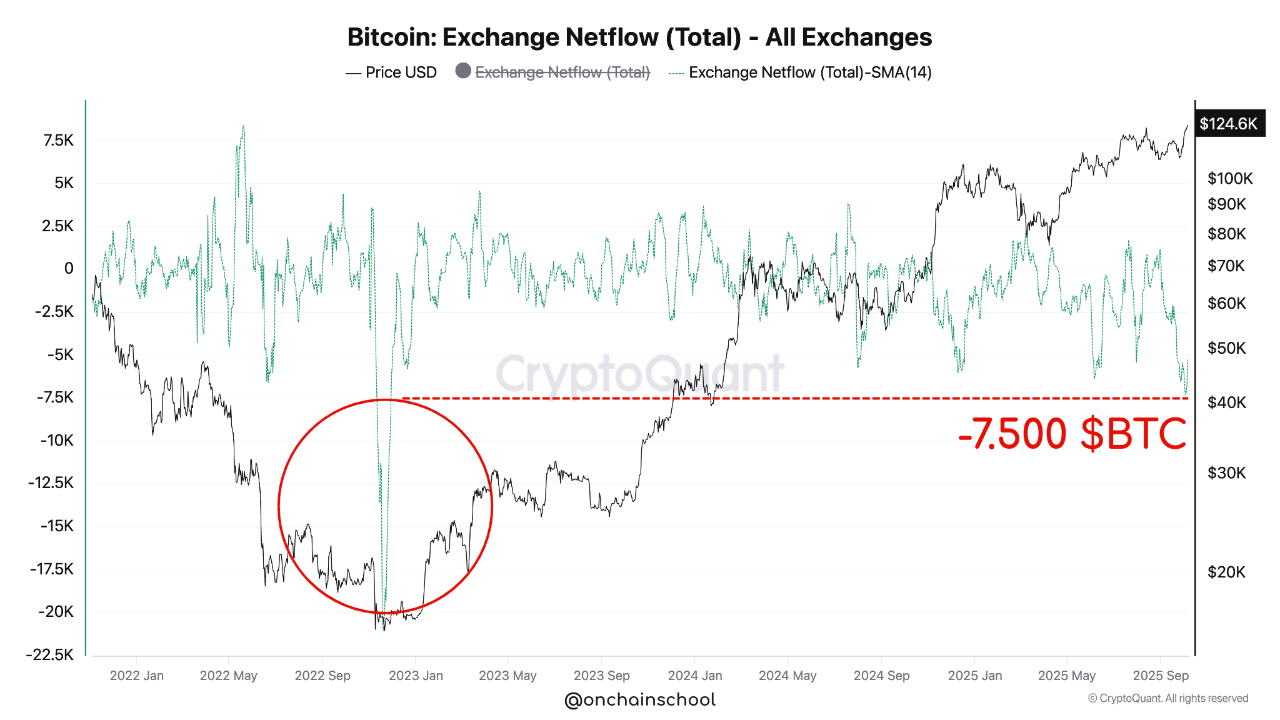
(Source: CryptoQuant)
Collateral parameters on futures and lending platforms influence spot prices through forced hedging and liquidations. The October market reshuffle again highlighted this link, with about $19 billion in positions liquidated between October 10 and 11 due to capital and basis compression resetting. Since mid-September, exchanges have adjusted margin formulas and collateral parameters, altering arbitrage returns and liquidation thresholds.
Collateral discounts and leverage are directly related. If effective leverage is proportional to the sum of initial margin and collateral discounts, then a 5-10 percentage point increase in discounts reduces available leverage by approximately 10-20%, increasing liquidation risk. Even without price changes, this can push capital toward risk-averse directions.
Liquidations and insurance funds accelerate this process. Margin maintenance calculations may force traders with high leverage to exit on small swings, while insurance funds absorb losses until a preset threshold. In a 2023 event, dYdX used about $9 million from its v3 insurance fund to cover YFI market losses, still leaving a buffer—showing how these buffers mitigate but do not eliminate deleveraging pressures.
CryptoQuant’s dashboard shows Bitcoin exchange net capital flows at three-year extremes, with ongoing outflows pushing reserves to multi-year lows in October. When basis pulls coins from exchanges and then reverses, the available supply for sale diminishes. Early Kaiko research indicates that 1% of Bitcoin market depth is about $500 million, serving as a useful indicator of how a $1 billion basis-driven spot bid can cross multiple price ranges intraday.
Three Paths and Immediate Indicators for Bitcoin’s 2025 Trajectory
Over the next month, three scenarios will be crucial for Bitcoin’s outlook:
Path 1: Basis Expansion Drives Upside — If the basis continues expanding over several days to 8-12%, arbitrage traders typically increase spot longs and CME futures shorts, consuming delivery balances and maintaining positive capital flows until new inventory arrives. Under this scenario, Bitcoin prices will continue rising.
Path 2: Basis Compression Triggers Pullback — If the basis narrows to 3% or below, and ETF capital flows turn negative within days, closing positions will push spot supply back onto exchanges, creating pressure near margin maintenance zones. This will lead to a price correction.
Path 3: Collateral Adjustments and Deleveraging — Even absent macroeconomic changes, markdowns or portfolio margin adjustments can quickly reduce risk, as declining collateral value lowers effective leverage, triggering liquidations within the same price range.
Three Immediate Indicators to Predict Bitcoin’s Next Move
Annualized Yield Indicator: Yields above 8% sustained over a day or two tend to attract new hedging demand.
Negative Capital Flow Indicator: Large negative flows from major participants on CoinGlass’s heatmap coincide with spot selling and reserve rebuilding.
Collateral Change Indicator: Posts from support centers regarding collateral ratios or portfolio margin changes can serve as early warnings of leverage restrictions.
Related Articles
Veteran Crypto Analysts Turn Bullish on Bitcoin, Target $90K–$95K as BTC Holds $78K
Gate News message, April 23 — Several veteran crypto analysts are turning bullish on Bitcoin as BTC trades around $78,000, with multiple price targets pointing to the $90,000–$95,000 range.
Analyst DonAlt, with 720,800 followers, suggests Bitcoin will likely reach $90,000 after printing
GateNews48m ago
Bitcoin Bull Market Score Index Rises to Neutral Level, But 2022 History Warns of False Signals
Gate News message, April 23 — CryptoQuant's Bitcoin Bull Market Score Index has rebounded to the neutral level of 50 for the first time since Bitcoin declined from its high of $126,000, signaling a potential shift from bear to neutral market conditions. The index, which synthesizes ten on-chain
GateNews1h ago
SHIB Market Shift Intensifies as 82.5B Tokens Leave Exchanges
SHIB sees 82.5 billion tokens leaving exchanges, signaling reduced immediate selling pressure.
Exchange flows remain mixed, showing cautious sentiment between buyers and sellers.
Price stays stable, suggesting market indecision and possible early accumulation phase.
Shiba Inu has
CryptoNewsLand1h ago
Trader Killa Says Bitcoin Needs to Hold Above 111-Day SMA to Confirm Trend Reversal
Gate News message, April 23 — Renowned Bitcoin trader Killa (@KillaXBT) stated that Bitcoin must successfully recover and hold above the 111-day simple moving average (SMA) to confirm a trend reversal. Without this, Bitcoin faces strong pullback risks within the longer-term bearish framework on
GateNews1h ago
Ethereum Spot Volume Surges 72%, Traders Eye $2,600 Liquidity Gap
Abstract: Ethereum's perpetual futures show robust buying pressure, with 24h net taker volume at $5.5B and the highest 30-day average since July 2022. ETH tests $2,400 and eyes a liquidity zone at $2,475–$2,634 as EMAs rise; CVD sits around $12.6B with neutral funding, suggesting a near-term liquidity target in that range.
ETH perpetual futures show strong buying with $5.5B 24h net taker volume and a 30-day high; ETH tests $2,400, aiming for $2,475–$2,634 liquidity zone as EMAs rise; CVD ~ $12.6B, funding neutral.
GateNews3h ago