M谋ngYueZen

vip
Peak Tier 0
Airdrop Hunter
Market Analyst
Match is match
  • Reward
  • Comment
  • Repost
  • Share
  • Reward
  • Comment
  • Repost
  • Share
User_anyvip
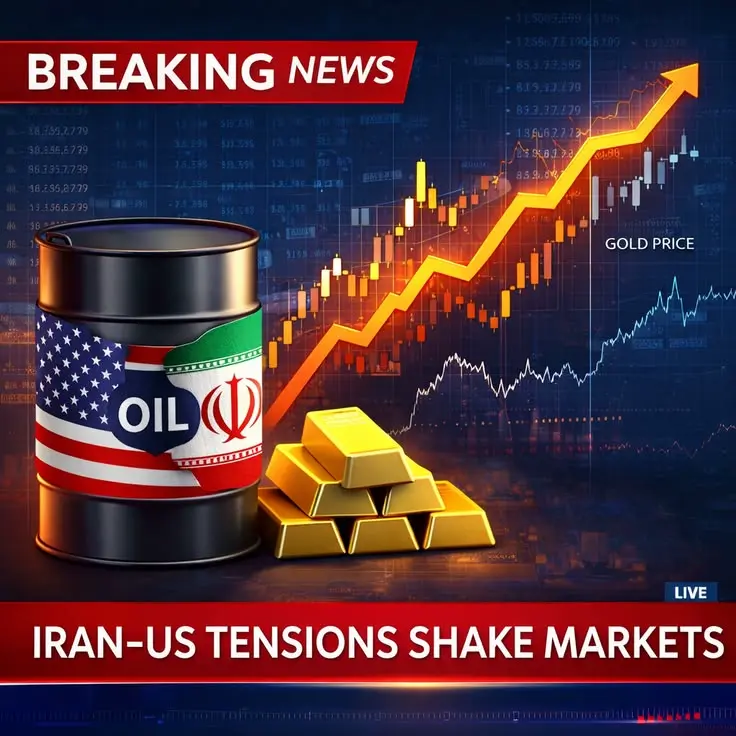
Brent at $110: Alarm Bells Ringing, Markets Pricing in "War Risk"
The "Brent $110" figure appearing on market screens is no ordinary price update; it's an alarm ringing in the energy market, the main artery of the global economy. This jump of over 6% in just one day shows that prices are no longer determined by the supply-demand balance, but directly by a "geopolitical fear premium." Markets are pricing in the worst-case scenario as they await the next move in the Middle East. This is the first and clearest signal of a shift from uncertainty to panic. The Three-Layered Truth Behind the Price Explosion.
To understand this sharp rise, we need to delve deeper than today's trigger:
The Immediate Trigger: Rising Tensions in the Strait of Hormuz
The spark behind today's 6% surge was news that Iran had launched a sudden military exercise in the Strait of Hormuz and slowed down some commercial tanker passages under the pretext of "security checks." This development in the world's most critical bottleneck for oil directly signaled to the market that "a supply disruption is approaching." What triggered the buy orders was not so much the oil itself, but the fear that the oil might not be transportable.
Fragile Ground: A Zero-Tolerance Market
Why did this news have such a huge impact? Because the market was already on a knife edge. Due to insufficient investment, there is almost no "reserve production capacity" left in the global system. OPEC+ countries do not have the power to immediately compensate for a possible disruption. This "zero-tolerance" structure causes even the slightest geopolitical news to lead to a disproportionate jump in prices. The market has no buffer left to absorb shocks.
Financial Accelerator: Algorithms and "Short Squeeze"
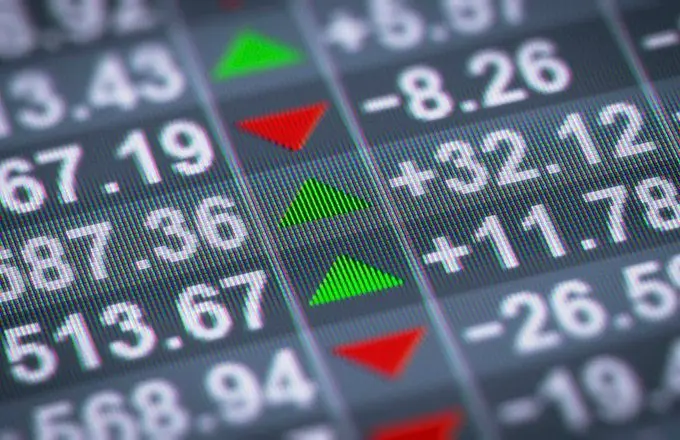
In modern markets, such movements are amplified by financial mechanics rather than fundamental analysis. Trading algorithms that reacted instantly to keywords like "Hormuz," "Iran," and "attack" fueled the initial surge. In addition, a "short squeeze" occurred as investors who had taken short positions on falling prices quickly bought to cut their losses in the face of rising prices. This turned the surge into an avalanche effect.
Prices Now Determined in Washington and Tehran
Brent reaching $110 shows us that we have entered a new era where oil prices are no longer determined by production data from Riyadh or Texas, but by the tensions between Washington and Tehran.
What Awaits the Markets? The direction of prices will no longer be determined by technical levels, but by diplomatic and military headlines. Volatility will be our new normal. While levels below $100 are now seen as a "bottom," the $120-$150 range has become an easily achievable target with the next step in escalating tensions.
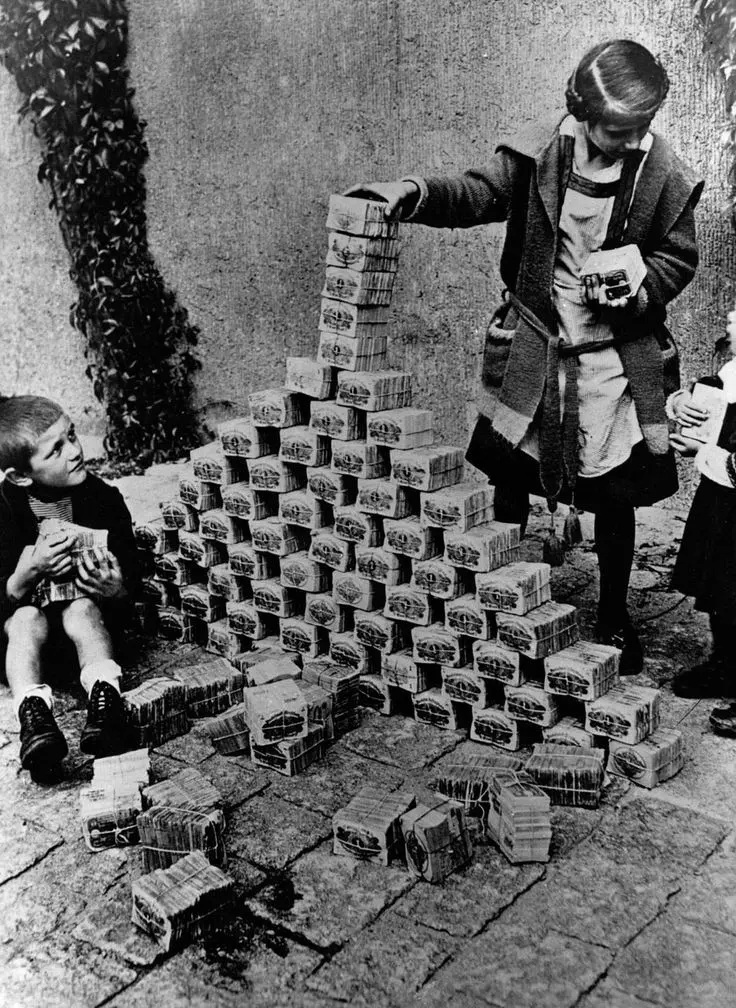
What will the economic impact be? If these levels persist, a wave of global inflation is inevitable, and central banks' dreams of interest rate cuts will completely disappear. The risk of a global recession is no longer a possibility, but the main scenario.
In short, the market is currently waiting for the next step. A diplomatic softening could quickly pull prices back, but a wrong move or a harsh statement could show us that $110 is just the beginning.
repost-content-media
  • Reward
  • 2
  • Repost
  • Share
User_anyvip:
LFG 🔥
View More
User_anyvip
Global Markets on Alert:
$BTC $XTIUSD $XBRUSD ‌Energy Shock, Crypto Decline, and a New Risk Cycle
Global markets are experiencing one of the sharpest turning points of 2026. Bitcoin's fall below $66,000 and oil prices climbing above $110 appear to be two separate market movements on the surface, but are actually different reflections of a single macro story: a deepening geopolitical crisis and an energy supply shock.
At the heart of these recent developments is the announcement by Iranian-backed Houthi forces that they have officially entered the conflict. This move by the Houthi movement represents not only a regional tension but also a direct threat to the Bab el-Mandab Strait, one of the most critical arteries of global energy trade. This narrow passage, a route through which approximately 10% of the world's oil supply is transported, while not as critical as the Strait of Hormuz, has an extremely high capacity to create systemic risk.
Parallel to this development, a move from Qatar has extended the energy crisis to a much wider area. Qatar's declaration of force majeure on its LNG contracts until May 2026, and its suspension of obligations with major importers, primarily Italy, Belgium, South Korea, and China, has triggered a supply shock not only in oil but also in natural gas. The withdrawal of a player providing approximately 20% of global LNG supply on this scale suggests that upward pressure on energy prices may be permanent.
The picture that emerges when these two developments are combined is clear: supply security in the energy market has been severely undermined. While OPEC+ maintains production discipline in the oil sector, the limited availability of alternative supply channels is rapidly driving prices upwards. Brent crude exceeding the $110 level is a result not only of the physical supply loss but also of the aggressive pricing of the "risk premium."
However, the real turning point lies in the macroeconomic chain reaction of this energy shock. The increase in energy prices directly pushes inflation expectations higher. This strengthens the possibility that central banks, especially the Federal Reserve, may postpone interest rate cuts. The "liquidity easing" scenario, which markets have long priced in, is thus postponed, while dollar liquidity in the financial system is once again tightening.
This is precisely where the sell-off in the crypto market gains significance. Bitcoin's fall below $66,000 is not a signal of structural weakness, contrary to what many investors believe; it's a classic "risk-off" pricing. When global uncertainty increases, investors move away from the most volatile assets towards cash and safe havens. In this process, crypto assets, by their nature, are among the first areas to experience selling pressure.
What is noteworthy here is the capital behavior behind the price movement. While panic selling is accelerating among retail investors, there are strong signals that large funds and institutional players are viewing these declines as gradual buying opportunities. This segment, which the market calls "smart money," generally prefers to take positions when liquidity is tight and fear is at its peak.
In short, what is happening today is not simply a crypto downturn or an oil rally. This could be the beginning of a new macroeconomic cycle triggered by the energy crisis:
Energy shock → Increased inflation → Delayed interest rate cuts → Liquidity squeeze → Selling off risky assets.
How far this chain will go depends entirely on geopolitical developments. If risks over the Bab el-Mandab Strait and the Strait of Hormuz continue to increase, new peaks in energy prices and, consequently, deeper fluctuations in financial markets may be inevitable.
In conclusion, the message the markets are currently sending is quite clear: This is not an asset-based story, but a liquidity story.
And perhaps the most critical question still remains:
Are you watching the market, or the direction of money?
#BitcoinWeakens
#OilPricesResumeUptrend
#CreatorLeaderboard
repost-content-media
  • Reward
  • 2
  • Repost
  • Share
User_anyvip:
2026 GOGOGO 👊
View More
User_anyvip
The war with Iran, which began with joint US and Israeli attacks on Iran in late February, is profoundly shaking the global economy. The de facto closure of the Strait of Hormuz by Iran has disrupted approximately 20% of the world's oil and LNG supply. Brent crude oil surged from pre-war levels of $72 to the $100-120 range and is currently trading around $100-106. This energy shock has hit Asian economies, which are heavily dependent on oil imports, the hardest, triggering a risk of stagflation. Foreign investors withdrew a net $52 billion from Asian excluding China stocks in March; this was the largest monthly outflow since 2008 and surpassed records set during Covid and the Ukraine war.
⛽ Oil and Energy Crisis
The most direct impact of the war has been the explosion in energy prices. Brent oil has increased by up to 50% due to the halt of oil and LNG shipments through the Strait of Hormuz. Asian countries (excluding China) are heavily reliant on energy from the Middle East, leading to rapidly rising import bills in economies such as Taiwan, South Korea, India, and Japan. In Europe, LNG prices have increased by 50% and are expected to remain high until 2027. This has the potential to push global inflation up by 0.8 percentage points, narrowing the room for central banks to cut interest rates.
👀 Record Capital Outflow from Asian Markets
Foreign investors lost risk appetite and exited Asia at a record pace. In March:
- Taiwan: $25 billion (the largest outflow in 18 years)
- South Korea: $13.5 billion
- India: $10 billion
A total of $52 billion in sales negatively impacted emerging markets outside of Asia as well. The Nikkei 225 experienced daily declines of up to 11%, and the Kospi up to 12%, triggering circuit breakers. Technology-heavy stock markets remained under stagflationary pressure due to rising oil costs. Analysts are describing this move as the "widest risk-off" ever.
🕵️ Global Growth and Inflation Risks
As the war drags on, global growth forecasts are being revised downwards. Experts say:
- In the short-term scenario (if the conflict eases within 1-2 months), oil will fall to the $75-90 range and growth will take a slight hit.
- In the long-term scenario (more than 3 months), oil will remain in the $100-150 range; Asia and Europe will face recession risks while growth in the US will slow.
Currencies in emerging markets are depreciating against the dollar. Gold has risen as a safe haven, but bond yields have also increased. Airline stocks have fallen by 5-6%, while defense and energy companies have seen partial support.
🤔 Regional and Sectoral Implications
In Asia, governments have closed schools to conserve fuel, called on employees to work from home, and taken measures against rising food and transportation prices. Thailand's rice exports and India's banana and rice exports to the Middle East have stalled; farmers are selling at a loss in local markets. Transportation costs have risen, and insurance premiums have skyrocketed. As the energy crisis deepens in Europe, food inflation and monetary policy pressures intensify in developing countries.
The Iran conflict has created a global energy crisis that hit Asia hardest, following the oil shock. A record $52 billion in capital outflows, stock market crashes, and inflationary pressures marked the first quarter of 2026. Despite Trump's ceasefire efforts, the situation in the Strait of Hormuz remains uncertain. Markets could recover if the conflict is resolved quickly; however, a prolonged conflict makes an Asian recession and global stagflation seem inevitable. Economists emphasize that the worst-case scenario is currently priced in, but the risks remain high.
#FedRateHikeExpectationsResurface
#USIranClashOverCeasefireTalks
#CreatorLeaderboard
repost-content-media
  • Reward
  • Comment
  • Repost
  • Share
User_anyvip
#RangeTradingStrategy
A volatile market trading strategy offers investors disciplined risk management and the opportunity to quickly seize opportunities during periods of high volatility. A range trading strategy, on the other hand, aims to achieve stable returns by buying and selling during consolidation phases where prices are squeezed between specific support and resistance levels. According to current data, as of March 27, 2026, the VIX index has reached 31.05, showing a 13.16% increase in the last day. This figure is approaching its highest levels since the tariff tensions in April 2025 and reflects the geopolitical risk premium created by the Iran war and the sharp rise in oil prices.
A volatile market trading strategy is particularly prominent in environments where the VIX index is above 30, utilizing elements such as stop-loss orders, hedging techniques, and reducing position sizes. Investors can rotate sectors using this approach, focusing on defense sectors or low-volatility stocks, while also employing options strategies such as Iron Condor and Straddle. For example, during the growth anxiety period of 2025, the low volatility factor index outperformed the overall market, and stocks like Berkshire Hathaway and Coca-Cola remained remarkably resilient. The strategy also supports scalping and swing trading to profit from short-term price fluctuations, but sudden breaks are prevented by setting stop levels with the average true range indicator in each trade.
The range trading strategy, even with high volatility, creates repeatable returns by buying at support levels and selling at resistance levels during short-term range formations. While this approach is most effective in low-volatility consolidations, it can be adapted to the current geopolitical environment by determining dynamic ranges with the ATR indicator. For example, in assets like gold, a 3.7:1 reward-risk ratio was achieved per trade when buying at support and selling at resistance in a three-week range of $187 to $190, similar to January 2024. The strategy uses volatility-sensitive tools like Keltner channels or Donchian channels to automatically update ranges, and positions are protected by the ATR multiplier. Range trading can be applied even on short-term 30-minute charts during periods of high volatility, but positions should not be opened without breakout confirmation.
Both strategies should be applied with greater caution when combined with the oil shock stemming from the Iran war in March 2026 and record capital outflows from Asian markets. While the volatile market trading strategy minimizes risk, the range trading strategy provides stable profits from sideways market movements. Investors can combine these methods to diversify their portfolios, maintain tight stop-loss orders, and optimize position sizes by monitoring average true range data. The current market conditions, with the VIX index hovering around 31, indicate that both strategies have high potential in the short term.
#VolatileMarketTradingStrategy
repost-content-media
  • Reward
  • 2
  • Repost
  • Share
User_anyvip:
LFG 🔥
View More
User_anyvip
Iran War Leads to Record Rise in Geopolitical Risk Premium, Current Level 31.05
The CBOE Volatility Index (VIX) reached 31.05 at the close of March 27, 2026, showing a 13.16% increase in the last 24 hours, rising 3.61 points from 27.44. This movement tested an intraday high of 31.65 while the low was 27.54. The VIX index has thus climbed approximately 40% since the start of the Iran war in late February, yielding a return of over 132% from its December 2025 low of 13.38.
Geopolitical Triggers and Oil Shock
The main driver of the VIX rise was the Iran war putting 20% ​​of the world's oil supply at risk via the Strait of Hormuz. Brent oil rising to the $100 range fueled fears of stagflation and rapidly increased the implied 30-day volatility in S&P 500 options. Analysts argue that the VIX remains "low" due to the Iran conflict; institutions like Slatestone Wealth comment that "the VIX should rise to the 40-50 range," while fears of supply disruptions caused by tanker attacks have unsettled the markets.
Historical Comparison and Recent Trends
- March 26, 2026: 27.44
- March 25, 2026: 25.33
- March 24, 2026: 26.95
- Average at the beginning of March: 24-26 range
The VIX has achieved a 58.45% monthly return in the last month, while rising 109.02% since the beginning of the year. While these levels don't approach the peaks of the 2022 Ukraine war and the 2020 Covid surge, they represent a sharp divergence from the low volatility period of 2025 (range 13-18). According to FRED data, the index, which was trading at 27.44 as of March 26th, reached a three-month high with the jump the following day.
Technical and Term Structure Assessment
The VIX exceeding the psychological threshold of 30 signals a "high volatility regime." The RSI is in a strong buying zone at 67.67 over the 14-day period, but also carries an overbought warning. It is noted that the contango structure in VIX futures contracts is narrowing, and backwardation signs are seen in places; this indicates that short-term fear is higher than long-term expectations. Market participants are adjusting their hedging strategies by monitoring the VIX futures curve.
Market Impacts and Investor Strategies
The rise of the VIX to 31 parallels the record capital outflow of $52 billion from Asia and deepens the risk-off environment. Analysts recommend a rotation towards the defense and energy sectors in this environment, emphasizing that option strategies like Iron Condor or Straddle become more attractive at VIX levels above 30. However, prolonged uncertainty regarding Iran maintains the potential for the VIX to rise to the 40+ band; short-term ceasefire news could lead to rapid pullbacks.
The VIX index reflects the peak of the geopolitical risk premium at 31.05 as of March 28, 2026. The disruption of oil supply and increased concerns about global growth due to the Iran conflict have structurally driven volatility upwards. In the short term, traffic in the Strait of Hormuz and Trump's ceasefire negotiations are the main catalysts, while in the long term, a drop in oil prices below $90 could pull the VIX down to the 20-25 band. Investors should keep stop-loss levels tight with the ATR indicator and review their portfolio hedges at VIX levels above 35. Current data shows that the fear index has not yet peaked, but each new geopolitical news item could create a 3-5 point movement.
#RangeTradingStrategy
repost-content-media
  • Reward
  • 2
  • Repost
  • Share
User_anyvip:
LFG 🔥
View More
User_anyvip
The VIX Volatility Index, also known as the fear index in the financial world, is a key indicator used to measure uncertainty in the markets and investors' risk perception. Originally created by the Chicago Board Options Exchange, this index has become one of the most closely watched barometers of global markets over time.
The VIX index essentially calculates the expected volatility over the next thirty days by analyzing the prices of options written on the S&P 500 indices. In other words, it measures how much volatility investors expect in the market. If the VIX rises, it indicates increased fear and uncertainty in the market. Conversely, a decrease in the VIX suggests that investors perceive a calmer and safer environment.
One of the most important functions of this index is to help understand investor behavior. In financial markets, prices depend not only on economic data but also on psychology. The VIX quantifies this psychological state. For example, during periods of economic crisis or increased geopolitical risk, the VIX rises rapidly. This indicates that investors are avoiding risk and seeking safe havens.
The VIX also plays a critical role in portfolio management. Professional investors and fund managers use this index to balance their risks. When the VIX rises, expectations of a decline in equity markets generally increase, and investors readjust their positions accordingly. Therefore, the VIX is not just an indicator but also a strategic tool.
In conclusion, the VIX Volatility Index is a powerful measurement tool that reflects the pulse of modern finance. It guides investors by reflecting fears and expectations in the markets. Beyond economic data, it is an indispensable reference point for those who want to understand human behavior and collective psychology. In this respect, the VIX is not just a number but also a reflection of the market's mood.
#CreatorLeaderboard
repost-content-media
  • Reward
  • Comment
  • Repost
  • Share
User_anyvip
One of the most important realities for those of us trading in the crypto market is that the market inherently has high volatility. Even major assets like Bitcoin and Ethereum can experience sharp fluctuations from time to time. Therefore, instead of a single fixed strategy, adopting flexible approaches that adapt to market conditions becomes more logical.
The range trading strategy is particularly useful during periods when the market is moving sideways. In this process, where the price fluctuates between a certain support and resistance range, the goal is to buy low and sell high. Patience is the most critical element here. Because most investors want to take positions before a move occurs, which creates unnecessary risk. In our approach, however, the priority should be to determine clear levels and not open trades outside these levels.
In a volatile market strategy, the situation is completely different. During periods of sharp rises and falls, it is necessary to make quick decisions. However, the biggest mistake here is opening trades in a panic. Volatility contains both opportunities and risks. Therefore, leverage should be limited, and stop-loss levels must be set. In sudden market movements, losses can be as large as gains, so discipline is paramount.
In current market conditions, a reasonable approach is to use both strategies together. When the market calms down, range trading can be used to aim for small but stable gains. When movement begins, a volatility strategy can be adopted to capitalize on opportunities. For this, tools that help understand the market direction and indicators that measure overall risk appetite should be monitored. For example, volatility indicators like VIX can provide important signals for understanding risk perception in traditional markets.
Furthermore, liquidity flow, news flow, and large investor movements should not be ignored. The crypto market moves not only with technical analysis but also with sentiment and expectations. Therefore, instead of sticking to a single method, it is necessary to think in a multifaceted way.
In conclusion, success in this market requires not a perfect strategy, but the right approach. Patience, discipline, and risk management are at least as important as technical analysis. For active traders like us, the biggest advantage is the ability to adapt quickly.
Remember, the market always offers opportunities but also carries significant risks. Therefore, caution should be exercised when trading, and every decision should be made consciously.
#CreatorLeaderboard
This is not investment advice. Please do not open a trade without doing your own research.
$BTC $ETH $SOL #RangeTradingStrategy
#VolatileMarketTradingStrategy
repost-content-media
  • Reward
  • 1
  • Repost
  • Share
User_anyvip:
LFG 🔥
  • Reward
  • Comment
  • Repost
  • Share
Vortex_Kingvip
#OilPricesResumeUptrend
The resurgence of oil prices is not a random fluctuation. It is a calculated reflection of geopolitical tension, supply disruption, and macroeconomic recalibration. The recent uptrend in global oil markets is sending a powerful signal across every financial layer, from commodities to crypto, from inflation to institutional capital flows.
This is not just about energy.
This is about the repricing of global risk.
The Core Catalyst — Why Oil Is Rising
The primary driver behind the current uptrend is geopolitical escalation in the Middle East, particularly involving Iran.
Brent crude has surged over 50 percent in a short period.
Prices have crossed $110+ per barrel levels.
Supply routes like the Strait of Hormuz are under threat.
This matters because:
👉 Around 20 percent of global oil supply flows through this region
When such a critical artery is disrupted, the entire system reacts.
Supply Shock — The Real Driver
This is not demand-driven growth.
This is a supply-side shock.
Key disruptions include:
Potential loss of 11–14 million barrels per day
Reduced drilling activity due to security risks
Declining active rigs globally
At the same time:
Inventories are tightening
Replacement supply is limited
Infrastructure damage risks remain high
This creates a classic imbalance:
👉 Less supply + stable demand = rising prices
Market Structure — A Confirmed Uptrend
From a structural perspective, oil has already entered a bullish phase.
Key support around $95 has held firmly
Prices continue making higher highs
Volatility is expanding, not contracting
This is not a temporary spike.
This is a trend backed by fundamentals.
Macro Impact — The Ripple Effect
The implications of rising oil prices extend far beyond energy markets.
1. Inflation Surge
Higher oil prices translate directly into:
Increased transportation costs
Rising food prices
Elevated manufacturing expenses
2. Financial Market Pressure
Equity markets are reacting negatively:
Major indices falling into correction territory
Investor sentiment weakening
Risk assets facing pressure
Oil is acting as a macro tightening force.
3. Central Bank Dilemma
Rising oil complicates monetary policy:
Inflation increases
Rate cuts become less likely
Liquidity conditions tighten
This creates a hostile environment for speculative markets.
Crypto Connection — The Hidden Correlation
Most traders ignore this, but it is critical.
When oil rises sharply:
👉 Inflation expectations increase
👉 Central banks stay hawkish
👉 Liquidity tightens
And when liquidity tightens:
👉 Risk assets like Bitcoin face pressure
This creates a chain reaction:
Oil ↑ → Inflation ↑ → Rates ↑ → Crypto ↓ (short-term pressure)
However, there is a second layer:
👉 Long-term, inflation hedging strengthens Bitcoin narrative
This dual effect creates volatility, not direction.
Institutional Behavior — Smart Money Moves
Institutions are not reacting emotionally.
They are positioning strategically.
Current behavior includes:
Hedging against energy-driven inflation
Rotating capital into commodities
Reducing exposure to high-risk assets
At the same time:
Energy companies are not aggressively expanding production due to:
Security concerns
Cost inflation
Capital discipline
This reinforces the supply constraint.
The Most Important Insight
This is not just an oil rally.
This is a geopolitical premium being priced into markets.
And such premiums do not disappear instantly.
They persist until:
Conflict de-escalates
Supply chains normalize
Market confidence returns
Until then:
👉 Volatility remains elevated
👉 Prices remain supported
Scenario Analysis — What Happens Next
Bullish Scenario (High Probability)
Conflict continues
Supply disruption worsens
Oil targets $120–$150 range
Extreme scenario:
👉 Prices could spike toward $200 in severe disruption cases
Neutral Scenario
Partial resolution
Supply gradually restored
Oil stabilizes between $90–$110
Bearish Scenario (Low Probability)
Full geopolitical resolution
Supply resumes quickly
Oil drops toward $60–$70 range
Even in this case, volatility will remain elevated.
Trader Psychology — The Critical Edge
Most traders make one mistake:
They chase price after it moves.
But in commodities:
👉 The real opportunity lies in understanding macro direction early
Right now, the macro direction is clear:
Supply risk is dominating the market.
Strategic Positioning
For traders and investors:
Respect the Trend
Do not fight a macro-driven uptrend.
Watch Key Levels
Support: $95
Resistance: $120+
Expansion zone: $150
Monitor News Flow
Oil is currently headline-driven.
Every geopolitical update matters.
Understand Cross-Market Impact
Oil is influencing:
Crypto
Stocks
Forex
Commodities
This is a multi-asset environment.
The Vortex Perspective
This moment represents more than just rising prices.
It represents:
Fragility of global supply chains
Power of geopolitical influence
Interconnection of financial systems
The market is not chaotic.
It is reacting logically to uncertainty.
And those who interpret this correctly gain an edge.
Final Perspective
The oil uptrend is not just a commodity story.
It is a macroeconomic shift that will:
Influence inflation
Shape central bank decisions
Drive capital allocation
For traders in crypto, equities, or commodities, ignoring this is not an option.
Because in today’s market:
Oil is not just energy.
It is direction.
Closing Signature
In the ever-evolving battlefield of global markets, where macro forces dictate micro movements, only those who see the full picture will stay ahead.
Because true mastery is not reacting to price.
It is understanding the forces that move it.
Adapt to the trend. Align with the flow. Execute with precision.
— Vortex King
repost-content-media
  • Reward
  • 2
  • Repost
  • Share
User_anyvip:
To The Moon 🌕
View More
discoveryvip
#OilPricesResumeUptrend Oil Prices Resume Uptrend on Supply Woes and Geopolitical Tensions
Global benchmark Brent crude and West Texas Intermediate (WTI) are on the rise again, erasing recent losses as the market refocuses on tightening supply, geopolitical instability, and robust demand forecasts.
After a brief period of consolidation, oil markets have reignited their bullish momentum. Crude oil prices climbed sharply in trading this week, signaling that the temporary pullback witnessed last month was merely a pause in a broader upward trajectory driven by fundamental supply-side constraints.
As of early trading, Brent crude futures surged past the key psychological threshold of $87 per barrel, while **West Texas Intermediate (WTI)** flirted with the $83 mark—levels not seen consistently since late last year.
The Drivers of the Ascent
Several converging factors are contributing to the renewed price strength, squeezing speculative shorts out of the market and enticing fresh long positions.
1. Escalating Geopolitical Risk Premium
The geopolitical landscape remains the most volatile variable for the energy complex. Despite ongoing ceasefire negotiations, tensions in the Middle East—the world’s largest oil-producing region—remain elevated.
· Red Sea Disruptions: Continued attacks on commercial shipping by Houthi militants have rerouted tanker traffic around the Cape of Good Hope. This not only delays deliveries but effectively removes a significant amount of vessel capacity from the market, tightening the supply chain.
· Russia-Ukraine Conflict: Recent Ukrainian drone strikes targeting Russian refining and storage infrastructure have taken offline a significant percentage of Russia’s refining capacity. Analysts estimate that between 600,000 to 900,000 barrels per day (bpd) of processing capacity is currently disrupted, forcing Russia to export more crude oil but potentially reducing global refined product supplies, such as diesel.
2. OPEC+ Discipline and Production Cuts
The Organization of the Petroleum Exporting Countries and its allies (OPEC+) continues to demonstrate remarkable cohesion regarding output quotas.
· Extended Cuts: The bloc, led by Saudi Arabia and Russia, has committed to voluntary cuts totaling 2.2 million bpd through at least the first half of the year.
· Compliance: Early indicators suggest that compliance with these cuts is strong, with Iraq and Kazakhstan recently pledging to compensate for previous overproduction by implementing steeper reductions in May. This tight supply discipline is occurring just as global inventories begin to draw down.
3. Stronger-Than-Expected Demand
The demand narrative has shifted from "peak oil" fears to concerns about a supply deficit.
· US Refining Activity: In the United States, refinery utilization rates are climbing as the summer driving season approaches. The Energy Information Administration (EIA) recently reported a significant draw in gasoline inventories, indicating robust domestic consumption.
· China’s Resilience: Despite persistent concerns about the property sector, Chinese economic data continues to show resilience in industrial output. The country’s crude imports remain elevated, and a surge in outbound travel during the recent Qingming holiday suggests a robust recovery in aviation fuel demand.
Market Sentiment and Technicals
From a technical analysis perspective, the charts are flashing bullish signals. Both Brent and WTI have broken out of their recent consolidation ranges, with prices moving comfortably above the 50-day and 200-day moving averages—a pattern often referred to as a "Golden Cross" for medium-term momentum.
Hedge funds and money managers have begun to rebuild their bullish positions after a period of liquidation. According to the latest positioning data, net-long positions in crude oil futures have increased for the third consecutive week, reflecting growing confidence that the upward trend is sustainable.
Implications for the Global Economy
While the uptrend is welcomed by oil-producing nations seeking stable revenues, it presents a headache for central bankers and consumers.
· Inflationary Pressures: A sustained rise in energy prices complicates the narrative for the Federal Reserve and other central banks aiming to cut interest rates. Higher gasoline and heating oil costs could keep inflation stickier for longer, potentially delaying monetary easing.
· Consumer Sentiment: In the United States, where the national average for gasoline is creeping back toward $3.70 per gallon, the "pain at the pump" could weigh on consumer confidence and retail spending ahead of the summer.
Outlook: How High Can It Go?
Market analysts are divided on the ceiling for the current rally, but the consensus is leaning toward a continuation of the uptrend in the short term.
Goldman Sachs recently reiterated its forecast that Brent could hit $90 per barrel by the summer, citing strong summer demand and tight supply. JPMorgan has cautioned that if geopolitical tensions disrupt shipping lanes further, prices could spike into the triple digits.
However, there are potential headwinds.
1. OPEC+ Strategy: The market is watching closely whether OPEC+ will unwind its voluntary cuts in June or extend them further into the second half of the year.
2. Ceasefire Potential: A sudden, unexpected breakthrough in Middle East ceasefire talks could rapidly strip out the current geopolitical risk premium, leading to a sharp correction.
  • Reward
  • 1
  • Repost
  • Share
User_anyvip:
To The Moon 🌕
thnk teacher
CryptoSelfvip
Bitcoin Below 66,000: The Psychology of Correction
When Bitcoin falls below $66,000, the immediate reaction is almost purely numerical.
Percentage drops.
Support levels breached.
Candlestick patterns, Fibonacci retracements, RSI readings.
Analysts glue themselves to charts, traders watch their stop-losses trigger, and social media floods with the same anxious question: “Is this the dip to buy, or is the crash finally here?”
But the real story is not in the price itself.
It’s in the human reaction to the price.
Bitcoin, more than any other major asset, is powered by collective belief. It has no government backing, no central bank guarantee, and no physical commodity behind it. Its entire value rests on one fragile foundation: conviction. And conviction is inherently emotional and breakable.
A 4% drop, in isolation, is not catastrophic. In traditional markets, it would barely register as notable volatility. Yet in Bitcoin, even modest moves can trigger wildly disproportionate responses. Why? Because this is a market built on sentiment, narrative, and psychology far more than on fundamentals.
Fear Spreads Faster Than Logic
Human beings are wired to feel losses more intensely than gains — a cognitive bias known as loss aversion. A sudden 4% decline at night can feel far more painful than a 10% gain spread over a week. When prices break key psychological levels like $66,000, the brain shifts from rational analysis to survival mode.
Social media accelerates this dramatically. In the age of instant information, fear travels at the speed of a tweet, a YouTube thumbnail, or a Telegram group message screaming “Everyone is selling.” What begins as a technical correction quickly morphs into a self-reinforcing panic. Anchoring bias kicks in: people mentally fixate on the recent all-time high (for example, above $100,000) as the “new normal,” making every dip feel like the beginning of the end.
FOMO (fear of missing out) flips into its dark twin — the fear that this time it really is over.
the Fragility and Resilience of Belief
Bitcoin’s value is not stored in vaults or balance sheets. It lives in the shared conviction of millions: that scarce, decentralized digital money will matter more in the future than it does today. Every halving, every institutional adoption, every nation-state announcement strengthens that belief. But the opposite is also true — bad news, liquidations, or negative headlines can weaken it rapidly.
Yet history shows something remarkable: belief in Bitcoin rarely disappears completely. It gets shaken, tested, and sometimes severely wounded, but it does not vanish.
Look at past cycles:
- In 2018, Bitcoin crashed nearly 85%. “It’s dead” was the consensus.
- In 2022, after the FTX collapse, it fell over 70%. Again, many declared the experiment over.
Each time, the obituaries were written. Each time, conviction returned — often stronger, carried by a more battle-tested group of holders.
Corrections act as a filter. They shake out the weak hands, the over-leveraged speculators, and the tourists who entered purely for quick profits. Those who remain are usually the ones who truly understand the long-term thesis: finite supply, decentralization, inflation hedge, borderless value transfer. The story doesn’t die with the price — it actually hardens.
the Recovery Mechanism: Why Belief Rebuilds
After every significant drop, a recovery attempt almost always follows. Why?
First, cognitive dissonance plays a role. Once someone has committed to the Bitcoin thesis, their mind works hard to resolve the discomfort of a falling price. New rationalizations emerge: “This is just a liquidity flush,” “Institutions are still accumulating,” “The halving cycle isn’t over,” “Countries are adding Bitcoin to their reserves.”
Second, lower prices attract fresh capital. What looks like disaster to sellers becomes opportunity to buyers. The same $66,000 level that triggers panic selling also draws in new believers who see “cheap” Bitcoin relative to previous highs.
This creates Bitcoin’s most powerful cyclical pattern: fear clears the field, allowing stronger conviction to take control again. The weak hands sell at a loss; the strong hands accumulate. Over time, this Darwinian process has repeatedly pushed Bitcoin to new highs after every major drawdown.
Media plays its own psychological role. Headlines are engineered for maximum emotion — “Bitcoin is Crashing!” or “Bitcoin Hits New All-Time High!” — because fear and greed keep audiences engaged. The truth is usually more nuanced: Bitcoin remains one of the highest-returning assets over the long term, but in the short term, it is an emotional rollercoaster.
# Conclusion: Conviction Is Tested, Not Destroyed
When Bitcoin slips below $66,000, what we witness is not merely a price correction. It is a psychological battlefield where fear, hope, logic, and raw human emotion collide.
Numbers matter, but they are secondary. The primary force is how those numbers affect the collective mind of the market.
Fear does spread faster than logic.
But belief dies more slowly than most expect.
Every correction shakes the tree, yet the deepest roots remain. The conviction that survives is not the naive optimism of new bulls — it is a more mature, battle-scarred belief, tempered by volatility and reinforced by history.
Bitcoin is not just an asset.
It is a living experiment in collective conviction.
And history keeps proving the same lesson: that conviction, even when shaken, has an extraordinary ability to rebuild itself — often stronger, wiser, and more resilient than before.
#WinGoldBarsWithGrowthPoints #RangeTradingStrategy #BitcoinWeakens #FedRateHikeExpectationsResurface
repost-content-media
  • Reward
  • Comment
  • Repost
  • Share
Growth Points Lucky Draw
Invite friends to join and win great prizes!
https://www.gate.com/activities/pointprize/?now_period=17&refUid=47600335
  • Reward
  • Comment
  • Repost
  • Share
Growth Points Lucky Draw
Invite friends to join and win great prizes!
https://www.gate.com/activities/pointprize/?now_period=17&refUid=47600335
#WinGoldBarsWithGrowthPoints
User_anyvip
Growth Points Lucky Draw
Invite friends to join and win great prizes!
https://www.gate.com/activities/pointprize/?now_period=17&refUid=11796723
#WinGoldBarsWithGrowthPoints
repost-content-media
  • Reward
  • 2
  • Repost
  • Share
User_anyvip:
LFG 🔥
View More
  • Reward
  • 1
  • Repost
  • Share
User_anyvip:
good luck 🤞
Gate Live Watch & Trade Rewards — Exclusive Live Streaming Event https://www.gate.com/campaigns/4262?ref=VQVCUFSMVG&ref_type=132
post-image
  • Reward
  • Comment
  • Repost
  • Share
Check in to Stream, Sprint for VIP+1 and Monthly Bonus https://www.gate.com/campaigns/4271?ref=VQVCUFSMVG&ref_type=132
post-image
  • Reward
  • Comment
  • Repost
  • Share
BTC0.02%
User_anyvip
The Kingdom of Bhutan has taken a remarkable step by systematically depleting its Bitcoin reserves in 2026. According to on-chain data from Arkham Intelligence, the country sold approximately $120 million worth of Bitcoin this year, reducing its total holdings by around 1,700 BTC. These sales are typically conducted in small batches of $5-10 million; the funds are transferred to exchanges or institutions such as Singapore-based market maker QCP Capital. While the frequency of transfers has increased significantly recently, the government sent another 123.7 BTC (approximately $8.5 million) to a new address on March 27, 2026. This move indicates that Bhutan views Bitcoin as a "treasury asset" and is pursuing a controlled exit strategy to meet its liquidity needs.
Detailed Sales Overview and On-Chain Facts
Data obtained from Druk Holding Investments wallets tracked by Arkham Intelligence clarifies the picture:
- Total for 2026: Approximately $158.57 million worth of Bitcoin was withdrawn from the wallets; in return, there was approximately $38.84 million inflow. Net outflow is around $120 million.
- Asset Decrease: From its peak of 13,000 BTC (end of 2024), it has decreased by approximately 66% to 4,453 BTC (current market capitalization approximately $315 million).
- Acceleration in March: Sales, which progressed with small transfers of $5-15 million in January-February, gained momentum in March. On March 26th, 519.7 BTC ($36.75 million) was sent to two wallets (one linked to QCP Capital). The following day, a transfer of 123.7 BTC took place. With the $11.8 million movement at the beginning of March, the monthly outflows exceeded the $120 million mark.
Bhutan conducts its sales through OTC (over-the-counter) methods and professional brokerage firms like QCP Capital. This approach allows large blocks to be melted down without directly impacting exchanges, minimizing market impact. Analysts emphasize that this tactic is routine treasury management, not "panic selling."
Why Are They Selling? Geopolitical and Economic Background
Bhutan is one of the world's first sovereign Bitcoin miners. The country mines at virtually zero cost using its surplus hydroelectric power. It is estimated that since 2019, this operation has generated over $765 million in profit – a 500% return on energy costs. Every BTC sold represents pure profit.
The main purpose of the sales is to finance national development projects. The need for liquidity is particularly prominent for a massive project like Gelephu Mindfulness City, worth $100 billion. Bhutan had previously pledged up to 10,000 BTC to this project; however, this commitment is being reshaped as reserves dwindle. The sales position Bitcoin as a strategic tool rather than a means of "holding forever": while mining continues, accumulated assets are directed towards national needs.
Market Impact and Strategic Assessment
These sales are not on a scale that will directly shake the Bitcoin market. Thanks to a slow and predictable distribution, a supply shock is not created. However, a sovereign state reducing its reserves reignites the debate on "states' Bitcoin strategies." The Bhutanese example shows how pragmatic countries that accumulate assets through mining (like El Salvador) can be in liquidity management.
On the other hand, this move is a sign of Bitcoin's maturity: it is no longer just a "hodl" tool, but an active treasury management tool. Bhutan's ability to sustain low-cost production thanks to its hydroelectric power advantage suggests that sales are an "opportunity" rather than a "necessity." The market readily absorbs these outflows; during recent transfers, the BTC price remained stable around the $70,000 mark.
Bhutan's $120 million Bitcoin sale in 2026 summarizes a country's mature stance towards digital assets. This strategy, driven by small batches, professional partners like QCP Capital, and increasing transfer frequency, both finances national development and provides a controlled supply to the crypto market. How much further reserves will decrease in the coming months and how mining operations will evolve will be closely watched by the crypto world. Bhutan reflects its "Gross National Happiness" philosophy in its Bitcoin balance sheet: happiness comes from sustainable and smart financial decisions.
#BitcoinWeakens
#CreatorLeaderboard
repost-content-media
  • Reward
  • 2
  • Repost
  • Share
User_anyvip:
thanks bro for sharing
View More
  • Pin