
XRP Price Analysis: Outflows from ETFs and declining momentum suggest a deeper correction:
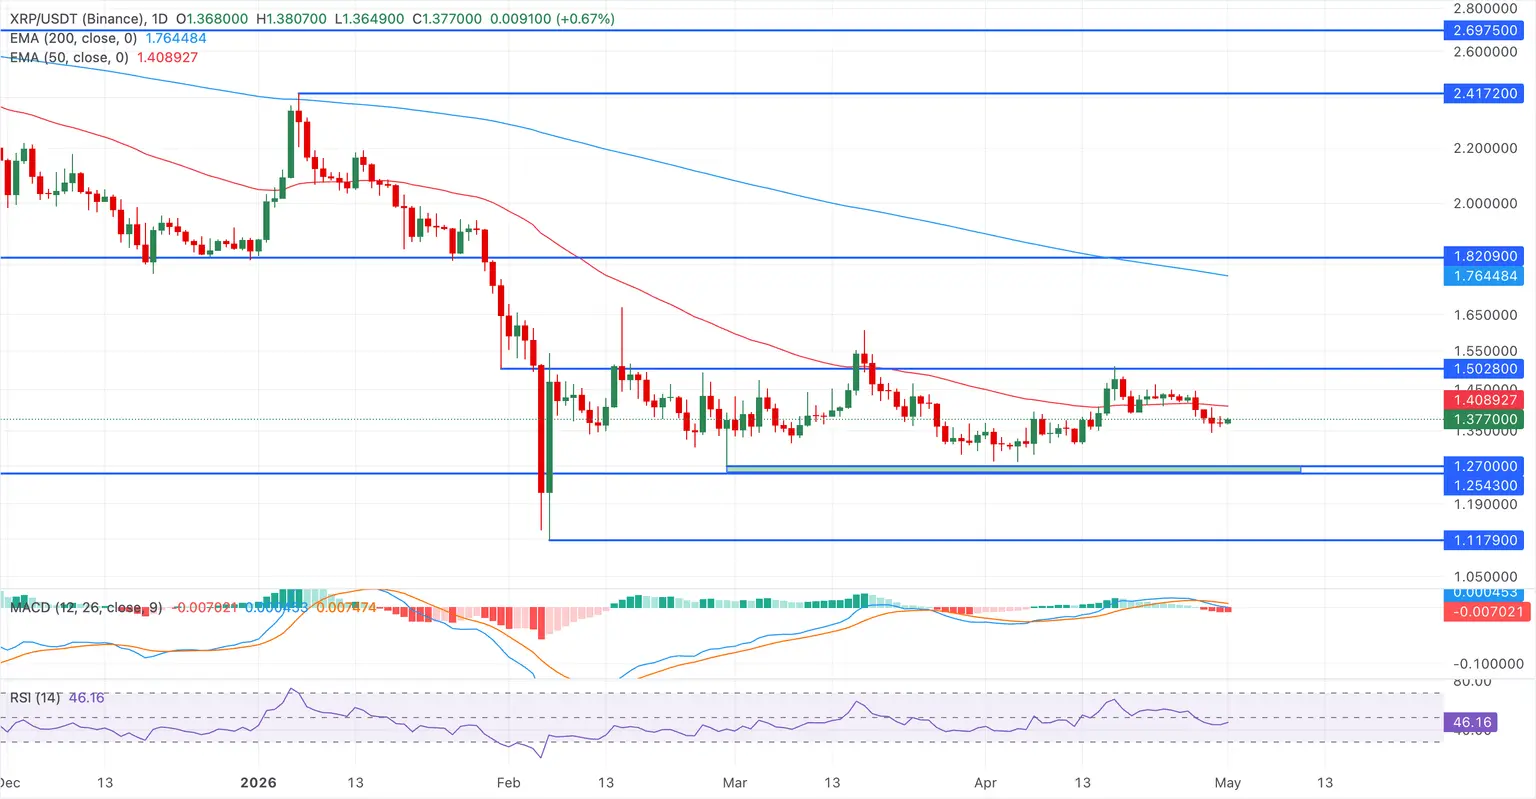
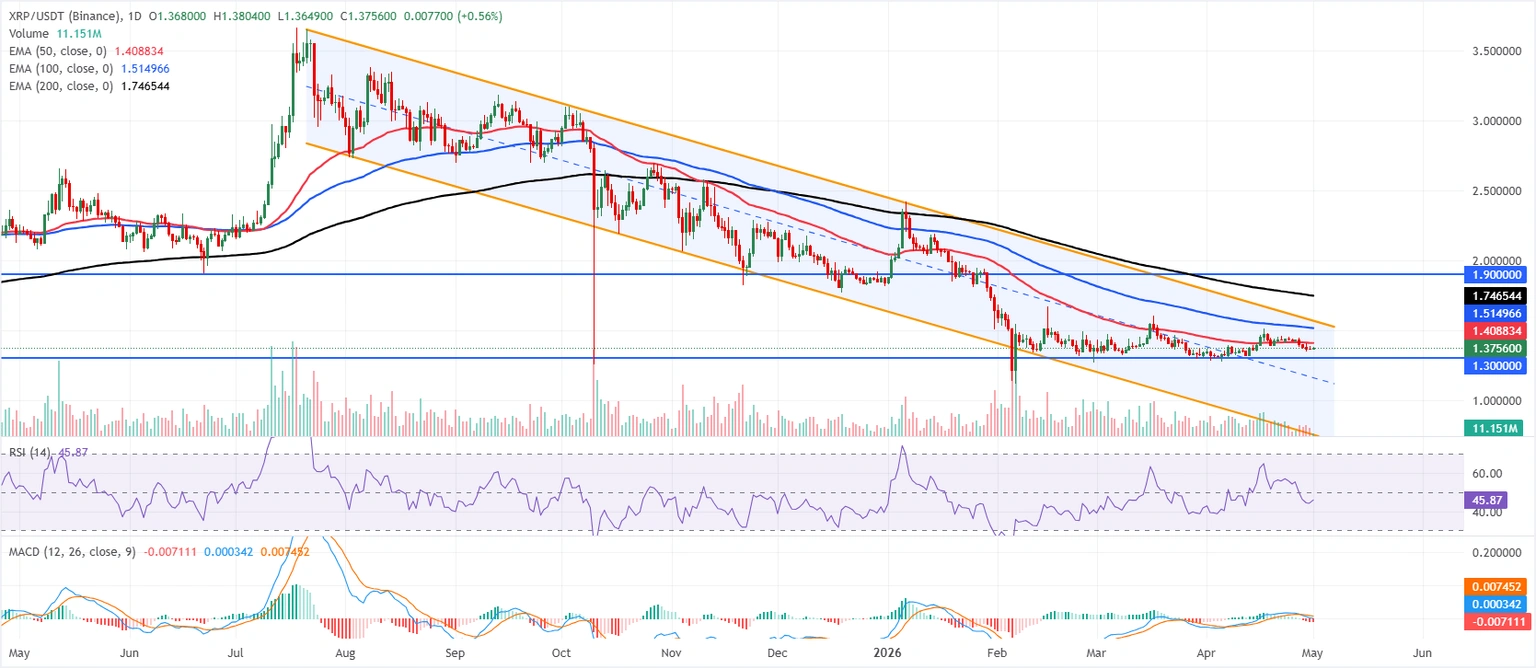
XRP price hovers around $1.37 on Friday after recording four consecutive red candles this week and losing over 4%.
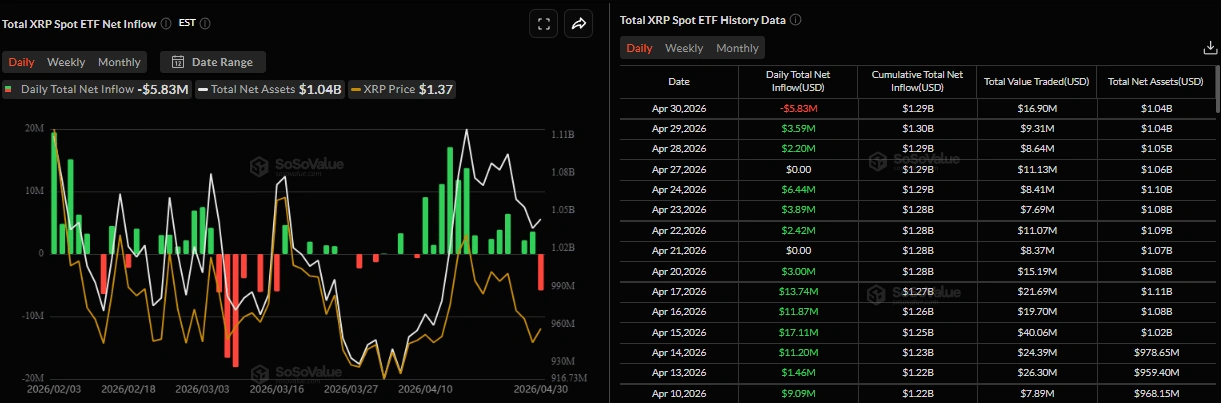
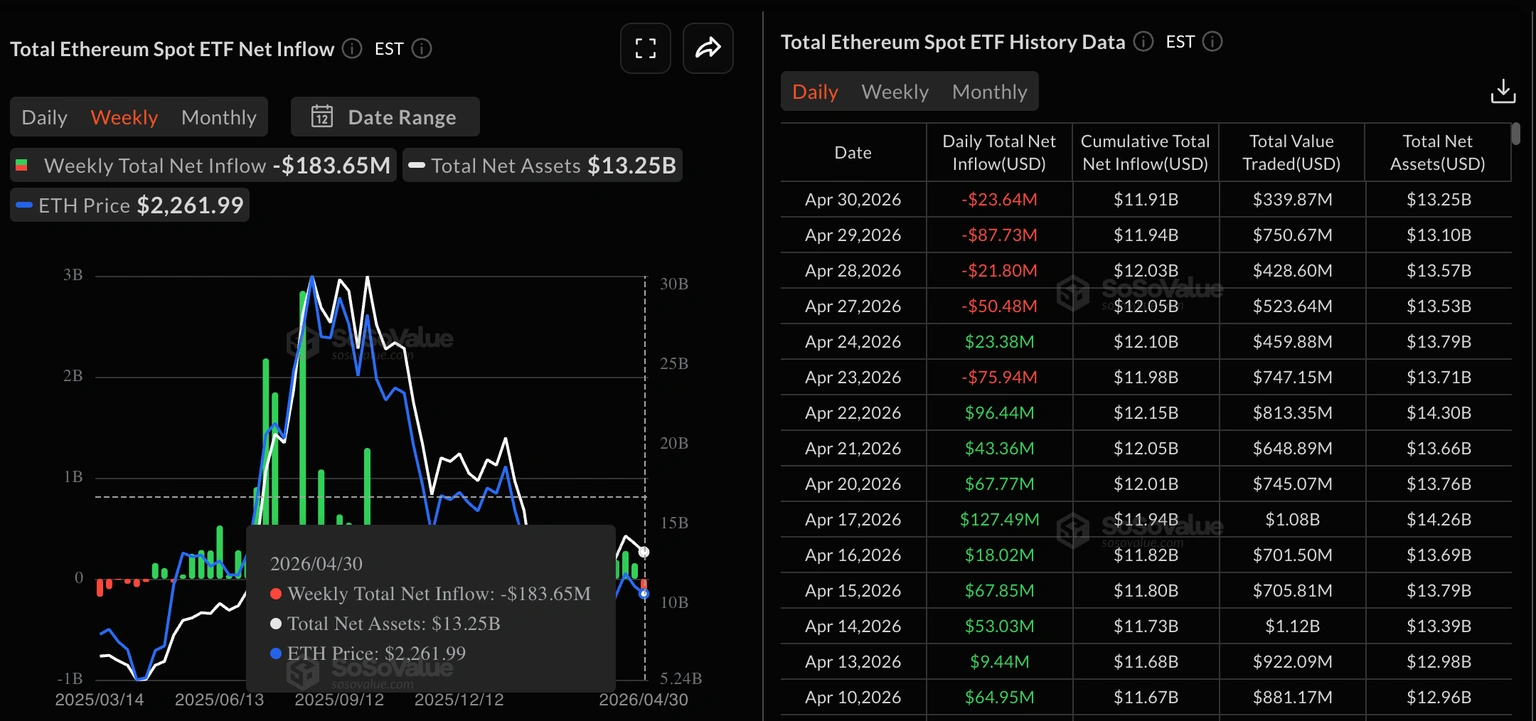
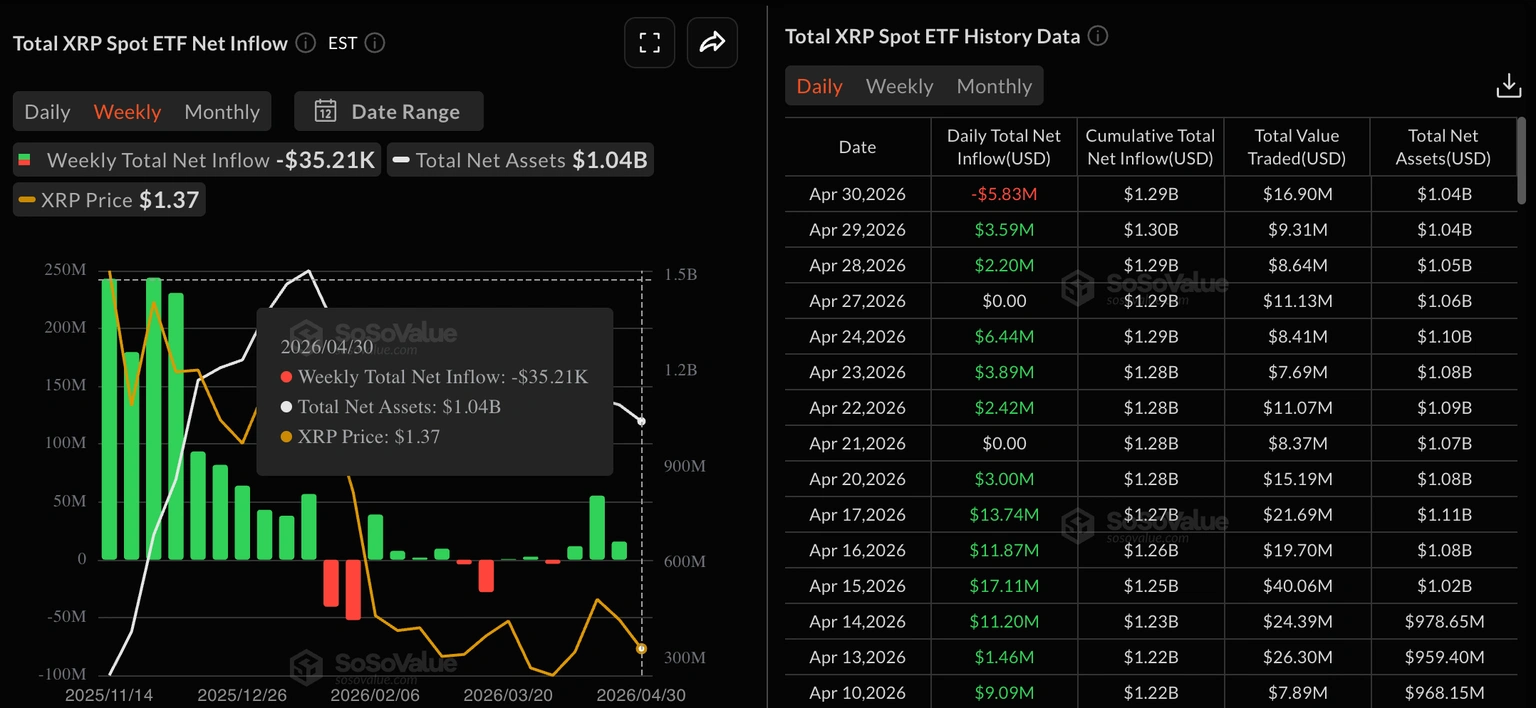
U.S.-listed spot ETFs recorded a new outflow of $5.83 million on Thursday, indicating a cautious stance.
Technical forecasts point to weakening momentum indicators, hinting at a deeper correction.
XRP's price trades at $1.37 on Friday, after experiencing four consecutive daily losses this week. Weakening momentum and changing institutional investor sentiment, reflected in new outflows from ETFs, negatively impact price movement, indicating a deeper correction ahead.
Institutional demand shows signs of caution
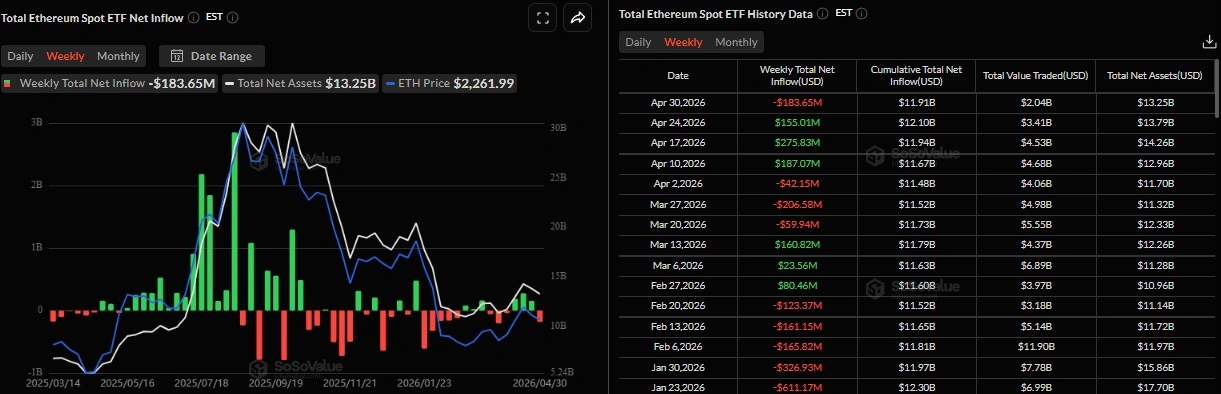
Data from SoSoValue shows that XRP spot ETFs recorded outflows of $5.83 million on Thursday, ending a two-day streak of inflows. If this outflow continues and intensifies, XRP's price could see further corrections.
Daily chart of net XRP spot inflows to ETFs. Source: SoSoValue
- Some signs of optimism:
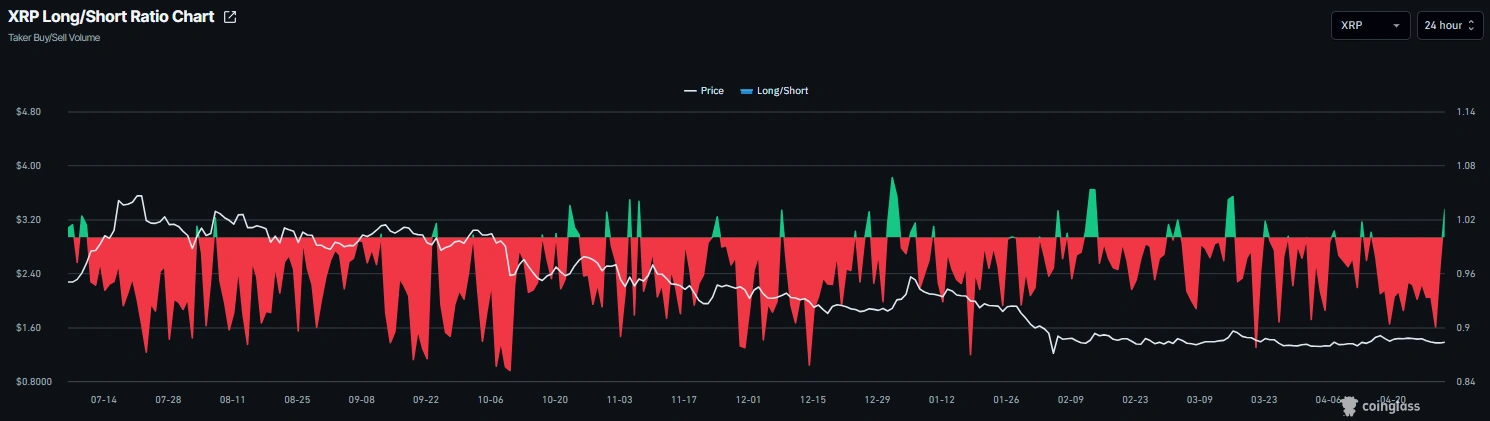
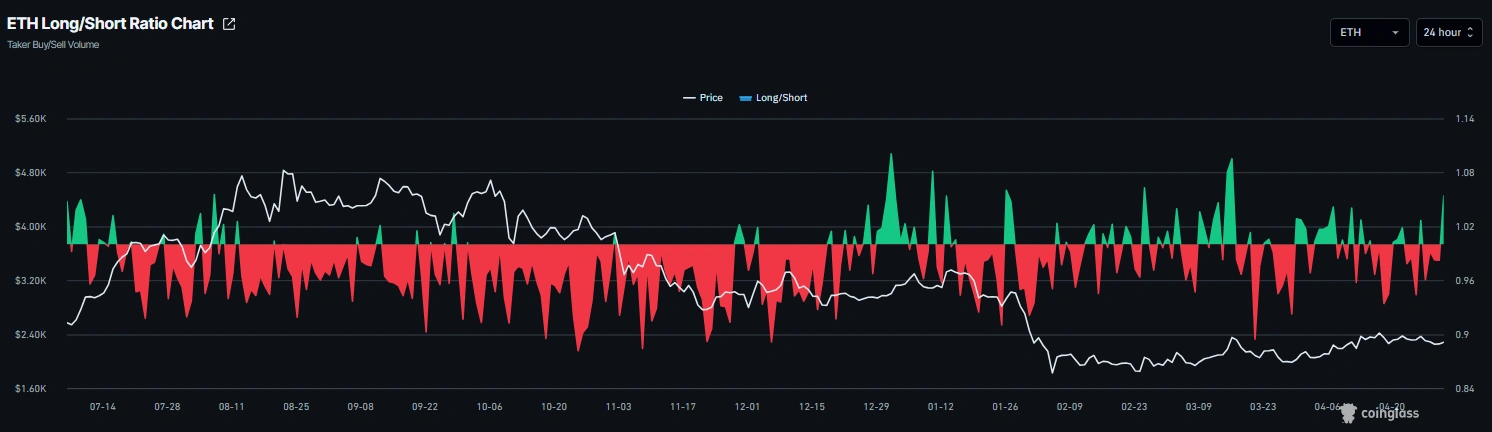
Aside from the cautious signals shown by institutional demand, derivatives data indicate some optimism for XRP. The buy-to-sell ratio for XRP on CoinGlass reached 1.03 on Friday, approaching its highest level in a month after remaining mostly in the red since early April. This ratio, exceeding one, reflects a bullish market trend, with more traders betting on higher prices.
Chart of the buy-to-sell ratio for XRP. Source: Coinglass
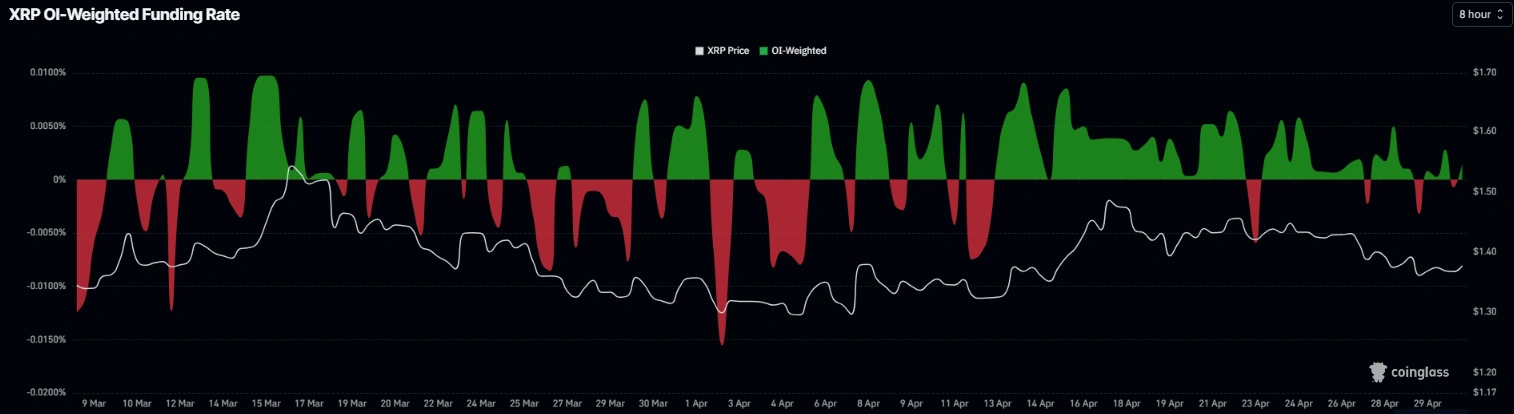
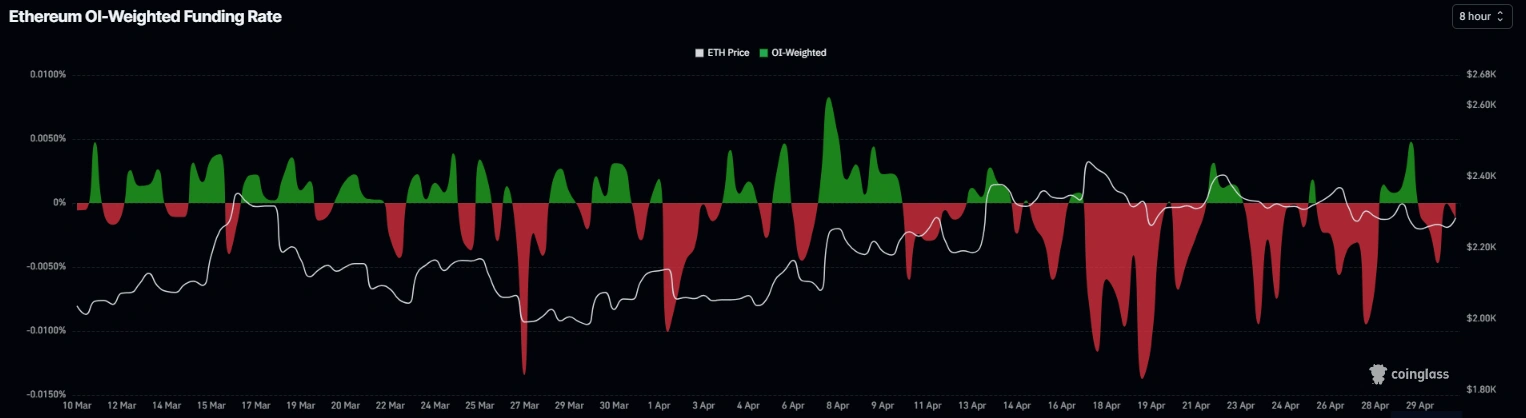
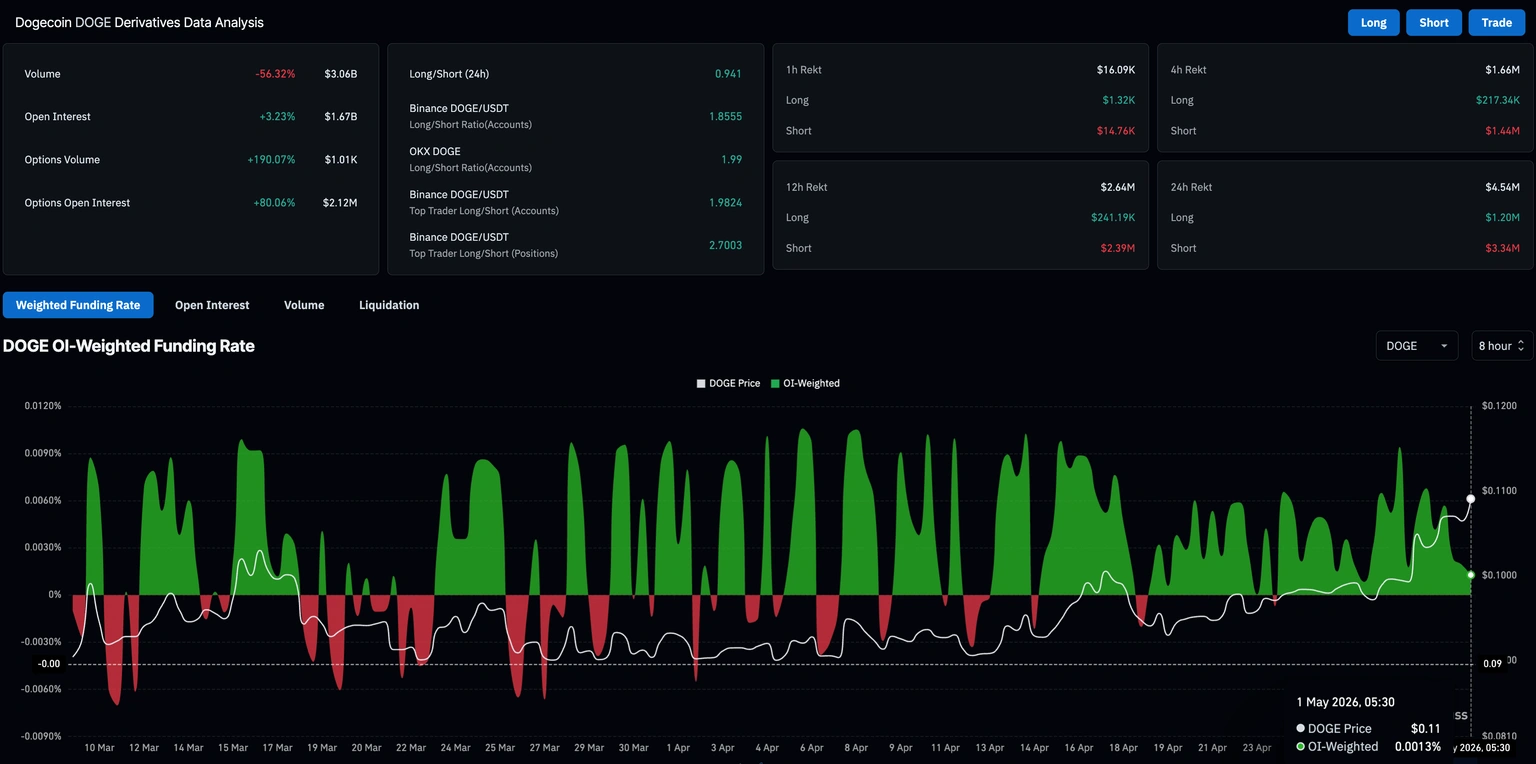
Open interest funding rate data for XRP from CoinGlass turned positive on Friday, reaching 0.0015%, indicating that buyers are paying sellers and expecting a moderate bullish trend.
XRP funding price chart. Source: Coinglass
XRP price hovers around $1.37 on Friday after recording four consecutive red candles this week and losing over 4%.
U.S.-listed spot ETFs recorded a new outflow of $5.83 million on Thursday, indicating a cautious stance.
Technical forecasts point to weakening momentum indicators, hinting at a deeper correction.
XRP's price trades at $1.37 on Friday, after experiencing four consecutive daily losses this week. Weakening momentum and changing institutional investor sentiment, reflected in new outflows from ETFs, negatively impact price movement, indicating a deeper correction ahead.
Institutional demand shows signs of caution
Data from SoSoValue shows that XRP spot ETFs recorded outflows of $5.83 million on Thursday, ending a two-day streak of inflows. If this outflow continues and intensifies, XRP's price could see further corrections.
Daily chart of net XRP spot inflows to ETFs. Source: SoSoValue
- Some signs of optimism:
Aside from the cautious signals shown by institutional demand, derivatives data indicate some optimism for XRP. The buy-to-sell ratio for XRP on CoinGlass reached 1.03 on Friday, approaching its highest level in a month after remaining mostly in the red since early April. This ratio, exceeding one, reflects a bullish market trend, with more traders betting on higher prices.
Chart of the buy-to-sell ratio for XRP. Source: Coinglass
Open interest funding rate data for XRP from CoinGlass turned positive on Friday, reaching 0.0015%, indicating that buyers are paying sellers and expecting a moderate bullish trend.
XRP funding price chart. Source: Coinglass