
FET has quietly drifted into a part of its chart that long-term traders tend to care about a lot more than whatever happens on a 5-minute candle.
After taking a brutal hit from its cycle highs, the FET price is now sitting in an area that often separates projects that disappear from those that quietly reset and come back stronger.
So the real question isn’t whether FET is volatile. That’s a given. The question is whether this level marks the start of a real accumulation phase or just another pause before things get worse.
- Zooming Out on the Bigger FET Picture
- Why This Zone Is So Important for FET
- Where the Upside Could Begin to Unfold
Zooming Out on the Bigger FET Picture
When you look at the higher time frame chart shared by Patel, FET has been moving inside a broad ascending channel that’s been respected all the way since 2020. That alone already says a lot.
Even after dropping almost 97% from its all-time high, the FET price didn’t completely fall apart. Instead, it made its way back to the bottom of that long-term channel and found buyers waiting there.
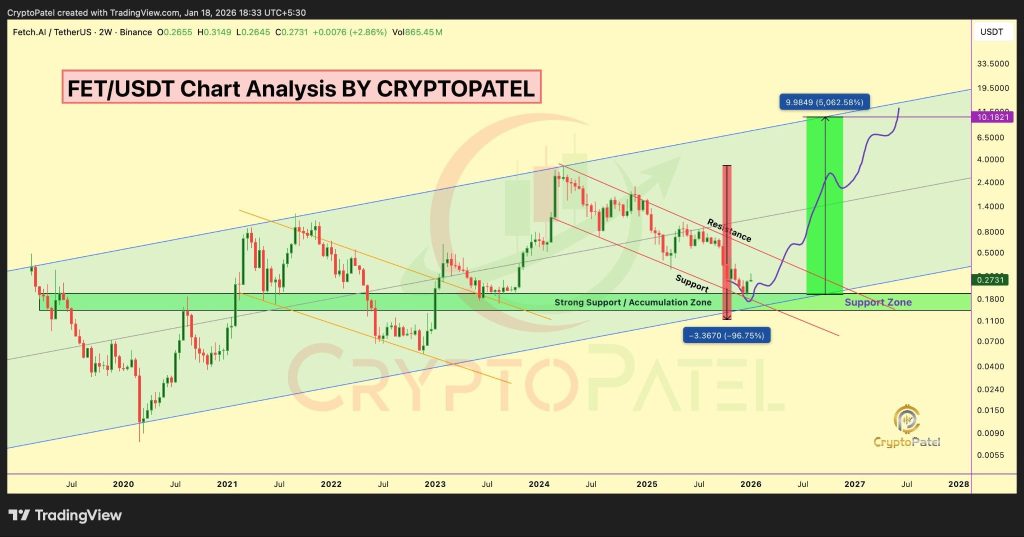
Source: X/@CryptoPatel
That kind of behavior usually points to a reset rather than a breakdown. When a price retraces that deeply but still holds its macro structure, it often means long-term players are stepping back in instead of walking away.
What makes this even more interesting is the demand zone around $0.19 to $0.20. That area has acted like a real floor, where price started to stabilize instead of free-falling. As long as the FET price stays above this range, the bigger bullish idea remains technically intact.
Is Crude Oil Price About to Repeat Its Most Explosive Pattern from History?_**
Why This Zone Is So Important for FET
Support zones become truly meaningful when several technical factors line up at the same place, and that’s exactly what’s happening here.
The lower boundary of the long-term channel and that horizontal demand zone are basically overlapping. That kind of confluence is what longer-term traders look for because it defines risk and reward very clearly.
In simple terms, it gives the market a clean line in the sand. A higher time frame close below $0.19 would seriously weaken the setup. But as long as that level holds, the chart continues to lean bullish.
And right now, the price behavior itself is telling a story. The FET price isn’t accelerating lower anymore. It’s compressing and calming down, which is often how accumulation phases start after a major correction.
Where the Upside Could Begin to Unfold
CryptoPatel’s targets of $0.60, $1, $2.80, $5, and even $10 might sound wild at first, but when you place them on the chart, they actually line up with previous value zones and the upper boundary of the long-term channel.
A move toward $0.60 would be the first sign that the trend is shifting rather than just bouncing. From there, reclaiming $1 and the $2.80 region would bring the FET price back into areas that defined earlier cycles.
The higher targets near $5 and $10 only really come into play if the broader AI narrative and overall market conditions support a full macro recovery, not just a short-lived relief rally.
The key is to view these levels as long-term scenarios, not short-term promises. They outline what becomes possible if structure, demand, and market momentum all start working in the same direction.
As long as the FET price stays above that $0.19 macro support, the chart keeps its bullish structure. Whether that eventually turns into a true 5000% move will depend on time, execution, and the broader market cycle, but from a technical point of view, the foundation is clearly there.
Disclaimer: The information on this page may come from third parties and does not represent the views or opinions of Gate. The content displayed on this page is for reference only and does not constitute any financial, investment, or legal advice. Gate does not guarantee the accuracy or completeness of the information and shall not be liable for any losses arising from the use of this information. Virtual asset investments carry high risks and are subject to significant price volatility. You may lose all of your invested principal. Please fully understand the relevant risks and make prudent decisions based on your own financial situation and risk tolerance. For details, please refer to
Disclaimer.
Related Articles
Bittensor (TAO) Hits a 3-Month Peak: What Caused the Rally and What Comes Next?
Many leading cryptocurrencies have posted slight declines or negligible increases over the past 24 hours, but this isn’t the case for Bittensor (TAO), whose price soared by 15%.
The question now is whether this momentum can hold or if a pullback is coming next.
Further Gains
CryptoPotato13m ago
Ethereum (ETH) on the Edge: Critical Level Stands Between New Bull Run and a Major Crash
While the second-largest cryptocurrency has registered a significant rebound over the past month, it remains at risk of plummeting to drastically low levels during this cycle.
On the other hand, some important indicators suggest that the worst might be over and the price could be gearing up for a m
CryptoPotato1h ago
Powell Speech Today Drives Focus on Delayed Fed Rate Cuts
The Federal Reserve maintained interest rates, causing market volatility and altering rate cut expectations. Rising oil prices and inflation concerns affect economic outlooks, while Bitcoin shows signs of recovery amid cautious optimism. Powell's upcoming remarks are key for future market sentiment.
CryptoBreaking1h ago
Bittensor (TAO) Is Up 140% in 6 Weeks, But Data Shows Retail Is Missing the Big AI Rally
Bittensor has recorded a 140% price increase over the past six weeks, including a 105% rise since March 8.
The latest price action has pushed it to the 26th-largest cryptocurrency by market capitalization, according to new data from Santiment.
AI Tokens Heat Up
-----------------
The rally comes a
CryptoPotato2h ago
Fed's Powell's comments sooth bond market, but oil continues rise, hitting crypto and stocks
U.S. stocks fell despite soothing comments from Fed Chairman Powell about inflation, while oil prices surged, negatively impacting risk assets. The bond market reacted favorably, with Treasury yields dropping and expectations for future Fed rate hikes dimming.
CoinDesk2h ago
Bitcoin Flashes 'Warning Sign' With Nearly Half of BTC Supply Sitting at a Loss: Report
A recent report reveals that 47% of Bitcoin holders are experiencing unrealized losses, with long-term holders particularly affected. Despite Bitcoin's price remaining stable recently, the market shows signs of stress, raising concerns about potential price drops.
Decrypt2h ago
