
Key Takeaways
-
Litecoin (LTC) has dropped nearly 10% over the past week, underperforming Bitcoin and Ethereum.
-
Despite the price dip, whales are heavily accumulating LTC in both spot and futures markets.
-
Large holders have been net buyers since prices fell near the $75 level, signaling long-term confidence.
-
On the daily chart, LTC is forming a right-angled descending broadening wedge pattern.
-
The $69.46 trendline support has held firm, triggering a bounce back above $73.
-
A breakout above the $81.16–$87.54 resistance zone could open the door for a move toward $100.
-
A breakdown below $69.46 would invalidate the bullish setup and weaken the outlook.
Litecoin (LTC) has shown contrasting price action over the past week compared to the broader crypto market. While Bitcoin (BTC) and Ethereum (ETH) are both up more than 5% during the same period, LTC has declined by nearly 10% in the last seven days. However, beneath this short-term weakness, on-chain and derivatives data suggest a very different story may be unfolding.
The recent dip appears to have attracted aggressive buying from large players, while the chart structure hints that Litecoin could be approaching a critical inflection point.
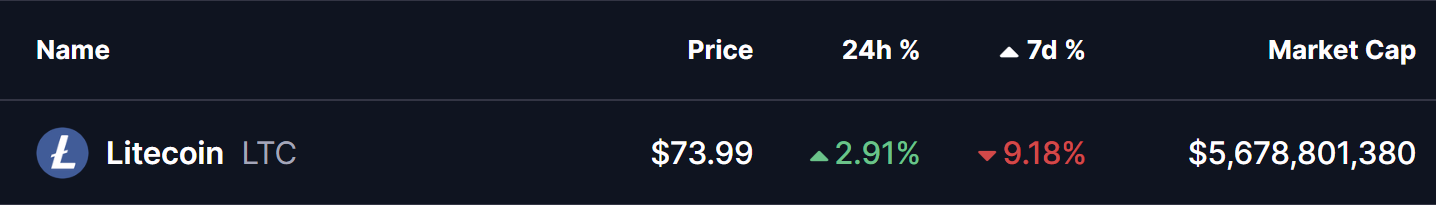
Source: Coinmarketcap
Litecoin (LTC) Sees Major Whale Accumulation
According to the latest insights from CryptoQuant, Litecoin is currently witnessing strong accumulation from whales. Data shows that large holders have been net buyers of LTC in the spot market since price dropped toward the $75 region.
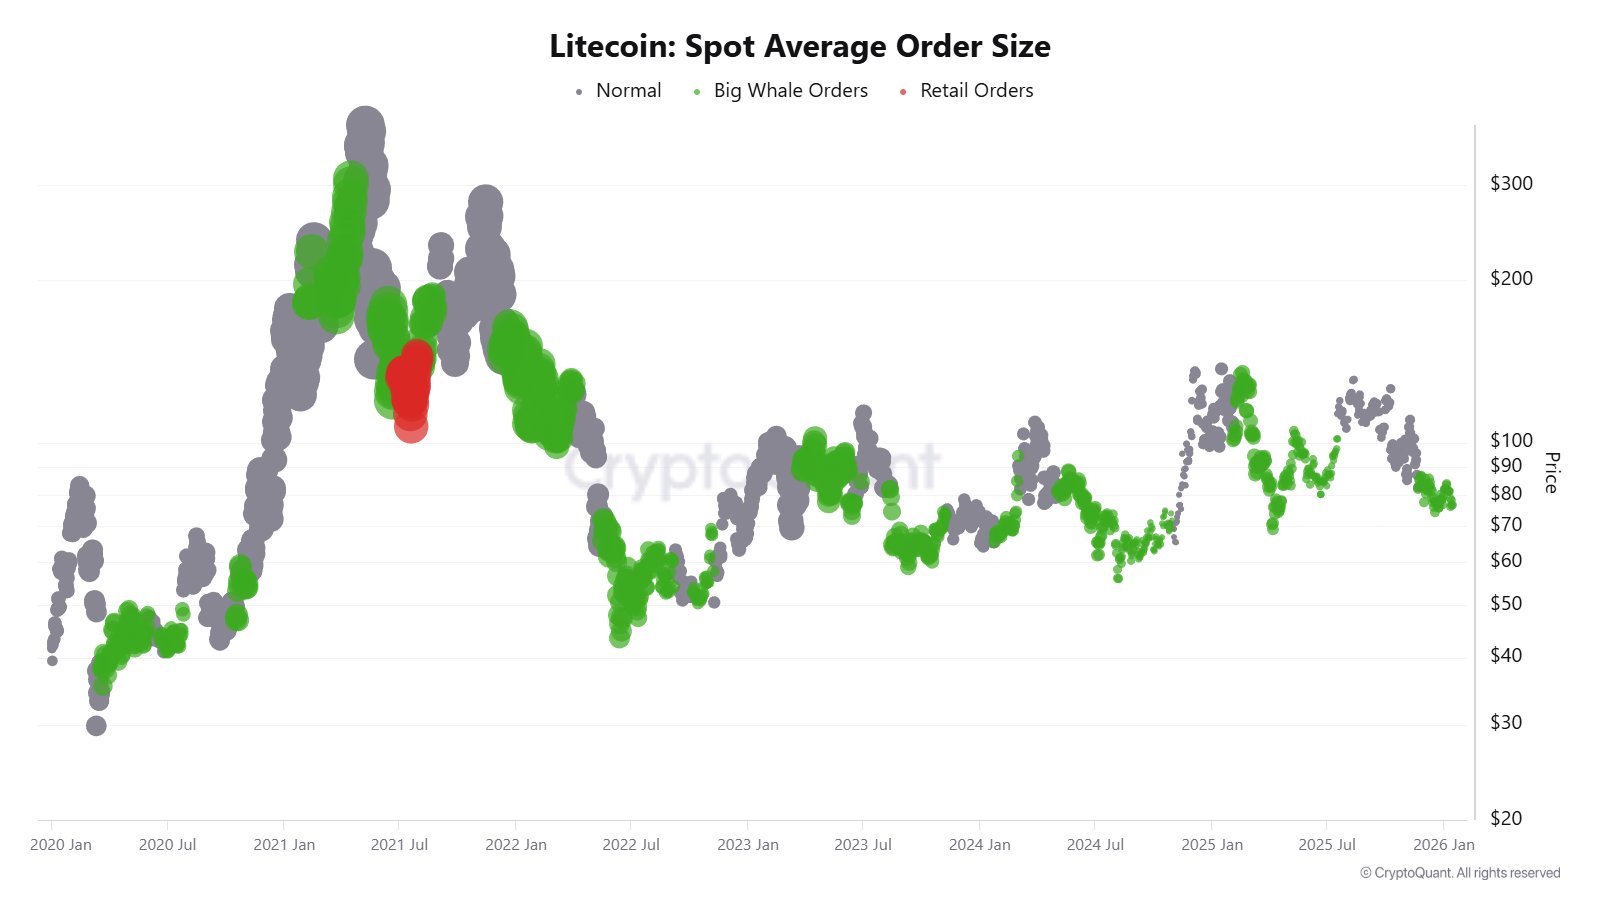
Litecoin Spot Buying By Whales/Source: @CW8900 (X)
At the same time, whale activity in the futures market also points to growing bullish conviction. Large traders have been steadily building long positions, suggesting expectations of higher prices ahead rather than hedging or short exposure. Historically, periods where whales accumulate during price weakness have often preceded notable trend reversals for Litecoin.
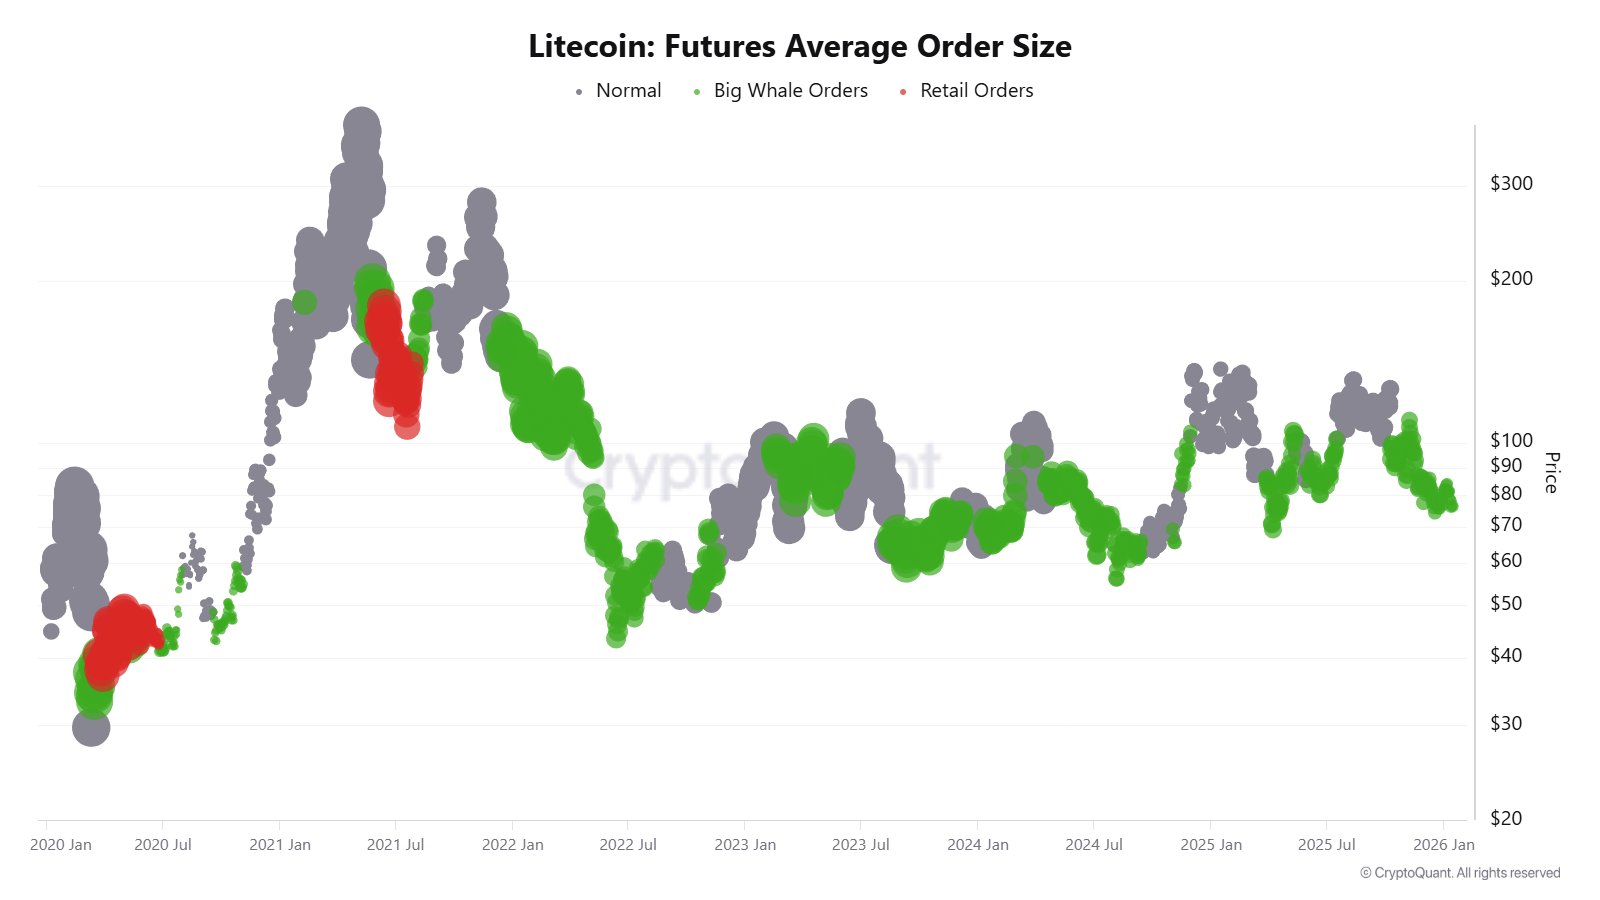
LTC Whale Buying in Futures/Source: @CW8900 (X)
This alignment between spot accumulation and futures positioning strengthens the bullish undertone despite recent price softness.
Is an Upside Breakout Brewing?
From a technical perspective, Litecoin’s daily chart is forming a potential right-angled descending broadening wedge pattern. This structure is defined by a flat to slightly rising resistance zone and a downward-sloping support trendline, often associated with volatility expansion and eventual directional moves.
The $81.16–$87.54 zone has acted as a strong neckline resistance, repeatedly capping upside attempts. On the downside, LTC recently revisited the lower boundary of the wedge near $69.46. Buyers stepped in decisively at this level, defending the trendline and triggering a rebound toward the $73–$74 area.
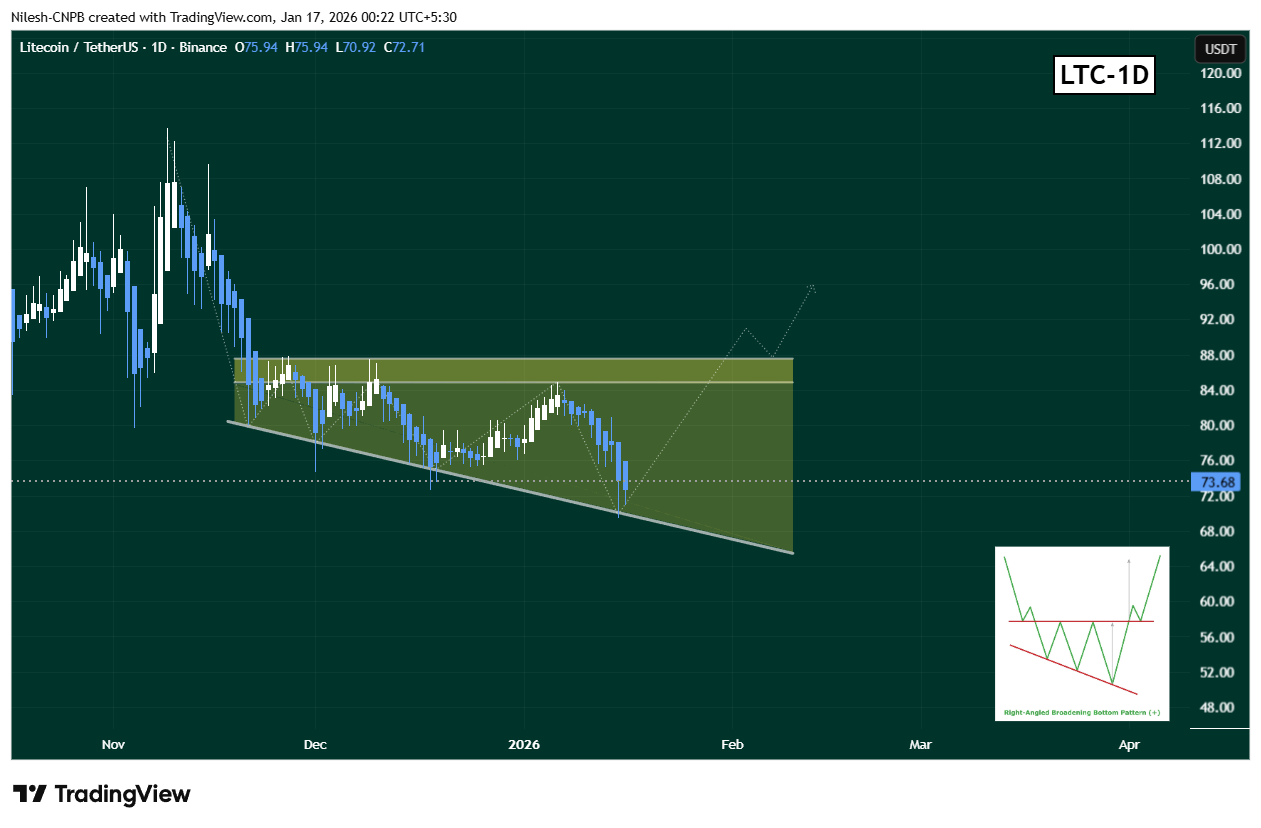
Litecoin (LTC) Daily Chart/Coinsprobe (Source: Tradingview)
This bounce from structural support, combined with rising whale accumulation, suggests that selling pressure may be weakening while larger players quietly position for a breakout attempt.
What’s Next for LTC?
If Litecoin continues to hold above the $69.46 support trendline, the probability of a renewed push toward the neckline resistance increases. A re-test of the $81.16–$87.54 zone appears likely if momentum builds.
A successful breakout and sustained hold above this resistance range could confirm the bullish wedge resolution and potentially open the door for a move toward the psychological $100 level and beyond.
On the flip side, a decisive breakdown below the $69.46 support would invalidate the current pattern and weaken the bullish outlook, potentially exposing LTC to deeper downside before a meaningful recovery attempt.
Bottom Line
While Litecoin has underperformed in the short term, the combination of heavy whale accumulation and a well-defined bullish chart structure suggests that the current dip may be more of an accumulation phase than a breakdown. If support continues to hold and buyers reclaim key resistance levels, LTC could be setting the stage for a sharp upside breakout in the weeks ahead.
Disclaimer: The views and analysis presented in this article are for informational purposes only and reflect the author’s perspective, not financial advice. Technical patterns and indicators discussed are subject to market volatility and may or may not yield the anticipated results. Investors are advised to exercise caution, conduct independent research, and make decisions aligned with their individual risk tolerance.
About Author: Nilesh Hembade is the Founder and Lead Author of Coinsprobe, with over 5 years of experience in the cryptocurrency and blockchain industry. Since launching Coinsprobe in 2023, he has been providing daily, research-driven insights through in-depth market analysis, on-chain data, and technical research.
Disclaimer: The information on this page may come from third parties and does not represent the views or opinions of Gate. The content displayed on this page is for reference only and does not constitute any financial, investment, or legal advice. Gate does not guarantee the accuracy or completeness of the information and shall not be liable for any losses arising from the use of this information. Virtual asset investments carry high risks and are subject to significant price volatility. You may lose all of your invested principal. Please fully understand the relevant risks and make prudent decisions based on your own financial situation and risk tolerance. For details, please refer to
Disclaimer.
Related Articles
Why Gold Price Is Falling Even With Global Tension Escalating?
The essay discusses the unexpected decline in gold prices due to a strong dollar driven by rising oil prices and inflation. As the Federal Reserve refrains from rate cuts, gold becomes less attractive compared to interest-bearing investments. This situation prompts investors to consider Bitcoin as a potential new digital gold, indicating a shift in traditional asset preferences amidst evolving market conditions.
CaptainAltcoin1h ago
Why Aksel Kibar Believes Bitcoin Price Is Trap and This 'Rising Wedge' Signals Deeper Drop - U.Today
Analyst Aksel Kibar warns Bitcoin investors that the current price recovery is a technical trap within a downtrend. He identifies a "rising wedge" pattern and predicts potential declines to $60,000 or lower, advising caution against misinterpreting short-term fluctuations.
UToday3h ago
US Bitcoin Spot ETF Attracts Inflows for Seven Consecutive Days, Institutional Funds Return
U.S. cryptocurrency spot ETFs have recently seen a warming in capital inflows, particularly ahead of the Federal Reserve's interest rate decision, as investor interest in digital assets has rebounded. Bitcoin and Ethereum spot ETFs have recorded net inflows for multiple consecutive days, with Bitcoin attracting $199.4 million in a single day, marking a record of seven consecutive days of inflows. This phenomenon reflects increased institutional capital allocation, with market structure showing that investors are increasingly inclined to invest through regulated products, strengthening market support.
区块客4h ago
Bitcoin and Stocks Need to Confirm First: The Real Altcoin Recovery Timeline
The current crypto market continues to struggle without a clear altseason, as Bitcoin remains in a sideways trend. Analysts suggest that until Bitcoin shows a confirmed bullish structure and macroeconomic conditions improve, altcoins will likely remain stagnant. Speculation points to potential recovery in Q3 to Q4 rather than the earlier hoped-for timeline.
CaptainAltcoin4h ago
Bitcoin Decouples From S&P 500 as Retail Demand Weakens
Bitcoin retail activity has decreased by 10%, the lowest since January 2025, indicating weaker market participation. The advent of ETFs has shifted retail access off-chain, while Bitcoin has diverged from the S&P 500, marking its longest decoupling since 2020 amid a correction phase.
CryptoFrontNews4h ago
