XRP has shifted back into focus after reclaiming key technical levels and showing renewed strength across momentum indicators. The latest breakout above the $2.30 macro resistance has flipped short-term structure bullish, and analysts now point to a potential continuation move if current support holds.
One of the clearer breakdowns comes from Tara, who shared a detailed 4-hour XRP chart outlining an impulsive wave structure now firmly in play.
- Tara’s XRP Chart Shows a Clean Impulse in Progress
- XRP Indicators: RSI Signals Strength, But Cooling Is Healthy
- Futures Market Activity Adds Confirmation
- Short-Term Outlook for XRP Price
Tara’s XRP Chart Shows a Clean Impulse in Progress
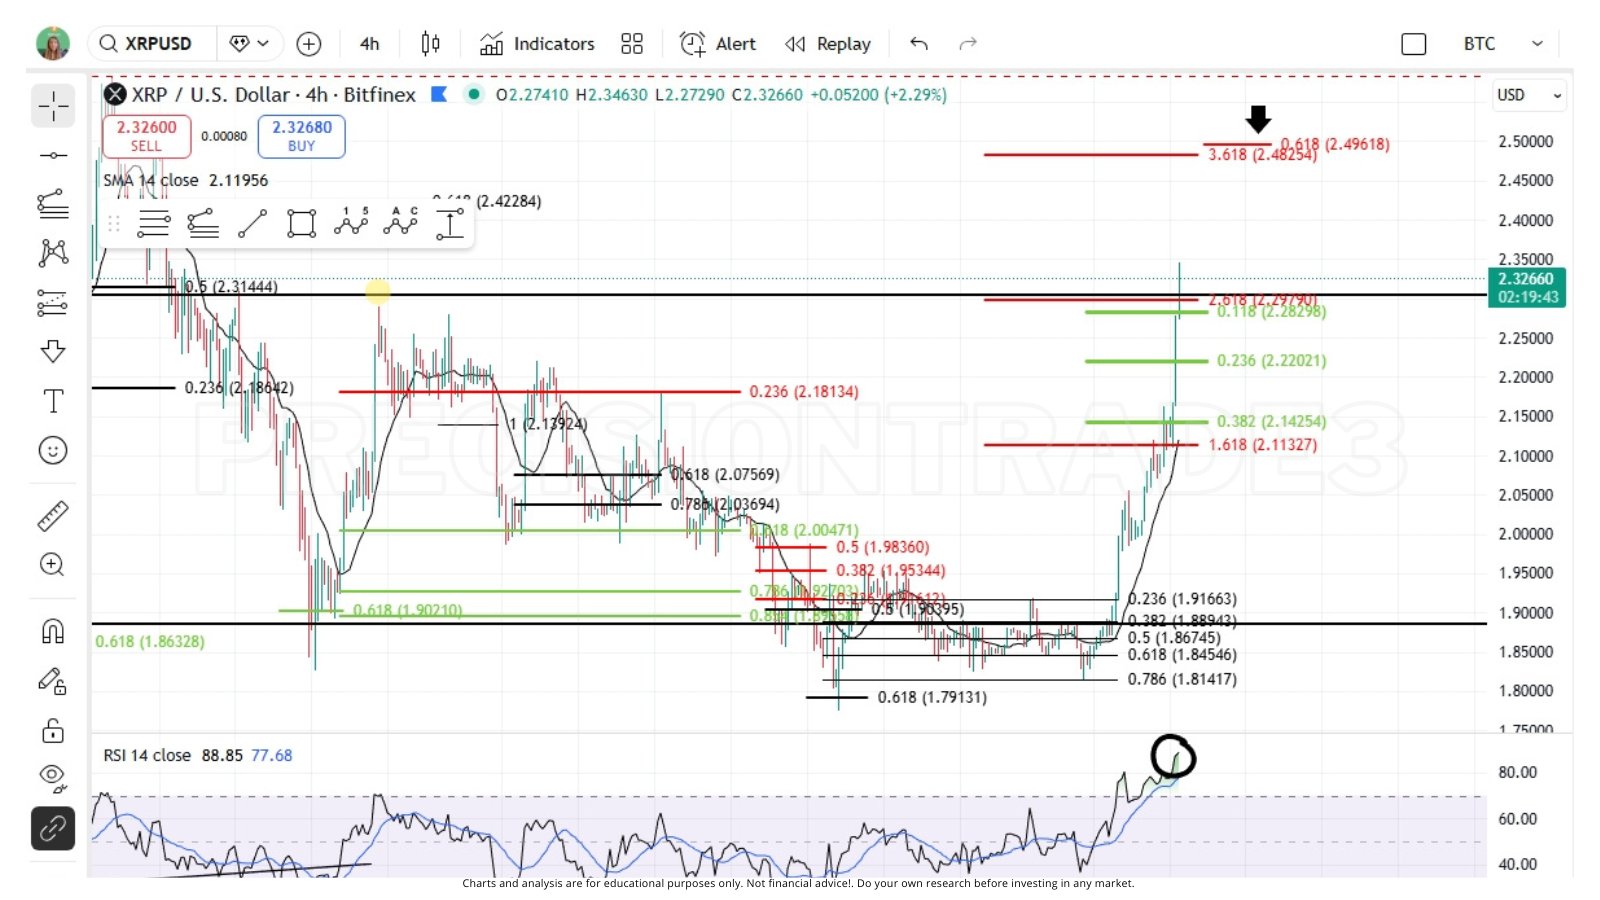
As per Tara’s analysis, the XRP price has completed a strong Wave 3 extension, pushing beyond the 2.618 Fibonacci level and decisively clearing the long-watched $2.30 resistance. This move did not occur in isolation. It was supported by expanding volume and a sharp acceleration in price, which typically confirms impulsive price behavior rather than a simple relief bounce.
On her chart, the breakout places XRP above the macro 0.236 Fibonacci retracement, a level that often acts as a dividing line between continuation and failure. As long as price remains above this zone, the broader bullish structure stays intact.
Source: X/@PrecisionTrade3
Tara highlights $2.49 as the next upside reference, aligning with a 0.618 extension for a potential fifth wave. However, she also flags the likelihood of a short-term pullback before that move fully develops.
XRP Indicators: RSI Signals Strength, But Cooling Is Healthy
Momentum indicators add context to the price action. XRP’s Relative Strength Index has pushed into elevated territory following the breakout, reflecting strong buying pressure. Historically, XRP tends to pause or retrace slightly after RSI spikes at this pace.
That does not invalidate the trend. Instead, Tara notes that a brief RSI cooldown would allow the next push higher to form with better structure. In other words, consolidation above support would strengthen the case for continuation rather than weaken it.
Short-term supports, marked in green on her chart, become critical here. Holding those levels would keep the impulsive count intact and support the idea that the market is preparing for another leg higher rather than rolling over.
Read also: Ripple Just Confirmed the XRPL 2026 Roadmap—and It’s Stacked
Futures Market Activity Adds Confirmation
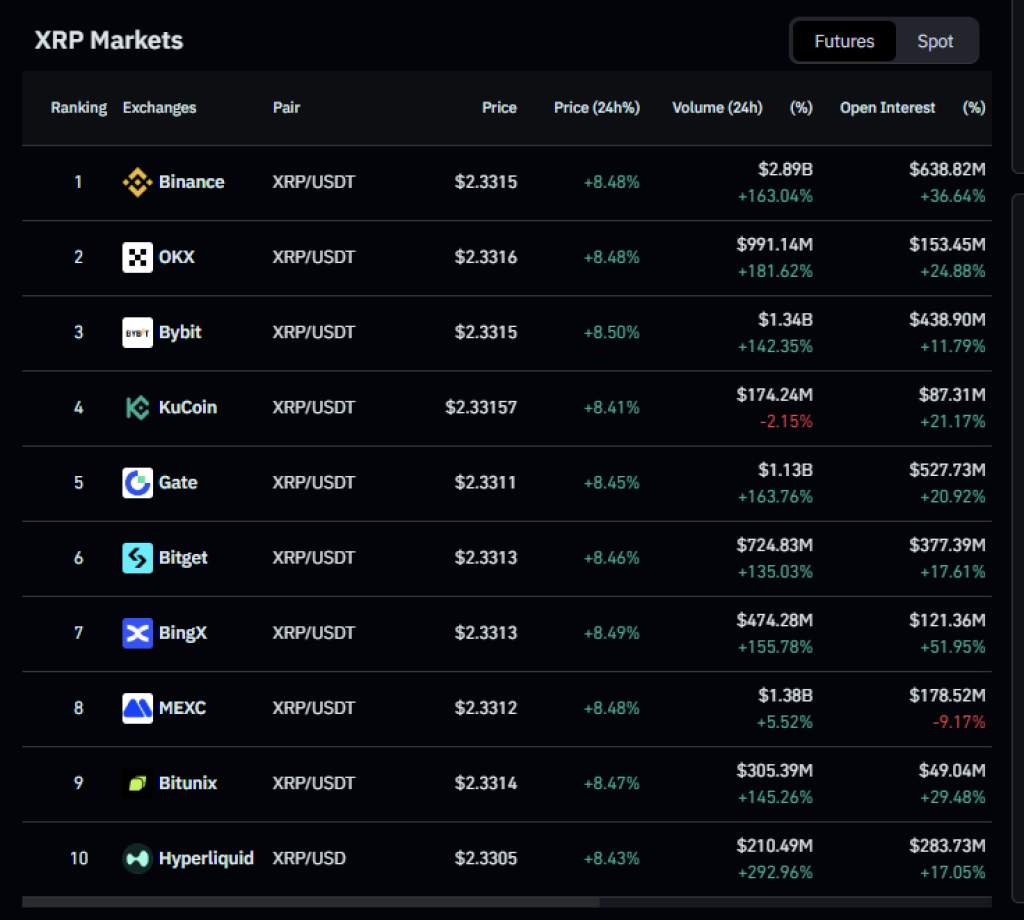
Beyond spot price action, derivatives data adds another layer to the picture. XRP futures open interest has risen 21%, reaching roughly $4.65 billion according to CoinGlass. This rebound follows a period of reduced exposure during December’s risk-off environment.
At the same time, perpetual funding rates sit near 0.0081%, which remains neutral. This balance matters. Rising open interest alongside neutral funding suggests traders are rebuilding positions without excessive leverage. In past cycles, XRP tops often formed when funding rates became aggressively positive, signaling overcrowded long trades. That condition is not present yet.
Source: coinglass.com/XRP
In the current setup, futures data supports the bullish trend without flashing the typical overheating warnings.
Short-Term Outlook for XRP Price
The main takeaway is that the XRP price is no longer reacting defensively. The reclaim of $2.30 shifts market psychology, and both technical structure and derivatives data point to sustained interest rather than a one-day spike.
A controlled pullback would not be a failure scenario. Instead, it would likely serve as a base for the next advance, provided price remains above the key Fibonacci supports Tara outlined. If that structure holds, the $2.49 zone becomes a realistic near-term objective.
For now, XRP bulls appear to have regained control. The next phase will be defined not by how fast price moves, but by how well it holds its newly reclaimed levels.
Disclaimer: The information on this page may come from third parties and does not represent the views or opinions of Gate. The content displayed on this page is for reference only and does not constitute any financial, investment, or legal advice. Gate does not guarantee the accuracy or completeness of the information and shall not be liable for any losses arising from the use of this information. Virtual asset investments carry high risks and are subject to significant price volatility. You may lose all of your invested principal. Please fully understand the relevant risks and make prudent decisions based on your own financial situation and risk tolerance. For details, please refer to
Disclaimer.
Related Articles
BTC surged to $74,000 before falling back below $69,000, with the total market capitalization evaporating approximately $110 billion.
This week, the cryptocurrency industry received positive news from Wall Street, but Bitcoin's price fell from $74,000 to $69,000, with a market cap evaporating approximately $110 billion. The strength of the US dollar and macroeconomic factors are putting pressure on risk assets. Short-term holders are taking profits, increasing selling pressure, but the US spot Bitcoin ETF recorded net inflows, indicating an improvement in the funding environment.
GateNews1h ago
Today, the cryptocurrency Fear & Greed Index dropped to 12, indicating the market is in extreme fear.
Gate News Report, March 7th, according to Alternative.me data, today the cryptocurrency fear and greed index dropped to 12, indicating the market is in a state of "extreme fear." Yesterday, the index was 18, also in the "extreme fear" zone.
GateNews2h ago
Kaspa Tops CoinMarketCap Community Sentiment With 90% Bullish Votes – Here’s Why
Kaspa’s price hasn’t had the best year. The coin is currently trading around $0.03, and on the yearly chart it’s still down roughly 60%. That kind of drop usually hurts sentiment in most crypto
CaptainAltcoin3h ago
Will XRP Hold $1.33 or Extend Toward $1.30 Before Rebound?
XRP is currently trading at $1.35, experiencing a 1.3% decline. Key support is at $1.34, while resistance is at $1.40. The price is testing around the Fibonacci levels of $1.33 and $1.30, crucial for potential upward movement or deeper decline.
CryptoNewsLand7h ago
Dogecoin Monthly Breakdown Pattern Reappears as Price Tests $0.0918
Dogecoin is currently trading at $0.09205 at a gain of 2.3, with support of above $0.08878.
As can be seen in the monthly chart, there are recurring breakdown areas that have been followed by significant expansions in price.
The short-term trading range is narrow and the immediate point o
CryptoNewsLand7h ago
Solana Nears $95 Resistance With $17B Volume Surge
Solana approaches a key resistance level near $95, with increased trading volume and open interest signaling active trader interest. The token is currently at $90.20, facing potential upward movement if it surpasses $95, but may test $85 if rejected.
CryptoFrontNews7h ago