
Date: Tue, Dec 30, 2025 | 01:45 PM GMT
The broader cryptocurrency market is showing modest strength, with both Bitcoin (BTC) and Ethereum (ETH) trading in the green. This steady performance among major assets has helped stabilize overall market sentiment, allowing select altcoins — including **Canton (CC) **— to develop constructive technical setups.
CC is standing out with an impressive 13% daily gain. More importantly, price action confirms a technically significant breakout, strengthening the case for further upside in the near term.
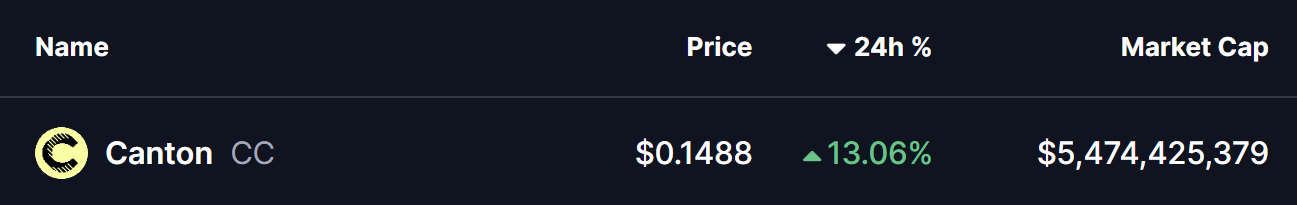
Source: Coinmarketcap
Rounding Bottom Breakout
On the daily chart, CC has confirmed a breakout from a classic rounding bottom pattern, a bullish reversal structure that typically signals a transition from accumulation to trend continuation.
This formation began taking shape in early November after price was rejected near the $0.1360 resistance level. That rejection triggered a prolonged decline, with CC eventually bottoming around $0.0586. From there, selling pressure gradually faded as buyers stepped in at higher levels, carving out a smooth, rounded base over several weeks.
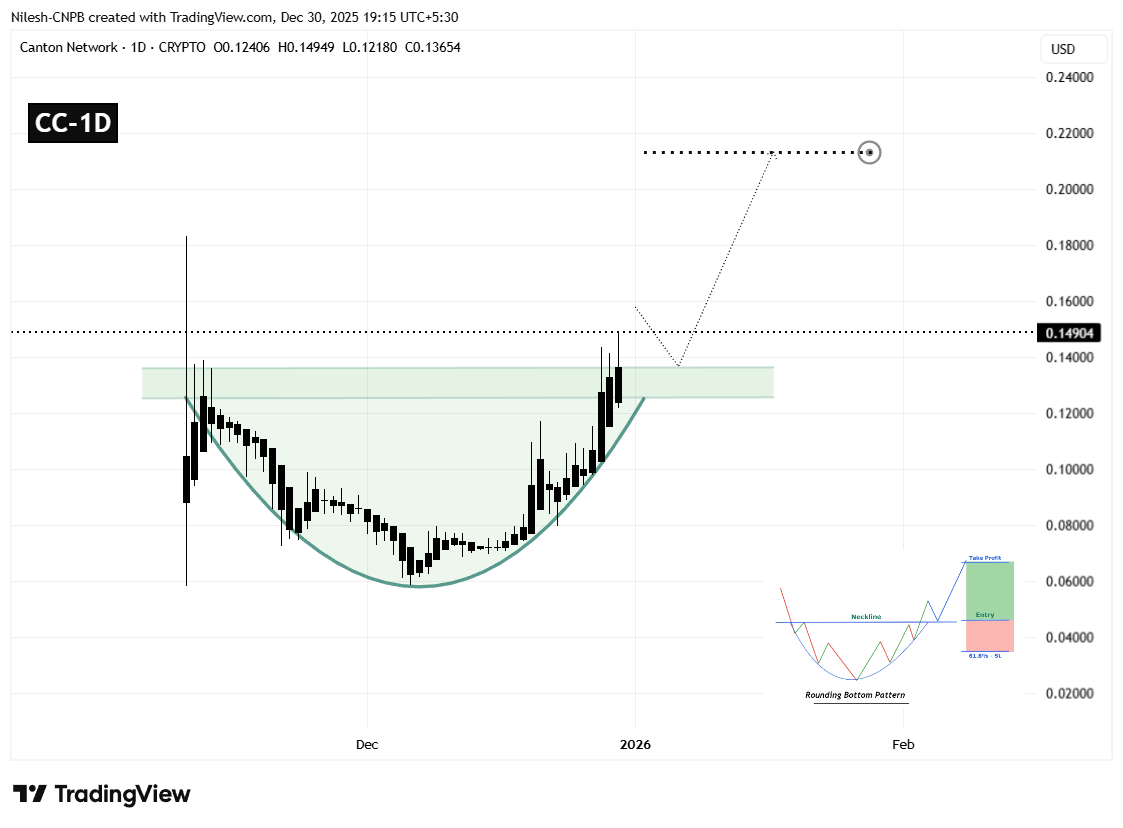
Canton (CC) Daily Chart/Coinsprobe (Source: Tradingview)
The structure completed once CC pushed decisively back above the $0.1360 neckline, confirming the breakout. This move marked a clear shift in market control from sellers to buyers, supported by expanding candles and improving momentum.
Price is now trading at $0.1490 comfortably above the breakout zone, signaling that bullish participants remain active and that the breakout has so far held without immediate rejection.
What’s Next for CC?
Following a breakout of this nature, a brief pullback toward the former resistance is often healthy. For CC, the $0.1250–$0.1360 region now acts as a critical support zone. A controlled retest of this area, followed by renewed buying interest, would further validate the bullish structure and reinforce confidence in continuation.
If this support holds, the rounding bottom’s measured move projects a potential upside target near the $0.2130 region. This represents roughly a 40%–45% advance from the breakout zone and aligns with the projected extension visible on the chart.
On the downside, failure to hold above the neckline could slow momentum and trigger a period of consolidation. A sustained drop back below the breakout level would weaken the bullish outlook and delay any upside continuation. However, as long as CC remains above reclaimed support, the technical structure favors higher prices in the sessions ahead.
For now, the breakout remains intact, and CC appears well-positioned to extend its recovery move if broader market conditions remain supportive.
Disclaimer: The views and analysis presented in this article are for informational purposes only and reflect the author’s perspective, not financial advice. Technical patterns and indicators discussed are subject to market volatility and may or may not yield the anticipated results. Investors are advised to exercise caution, conduct independent research, and make decisions aligned with their individual risk tolerance.
About Author: Nilesh Hembade is the Founder and Lead Author of Coinsprobe, with over 5 years of experience in the cryptocurrency and blockchain industry. Since launching Coinsprobe in 2023, he has been providing daily, research-driven insights through in-depth market analysis, on-chain data, and technical research.

Disclaimer: The information on this page may come from third parties and does not represent the views or opinions of Gate. The content displayed on this page is for reference only and does not constitute any financial, investment, or legal advice. Gate does not guarantee the accuracy or completeness of the information and shall not be liable for any losses arising from the use of this information. Virtual asset investments carry high risks and are subject to significant price volatility. You may lose all of your invested principal. Please fully understand the relevant risks and make prudent decisions based on your own financial situation and risk tolerance. For details, please refer to
Disclaimer.
Related Articles
Nasdaq 100 Sends Rare Signal: 100 Days Below Highs, History Shows Potential 17% Rise in a Year
The NASDAQ-100 has declined by 6.6% since 2023, not reaching its historical high for 100 consecutive trading days, but historical data indicates that a mid-term recovery window is approaching. Institutional inflows have increased, particularly with pensions significantly increasing their stock holdings, providing support to the market. Despite facing macroeconomic uncertainty, conditions for a rebound are gradually accumulating.
GateNews3m ago
XRP's key support level of $1.36 is a watershed: can it rebound by 11% or will it continue to decline?
XRP is currently fluctuating around $1.36, forming a structure of "continuously lower highs," with market sentiment being cautious. The stop-loss behavior of short-term holders has led to weak rebounds, and giant whales reducing their holdings further suppresses market confidence. Although there are bullish divergence signals from a technical perspective, the short-term trend still needs to focus on the support level of $1.36; if it breaks below, a continuation of the adjustment may occur.
GateNews6m ago
Hyperliquid Hits $48B on Oil Trades — Signs of a Crypto Reset?
Hyperliquid leads with $48B oil trades, attracting traders and boosting perpetual DEX volume.
HYPE price rises 30%, diverging from other altcoins amid aggressive leveraged positions.
Large long positions and oil momentum may signal a broader crypto market reset.
Hyperliquid’s HYPE
CryptoNewsLand8m ago
BIT Report: Bitcoin Liquidity Signals Missing, Short-Term High Probability Range Consolidation
According to the BIT on Target report, Bitcoin should be understood from the perspective of liquidity and capital flows. At present, market sentiment is cautious, trading activity and fund flows are unclear, and in the short term it may remain range-bound with fluctuations, but there are still structural opportunities.
GateNews8m ago
The $93 Floor: Why SOL’s Latest Breakout Could Trigger a Massive Short Squeeze
Solana’s SOL token jumped past a key technical resistance level at about $93, turning what analysts called a “39-day distribution zone” into a structural floor.
The move has brought two price targets into focus, one being an initial level near $103 and a secondary one near $113.
Breakout
CryptoPotato1h ago
