
Date: Tue, Dec 30, 2025 | 01:45 PM GMT
The broader cryptocurrency market is showing modest strength, with both Bitcoin (BTC) and Ethereum (ETH) trading in the green. This steady performance among major assets has helped stabilize overall market sentiment, allowing select altcoins — including **Canton (CC) **— to develop constructive technical setups.
CC is standing out with an impressive 13% daily gain. More importantly, price action confirms a technically significant breakout, strengthening the case for further upside in the near term.
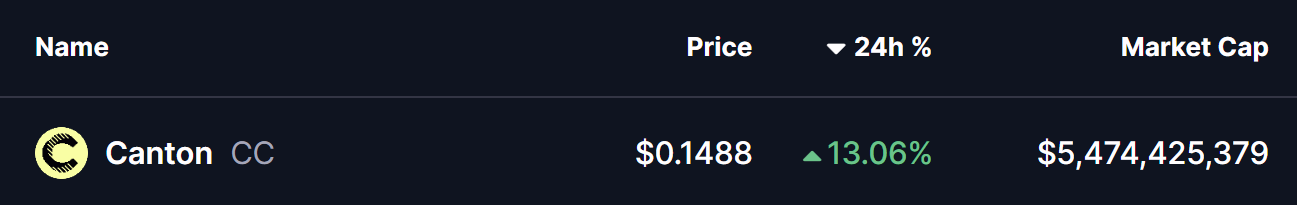
Source: Coinmarketcap
Rounding Bottom Breakout
On the daily chart, CC has confirmed a breakout from a classic rounding bottom pattern, a bullish reversal structure that typically signals a transition from accumulation to trend continuation.
This formation began taking shape in early November after price was rejected near the $0.1360 resistance level. That rejection triggered a prolonged decline, with CC eventually bottoming around $0.0586. From there, selling pressure gradually faded as buyers stepped in at higher levels, carving out a smooth, rounded base over several weeks.
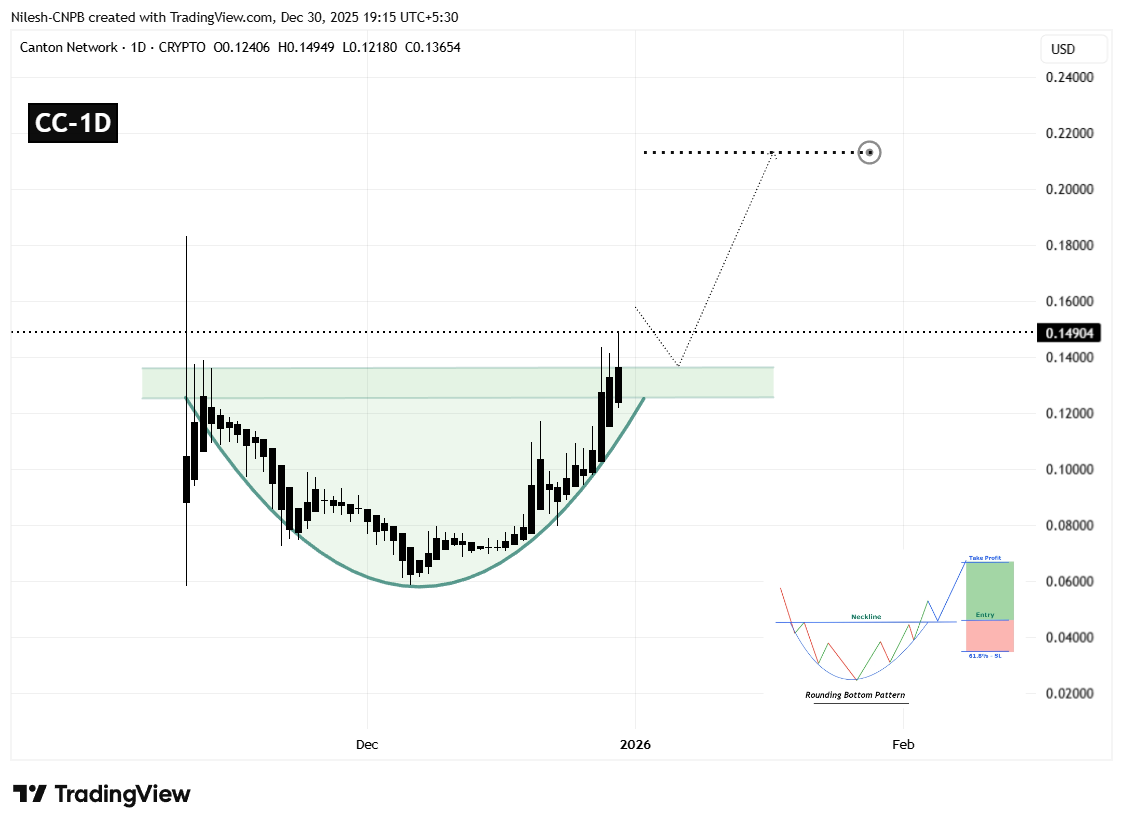
Canton (CC) Daily Chart/Coinsprobe (Source: Tradingview)
The structure completed once CC pushed decisively back above the $0.1360 neckline, confirming the breakout. This move marked a clear shift in market control from sellers to buyers, supported by expanding candles and improving momentum.
Price is now trading at $0.1490 comfortably above the breakout zone, signaling that bullish participants remain active and that the breakout has so far held without immediate rejection.
What’s Next for CC?
Following a breakout of this nature, a brief pullback toward the former resistance is often healthy. For CC, the $0.1250–$0.1360 region now acts as a critical support zone. A controlled retest of this area, followed by renewed buying interest, would further validate the bullish structure and reinforce confidence in continuation.
If this support holds, the rounding bottom’s measured move projects a potential upside target near the $0.2130 region. This represents roughly a 40%–45% advance from the breakout zone and aligns with the projected extension visible on the chart.
On the downside, failure to hold above the neckline could slow momentum and trigger a period of consolidation. A sustained drop back below the breakout level would weaken the bullish outlook and delay any upside continuation. However, as long as CC remains above reclaimed support, the technical structure favors higher prices in the sessions ahead.
For now, the breakout remains intact, and CC appears well-positioned to extend its recovery move if broader market conditions remain supportive.
Disclaimer: The views and analysis presented in this article are for informational purposes only and reflect the author’s perspective, not financial advice. Technical patterns and indicators discussed are subject to market volatility and may or may not yield the anticipated results. Investors are advised to exercise caution, conduct independent research, and make decisions aligned with their individual risk tolerance.
About Author: Nilesh Hembade is the Founder and Lead Author of Coinsprobe, with over 5 years of experience in the cryptocurrency and blockchain industry. Since launching Coinsprobe in 2023, he has been providing daily, research-driven insights through in-depth market analysis, on-chain data, and technical research.

Disclaimer: The information on this page may come from third parties and does not represent the views or opinions of Gate. The content displayed on this page is for reference only and does not constitute any financial, investment, or legal advice. Gate does not guarantee the accuracy or completeness of the information and shall not be liable for any losses arising from the use of this information. Virtual asset investments carry high risks and are subject to significant price volatility. You may lose all of your invested principal. Please fully understand the relevant risks and make prudent decisions based on your own financial situation and risk tolerance. For details, please refer to
Disclaimer.
Related Articles
ETH up 0.95% in 15 minutes: Whale transfers and short liquidations resonate to push prices higher
Between 2026-03-23 12:30 and 12:45 (UTC), ETH recorded a +0.95% return rate, with a price range of 2120.7–2147.02 USDT and a volatility amplitude of 1.24%. During this period, market attention increased significantly, with intensified capital flows and volatility, and increased short-term trading activity.
The primary drivers of this price movement were large on-chain transfers and position structure adjustments in the derivatives market. Whales collectively transferred 30,354 ETH into new wallets, causing changes to market liquidity structure, which drove spot trading and expected volatility upward. Meanwhile, perpetual futures funding
GateNews48m ago
Goldman Sachs has Raised Average Price Forecast for Brent Crude, Crypto Prices to be Affected?
Goldman Sachs has raised Brent Crude oil's 2026 price forecast to $85 per barrel, signaling potential inflation impacts on the crypto market, where prices have recently recovered amidst ongoing uncertainty influenced by geopolitical tensions.
TheNewsCrypto1h ago
US-Iran Tensions Ease? Trump Claims "Negotiations Bearing Fruit," Bitcoin Surges Past $71,000 Mark
As geopolitical tensions in the Middle East cool down, Bitcoin price has rebounded and broken through $70,000, primarily due to U.S. President Trump's statement that U.S.-Iran negotiations have made "productive" progress. Market risk-aversion sentiment has decreased and capital has returned to the market, providing cryptocurrency investors with some breathing room. However, experts remind investors to remain vigilant about subsequent developments in the situation.
動區BlockTempo1h ago
Bitcoin risks 50% drop as BTC’s positive correlation with US stocks grows
Bitcoin (BTC) erased much of its US-Iran war-driven gains this week, moving back in sync with the broader downtrend in risk assets, mainly US equities.
Key takeaways:
Bitcoin’s positive flip in S&P 500 correlation has historically preceded average declines of around 50% since 2018.
BTC
Cointelegraph2h ago
