Trade
Basic
Futures
Futures
Hundreds of contracts settled in USDT or BTC
TradFi
Gold
Trade global traditional assets with USDT in one place
Options
Hot
Trade European-style vanilla options
Unified Account
Maximize your capital efficiency
Demo Trading
Futures Kickoff
Get prepared for your futures trading
Futures Events
Participate in events to win generous rewards
Demo Trading
Use virtual funds to experience risk-free trading
Earn
Launch
CandyDrop
Collect candies to earn airdrops
Launchpool
Quick staking, earn potential new tokens
HODLer Airdrop
Hold GT and get massive airdrops for free
Launchpad
Be early to the next big token project
Alpha Points
Trade on-chain assets and enjoy airdrop rewards!
Futures Points
Earn futures points and claim airdrop rewards
Investment
Simple Earn
Earn interests with idle tokens
Auto-Invest
Auto-invest on a regular basis
Dual Investment
Buy low and sell high to take profits from price fluctuations
Soft Staking
Earn rewards with flexible staking
Crypto Loan
0 Fees
Pledge one crypto to borrow another
Lending Center
One-stop lending hub
VIP Wealth Hub
Customized wealth management empowers your assets growth
Private Wealth Management
Customized asset management to grow your digital assets
Quant Fund
Top asset management team helps you profit without hassle
Staking
Stake cryptos to earn in PoS products
Smart Leverage
New
No forced liquidation before maturity, worry-free leveraged gains
GUSD Minting
Use USDT/USDC to mint GUSD for treasury-level yields
More
EqunixHub
Rize N Shine
EqunixHub
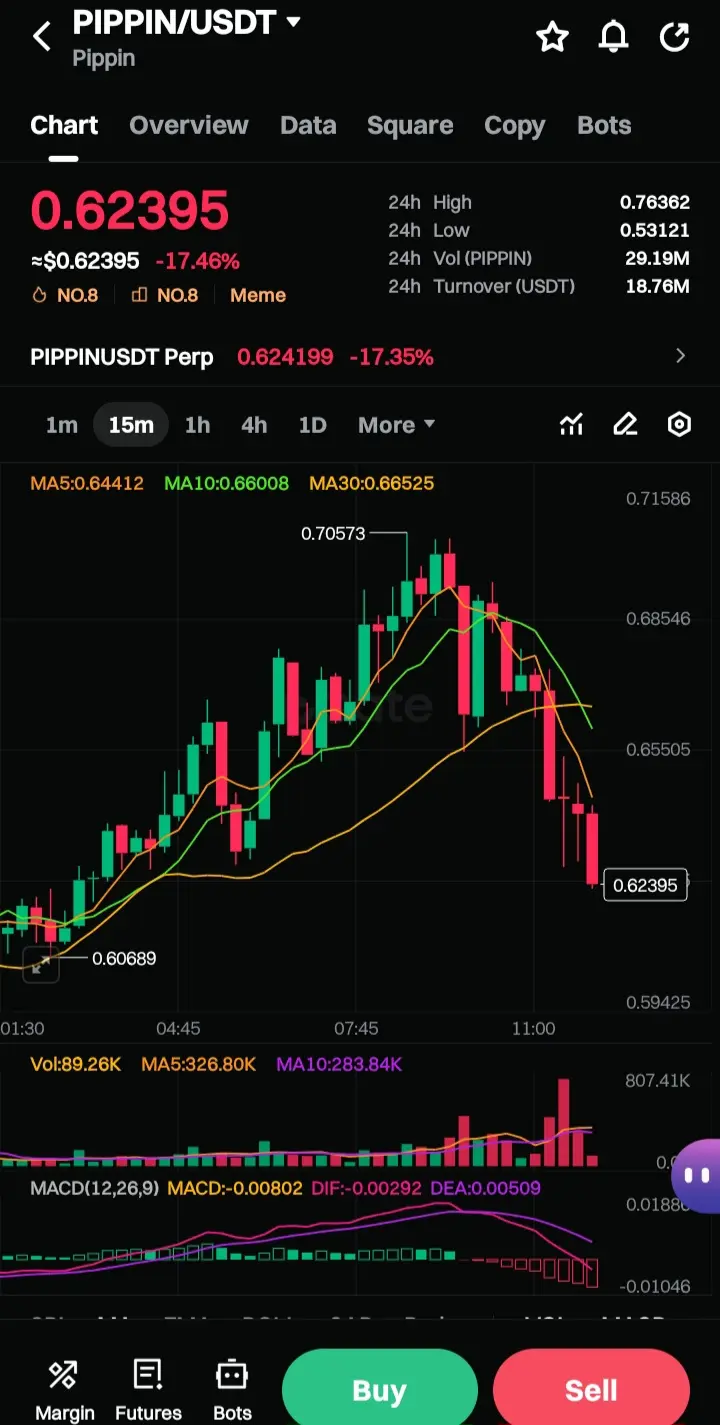
$PIPPIN
shows strong bearish momentum after rejecting near 0.7057. Price has dropped sharply to 0.6239, down over 17%, with multiple large red candles confirming aggressive selling. It is trading well below MA5, MA10, and MA30, indicating short-term trend reversal to the downside. Volume increased during the selloff, supporting bearish continuation. MACD is negative with expanding red histogram bars, signaling sustained downward pressure. Immediate support sits around 0.6000–0.5940. If this zone breaks, further decline is possible. Any recovery may face resistance near 0.6550–0.6650. Overa
shows strong bearish momentum after rejecting near 0.7057. Price has dropped sharply to 0.6239, down over 17%, with multiple large red candles confirming aggressive selling. It is trading well below MA5, MA10, and MA30, indicating short-term trend reversal to the downside. Volume increased during the selloff, supporting bearish continuation. MACD is negative with expanding red histogram bars, signaling sustained downward pressure. Immediate support sits around 0.6000–0.5940. If this zone breaks, further decline is possible. Any recovery may face resistance near 0.6550–0.6650. Overa
PIPPIN-16.7%
- Reward
- 1
- Comment
- Repost
- Share
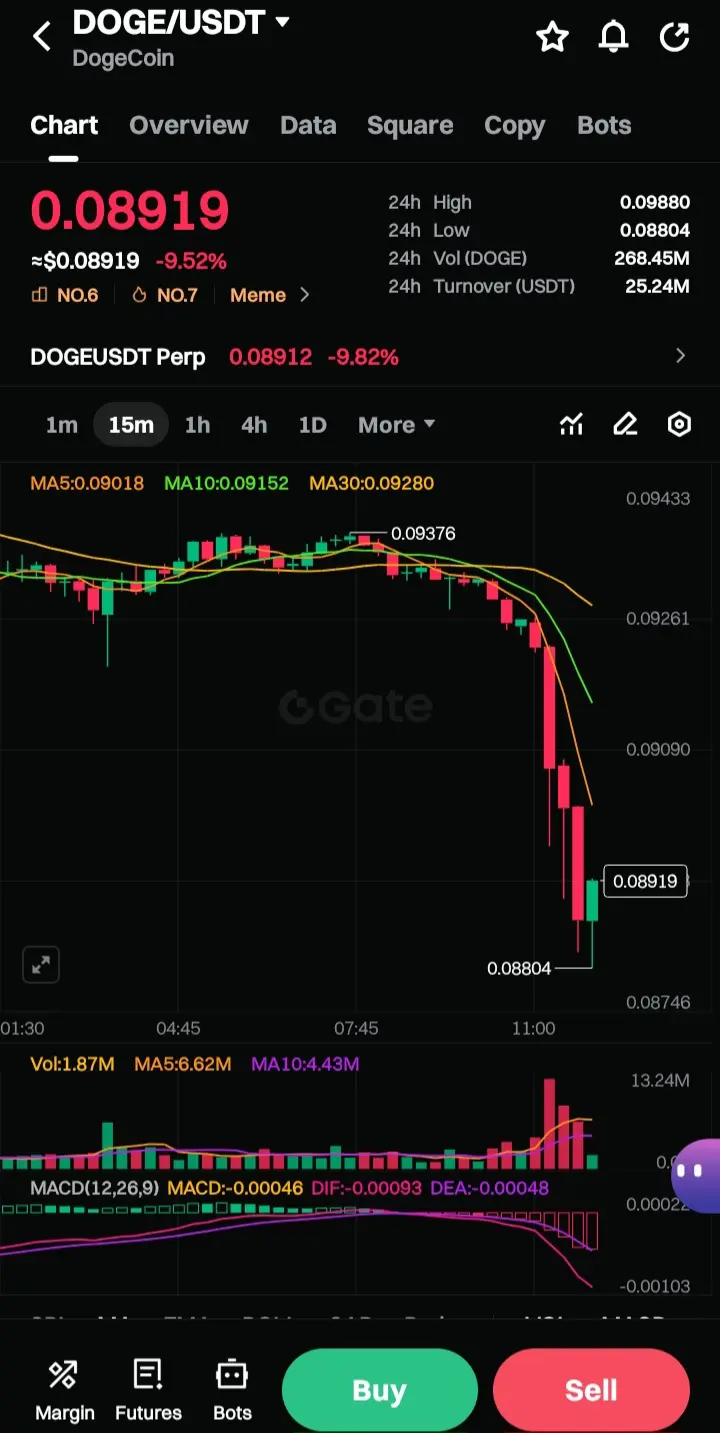
$DOGE
🟢DOGE is trading around 0.08919 after a sharp intraday drop of nearly 9–10%.
Price has broken below MA5, MA10, and MA30, showing strong short-term bearish momentum.
🟢The recent cascade of large red candles with rising volume confirms aggressive selling pressure.
👍MACD remains in negative territory with widening histogram, signaling continuation risk to the downside.
Immediate💥 support sits near 0.0880–0.0875. If this level fails, further downside could extend toward 0.0850.
🟢 Any bounce may face resistance around 0.0915–0.0925 where moving averages cluster. Overall bias remai
DOGE-9.54%
- Reward
- 2
- Comment
- Repost
- Share
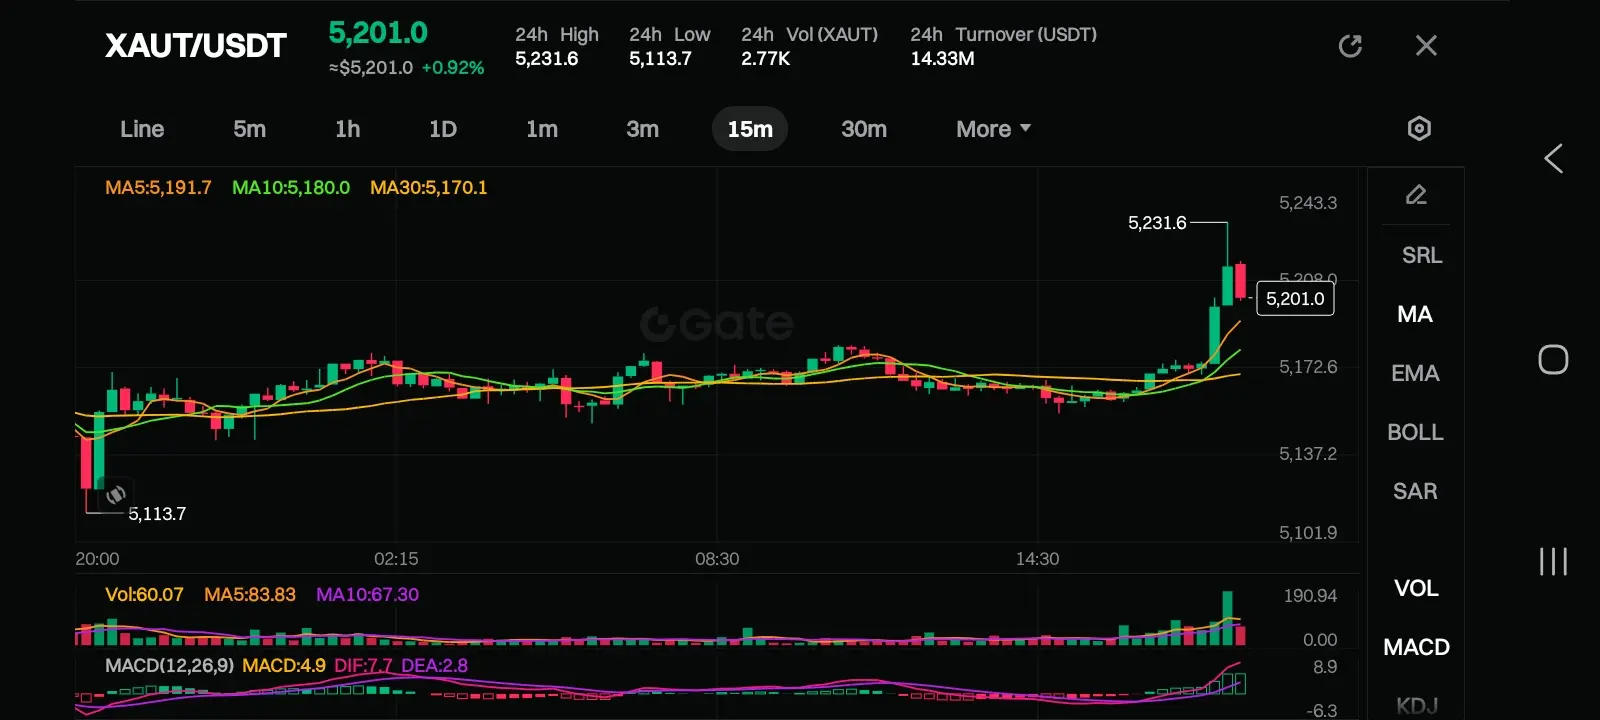
#CelebratingNewYearOnGateSquare 15-minute chart XAUT/USDT (Tether Gold), here is a technical analysis of the recent price action:
1. Recent Price Action & Trend
Sudden Breakout: Following a long period of sideways consolidation (ranging between roughly 5,140 and 5,180), the price experienced a significant, sharp spike upward.
Current Price: The price broke above the resistance level and peaked near 5,231.6 before pulling back slightly to the current level of 5,201.0.
Trend: The immediate short-term trend is strongly bullish, reversing the previous neutral/sideways sentiment.
2. Moving Av
XAUT2.61%
- Reward
- 1
- 1
- Repost
- Share
CryptoLens:
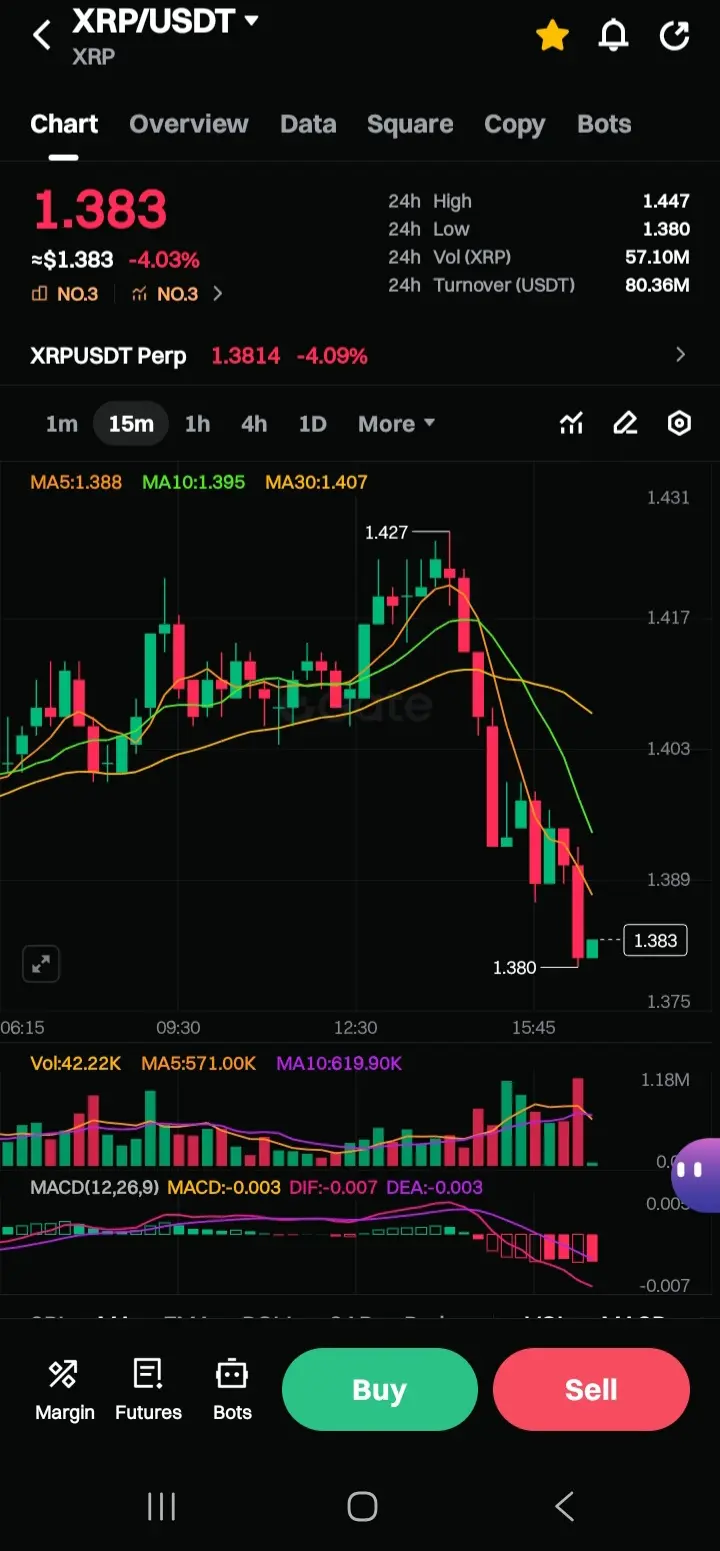
within 24 hours we can expect some long wiksBoth ETC and XRP are facing heavy selling pressure on the 15m timeframe 📉. ETC plummeted from 9.076 to 8.767, a 1.80% drop, and is struggling to hold the 8.747 support level. Similarly, XRP took a hard hit, falling 4.03% to 1.383 after peaking at 1.427.
For both assets, prices are trapped below all major Moving Averages (MA5, MA10, MA30), while the MACD shows deepening red histograms, confirming strong bearish momentum 🚩. With the charts currently "bleeding," traders should watch for a stabilization phase rather than jumping into these falling knives ⚠️.
$XRP
XRP-7.66%
- Reward
- 4
- 5
- Repost
- Share
NoTime :
:
Join Gate's Coin Quest to win exciting rewards. Don't miss the opportunity, participate now at: https://www.gate.com/activities/answer-earn/?ch=CoinQuestBORA&refUid=14376382View More
$ETC
The ETC/USDT 15m chart shows a sharp bearish drop 📉. After hitting a high of 9.076, price plummeted below all major Moving Averages (MA5, MA10, MA30), signaling strong downward momentum.
Key metrics:
Price: 8.767 (-1.80%)
Support: Testing the 8.747 level; a break here could lead to further bleeding 🩸
MACD: Deeply negative (-0.030) with expanding red bars, suggesting sellers are still in control
Expect high volatility. Entering now is risky as the "falling knife" hasn't stabilized yet ⚠️.
ETC-8.17%
- Reward
- 1
- Comment
- Repost
- Share
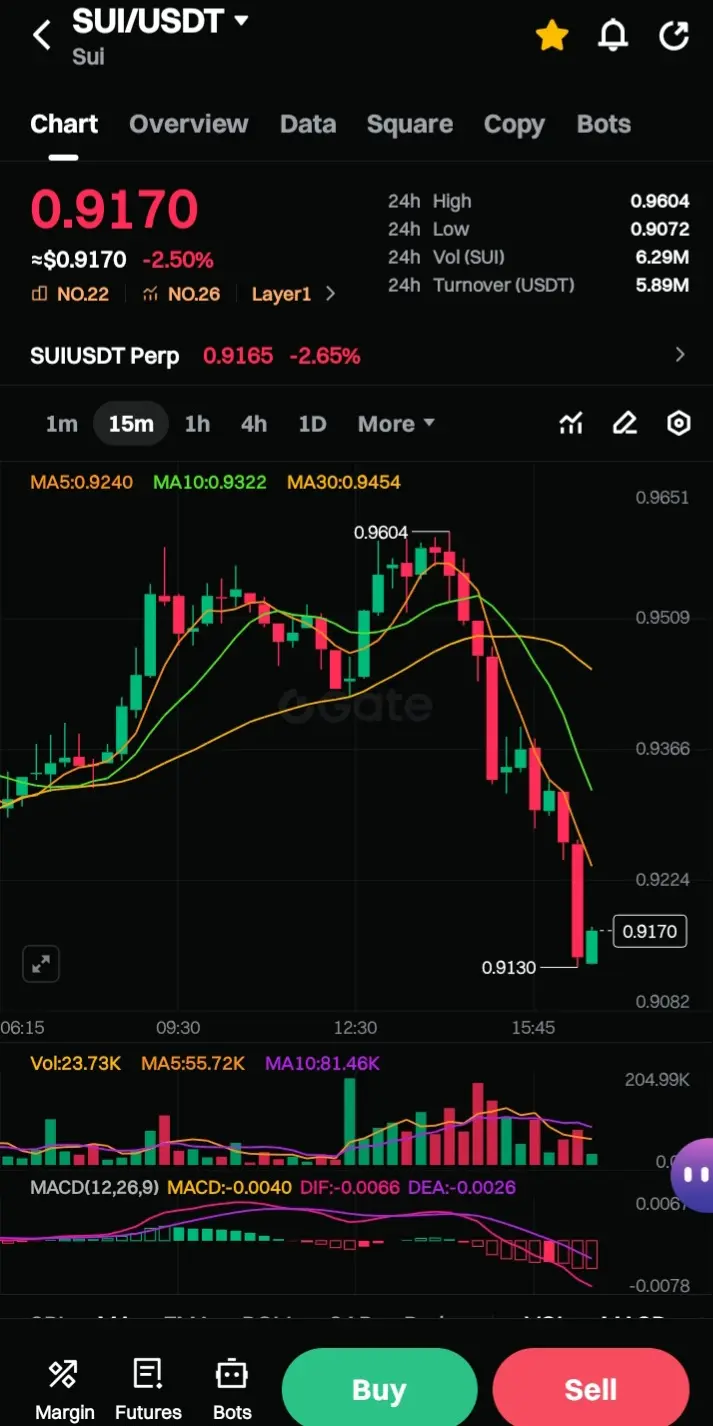
$SUI
the current momentum is strongly bearish. Here is a quick breakdown of what the technicals are showing:
🔴Price Action: SUI has experienced a sharp drop from its recent high of 0.9604, currently sitting at 0.9170 (down 2.50%).
Moving Averages: The price is trading well below the MA5, MA10, and MA30. The "Death Cross" (shorter MAs crossing below the longer ones) confirms a downward trend.
MACD: The MACD lines are widening in a downward slope, and the histogram bars are getting longer and redder. This suggests that the selling pressure hasn't bottomed out yet.
Key Levels
Immediat
SUI-10.51%
- Reward
- 1
- Comment
- Repost
- Share
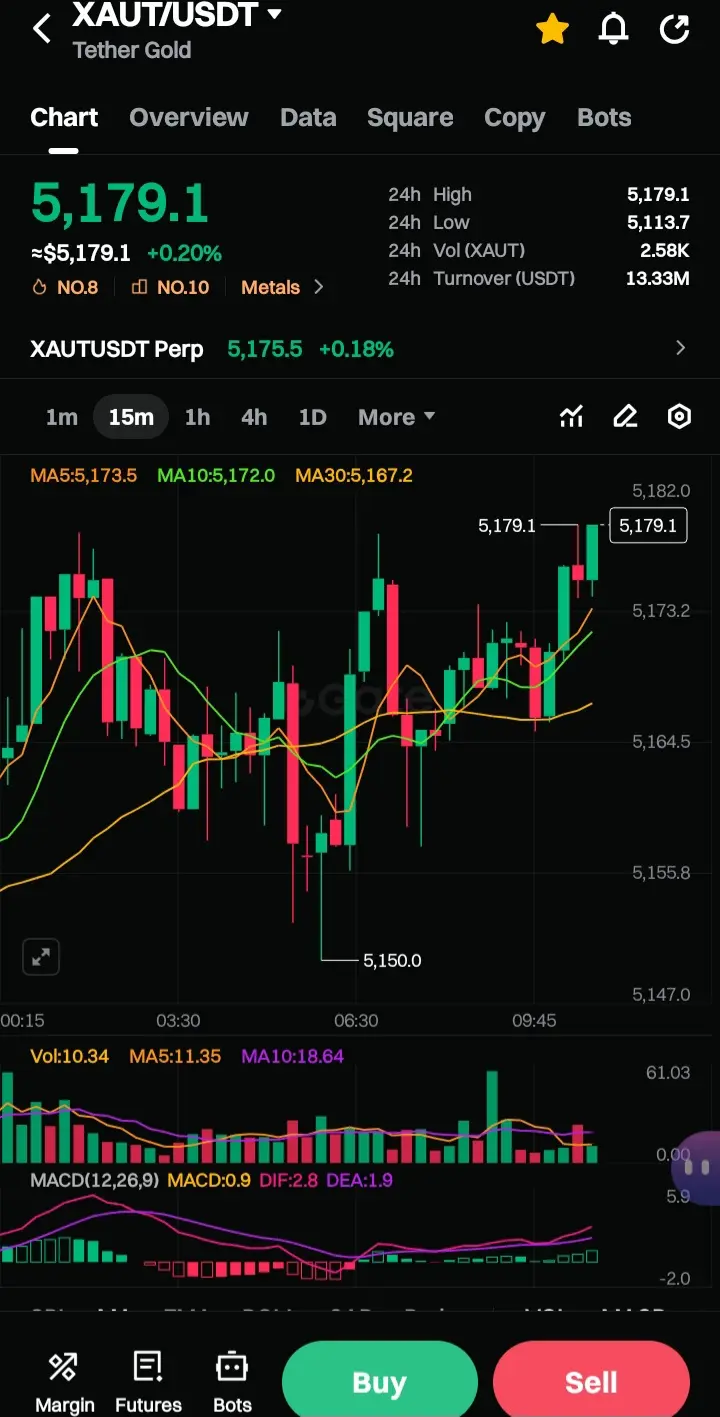
XAUT/USDT
$XAUT
Price: $5,179.1 (+0.20%) | At 24h High
Pattern
Sharp drop to 5,150 support mid-session → strong bounce/recovery
Current candles at highs with small bodies = slight indecision at resistance
Indicators
MA5 > MA10 > MA30 — all aligned bullish ✅
MACD: DIF (2.8) > DEA (1.9), histogram positive = bullish momentum
Bias
Bullish — but trading at 24h highs. Watch for consolidation or pullback to 5,167–5,173 before next leg up. Break above 5,182 opens further upside.
XAUT2.61%
- Reward
- 1
- Comment
- Repost
- Share
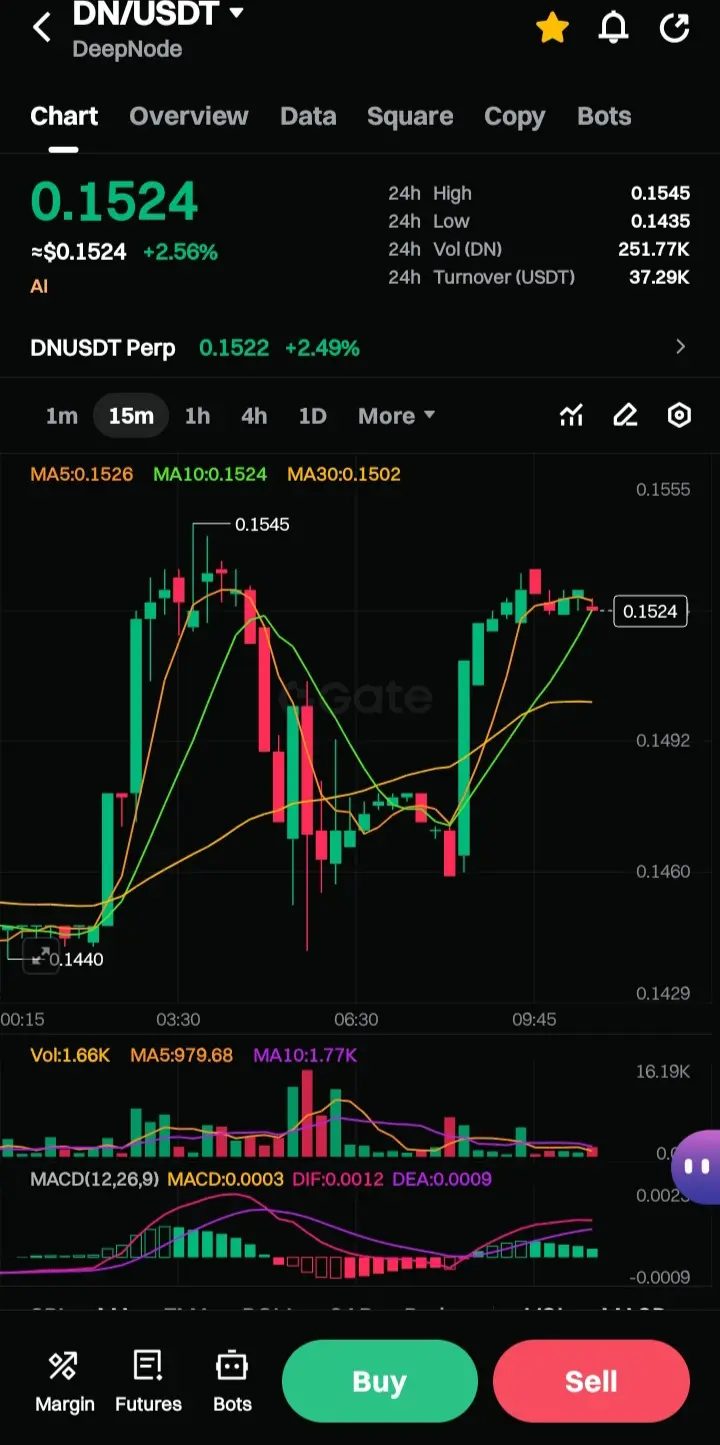
$DN 3 long green candlestics making bullish momentum.
Current Price Action
Price: $0.1524 (+2.56% 24h)
Timeframe: 15-minute candles
Range: 0.1435 – 0.1545
Candlestick Patterns Observed
Left Side (00:15 – 06:30) — Bullish Push then Reversal
Strong green marubozu candles early on → aggressive buying
Price hit 0.1545 resistance with a shooting star/doji top → rejection signal
Follow-through red candles confirmed bearish reversal
Mid Section (06:30 – 09:00) — Downtrend
Series of bearish engulfing candles
Wicks on top = sellers in control
Price dropped to 0.1440 support
Right Side (09:00 – 09:45
DN-10.72%
- Reward
- 1
- Comment
- Repost
- Share
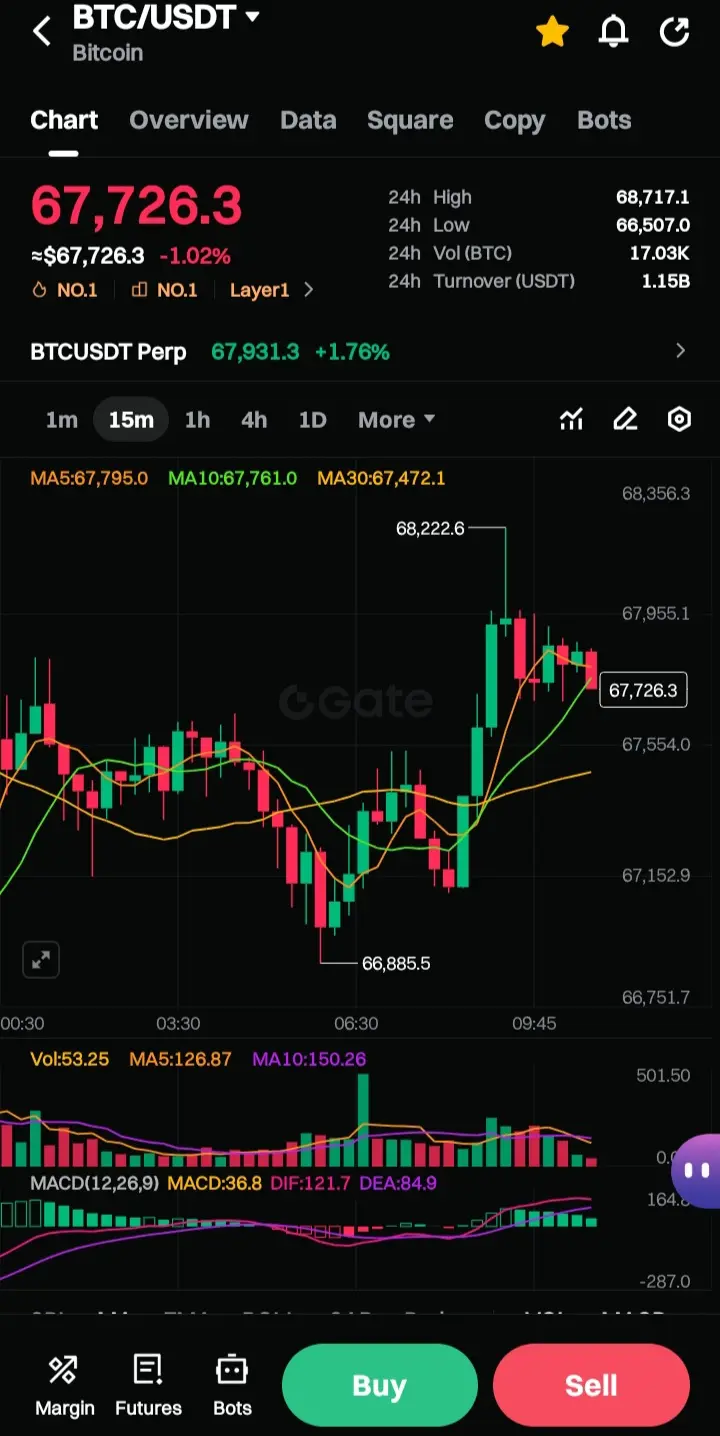
BTC/USDT –
$BTC
• Trend: Short-term bullish impulse ke baad consolidation chal rahi hai (68.2k rejection).
• MA: Price MA5 & MA10 ke around hai → momentum weak / sideways. MA30 below support de raha hai.
• MACD: Histogram fade ho raha hai → bullish momentum slow, pullback risk.
• Volume: Spike ke baad decreasing → breakout strength kam.
✅ Support: 67,550 → 67,150
⚠️ Resistance: 67,950 → 68,220
👉 Bias: Sideways to slight bearish pullback jab tak 68.2k break na ho.
• 68.2k breakout = continuation long
• 67.5k breakdown = quick dump toward 67.1k
BTC-5.97%
- Reward
- 1
- 3
- Repost
- Share
EqunixHub:
Diamond Hands 💎View More
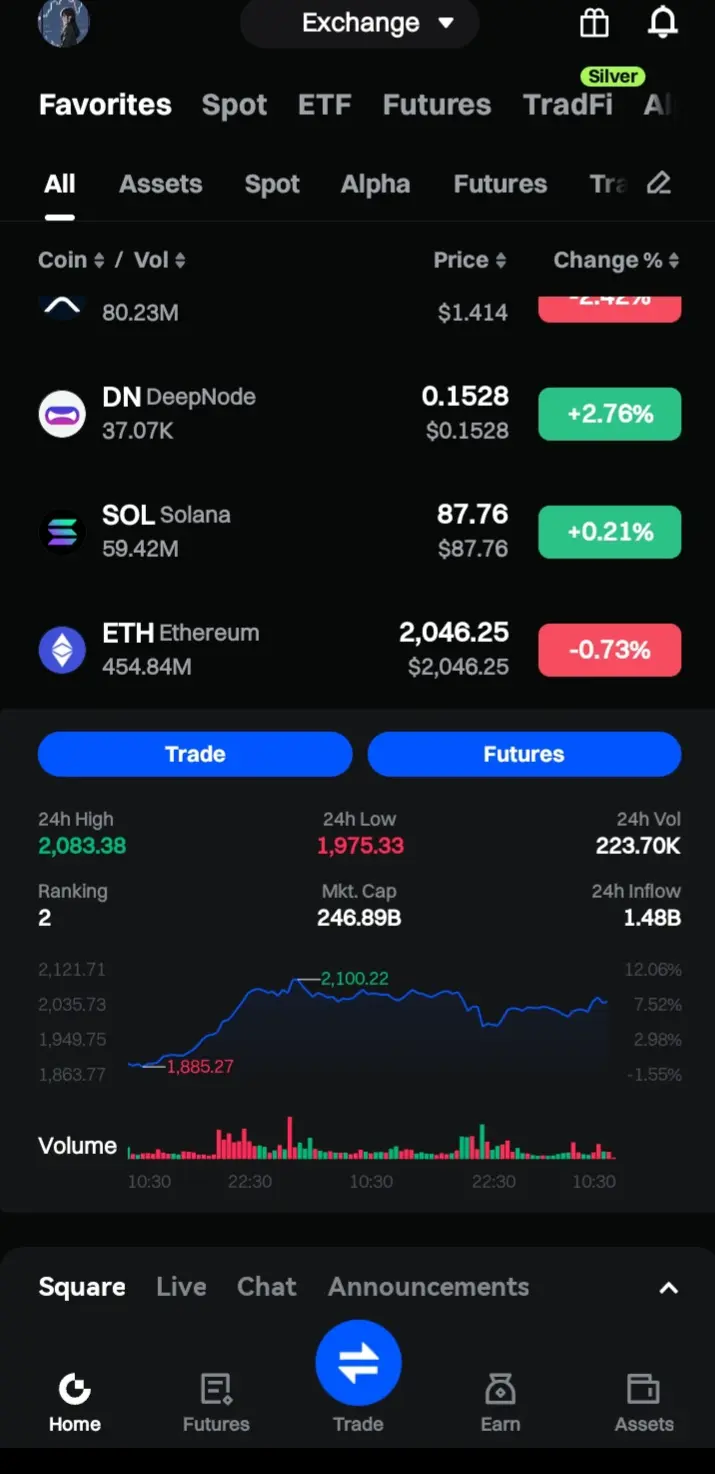
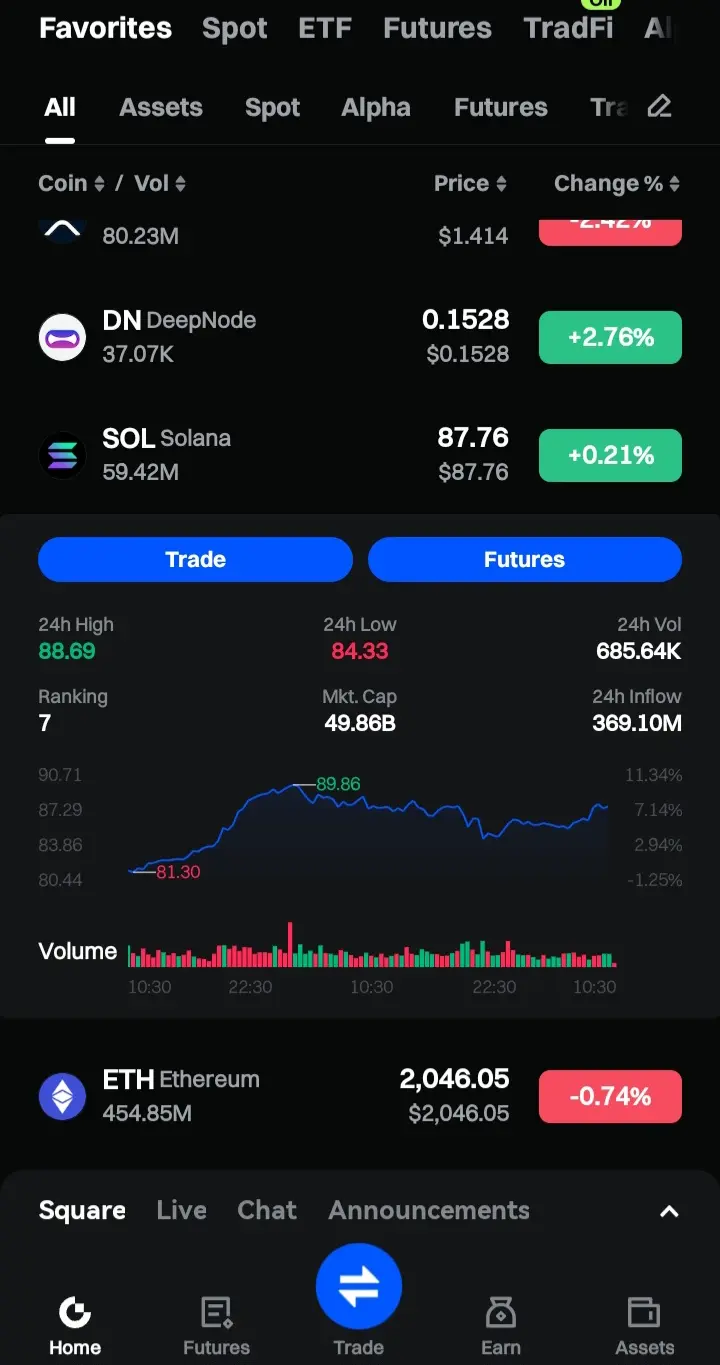
Solana Quick View
$SOL #CryptoRelatedStocksRallyBroadly
SOL ≈ $87.7
🔹 24h High: $88.7
🔹 24h Low: $84.3
🔹 Structure: Mild bullish recovery after pullback
Short take:
Price range-bound hai — $84 support hold kare to bounce continuation possible, while $89–90 resistance break ho to bullish momentum strong ho sakta hai.
$SOL #CryptoRelatedStocksRallyBroadly
SOL ≈ $87.7
🔹 24h High: $88.7
🔹 24h Low: $84.3
🔹 Structure: Mild bullish recovery after pullback
Short take:
Price range-bound hai — $84 support hold kare to bounce continuation possible, while $89–90 resistance break ho to bullish momentum strong ho sakta hai.
SOL-10.45%
- Reward
- 2
- Comment
- Repost
- Share
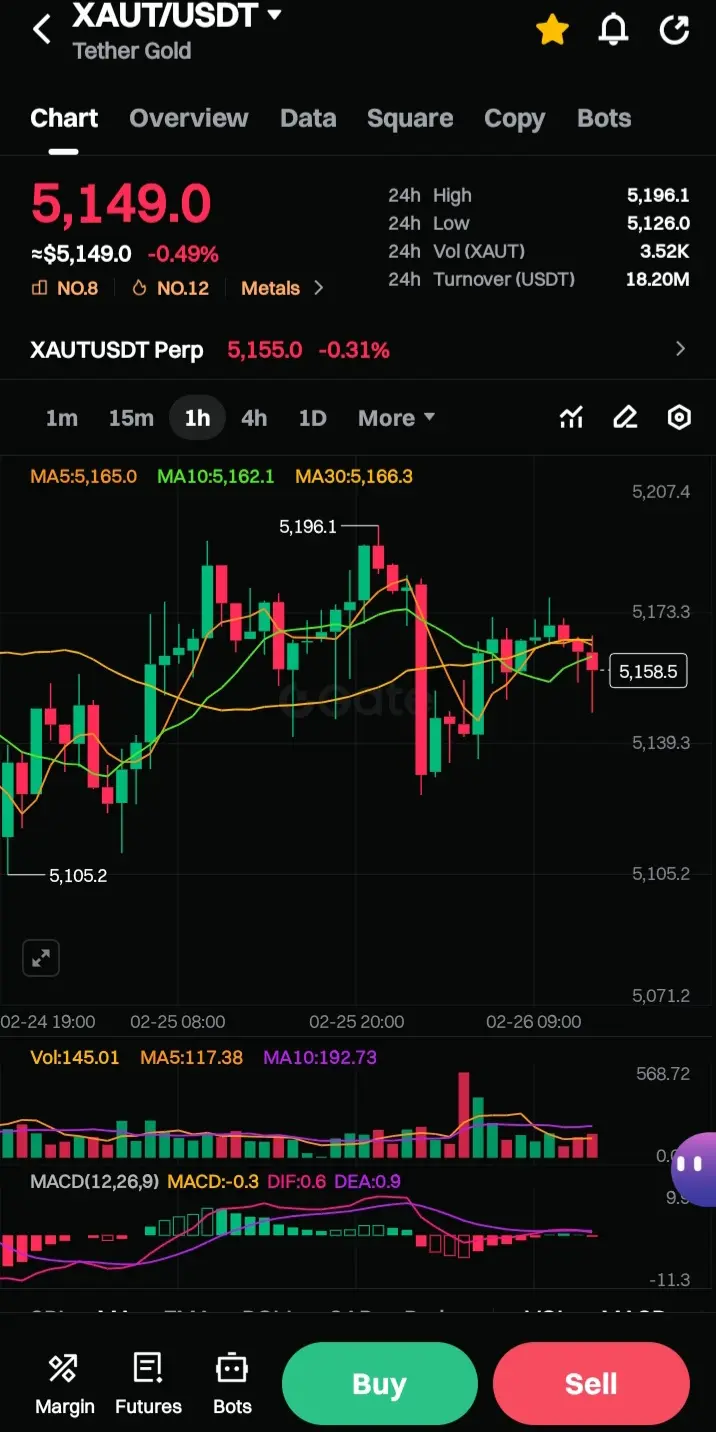
$XAUT T (Tether Gold)
#CryptoMarketRebounds
Current Price Action
Price: $5,149.0 (-0.49%)
24h Range: $5,126.0 – $5,196.1
Timeframe: 1H chart
Technical Indicators
Moving Averages (Bearish alignment)
| MA | Value |
|----|-------|
| MA5 | 5,165.0 |
| MA10 | 5,162.1 |
| MA30 | 5,166.3 |
Price is below all three MAs → short-term bearish pressure
MACD (12,26,9)
MACD: -0.3
DIF: 0.6
DEA: 0.9
Histogram contracting → momentum weakening, possible consolidation
Volume
Current vol (145.01) below MA5 (117.38) and MA10 (192.73)
Recent spike in volume on red candles → selling pressure
Chart Structure
Pric
XAUT2.61%
- Reward
- 4
- 1
- Repost
- Share
INVESTERCLUB:
Good Article keep it up
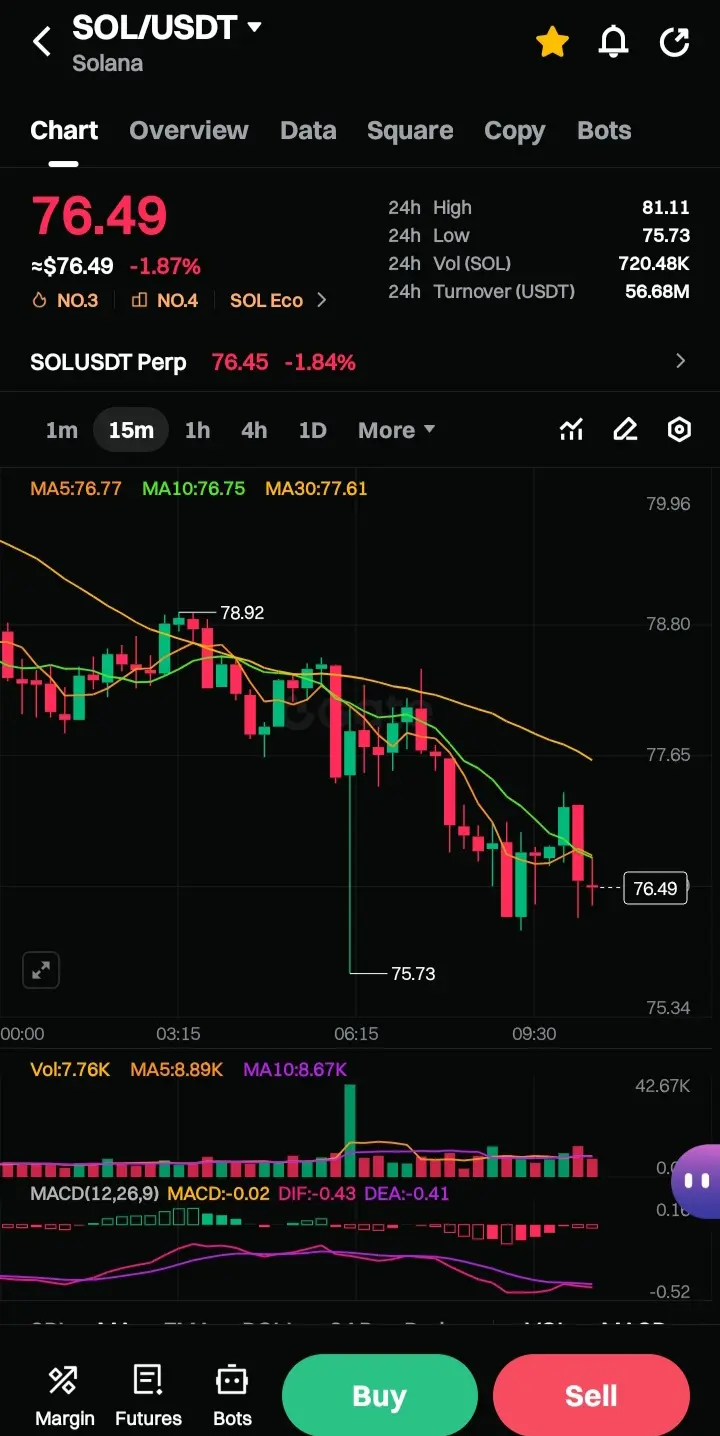
$SOL
Price: $76.49 (-1.87%)
24h Range: $75.73 - $81.11
Volume: 720.48K SOL ($56.68M USDT)
Trend: Bearish on 15m timeframe
Technical Indicators
Moving Averages (Neutral to Slightly Bearish)
MA5: $76.77 (slightly above current price)
MA10: $76.75 (slightly above current price)
MA30: $77.61 (above current price)
Price hovering near short-term MAs, below longer-term MA30
MACD (Neutral/Consolidating)
MACD: -0.02 (near zero line)
DIF: -0.43
DEA: -0.41
Very weak bearish signal, indicating indecision and consolidation
Volume Analysis
Notable volume spike around 06:15
Volume declining after the spik
SOL-10.45%
- Reward
- 2
- Comment
- Repost
- Share
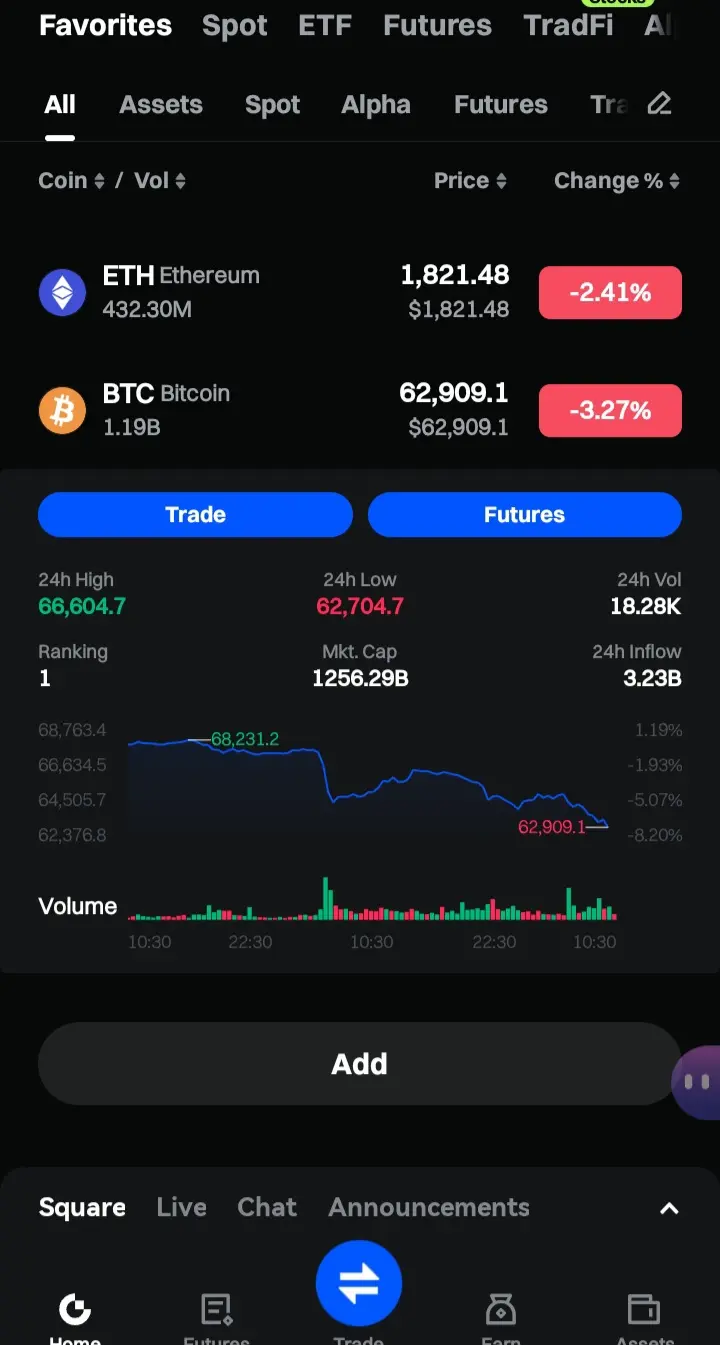
$BTC #TrumpAnnouncesNewTariffs
Price: $62,911 (-3.27%)
24h Range: $62,704.7 - $66,604.7
Trend: Downward momentum on 1h timeframe
Technical Indicators
Moving Averages (Bearish Signal)
MA5: $63,629 (above current price)
MA10: $64,151 (above current price)
MA30: $65,056 (above current price)
Price trading below all major MAs indicates bearish pressure
MACD (Bearish)
MACD: -125.9
DIF: -753.6
DEA: -627.7
Negative divergence with histogram showing selling pressure
Volume Analysis
Recent volume spike visible around Feb 23
Current volume declining as price drops
24h Volume: 18.29K BTC
Key Observati
BTC-5.97%
- Reward
- 2
- Comment
- Repost
- Share
$BTC
A sharp, aggressive "flash crash" for Bitcoin (BTC/USDT) on a 15-minute timeframe. It looks like a classic case of high volatility catching the market off guard.
Here is a breakdown of what the technical indicators are signaling:
1. Price Action & Candlesticks
The Drop: Bitcoin fell from a consolidation zone around $67,700 down to a local low of $64,269 in a very short window.
Current State: The price is currently hovering around $64,917. After such a steep drop, the market is entering a "sideways" phase as bulls and bears fight for control.
Support/Resistance: The immediate supp
BTC-5.97%
- Reward
- 4
- 1
- Repost
- Share
INVESTERCLUB:
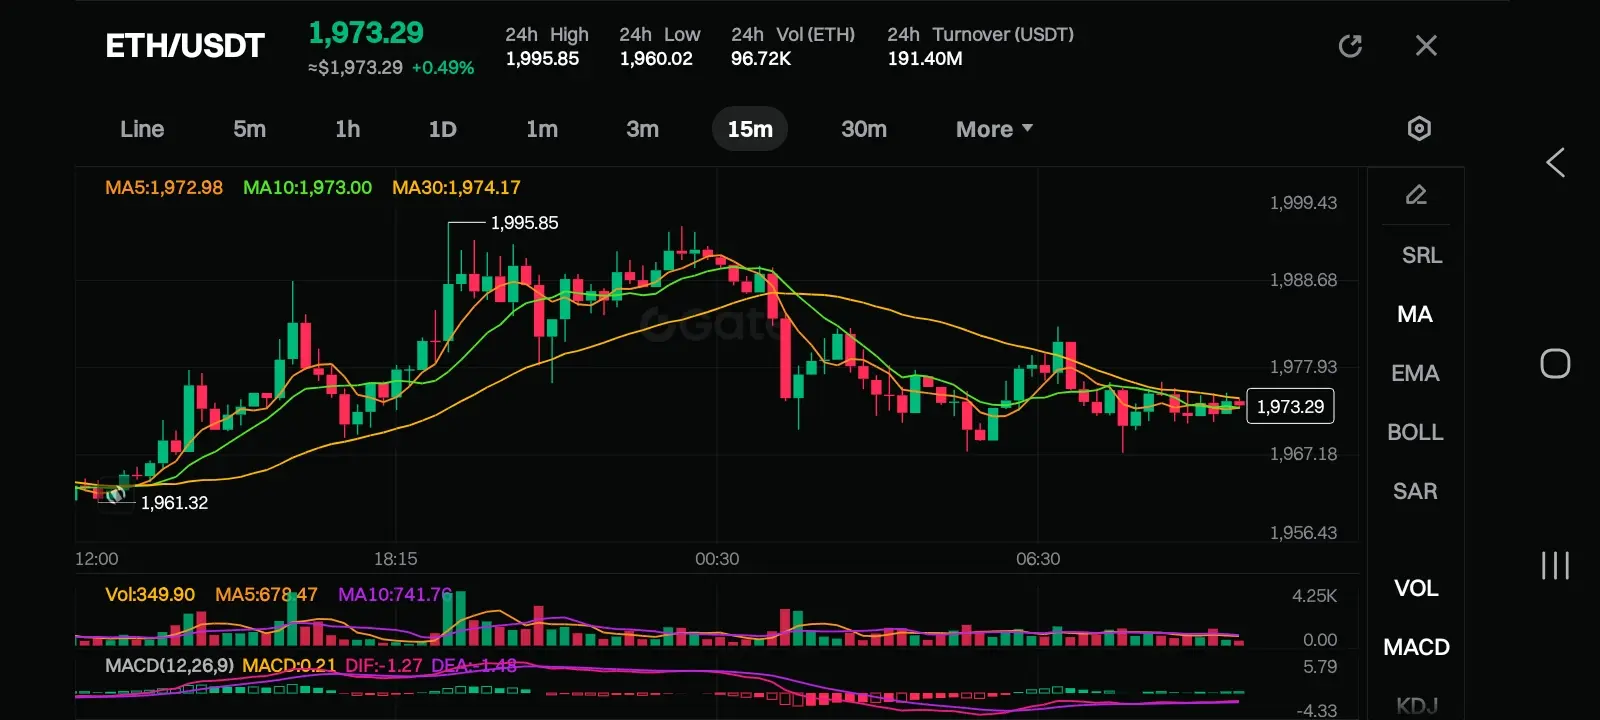
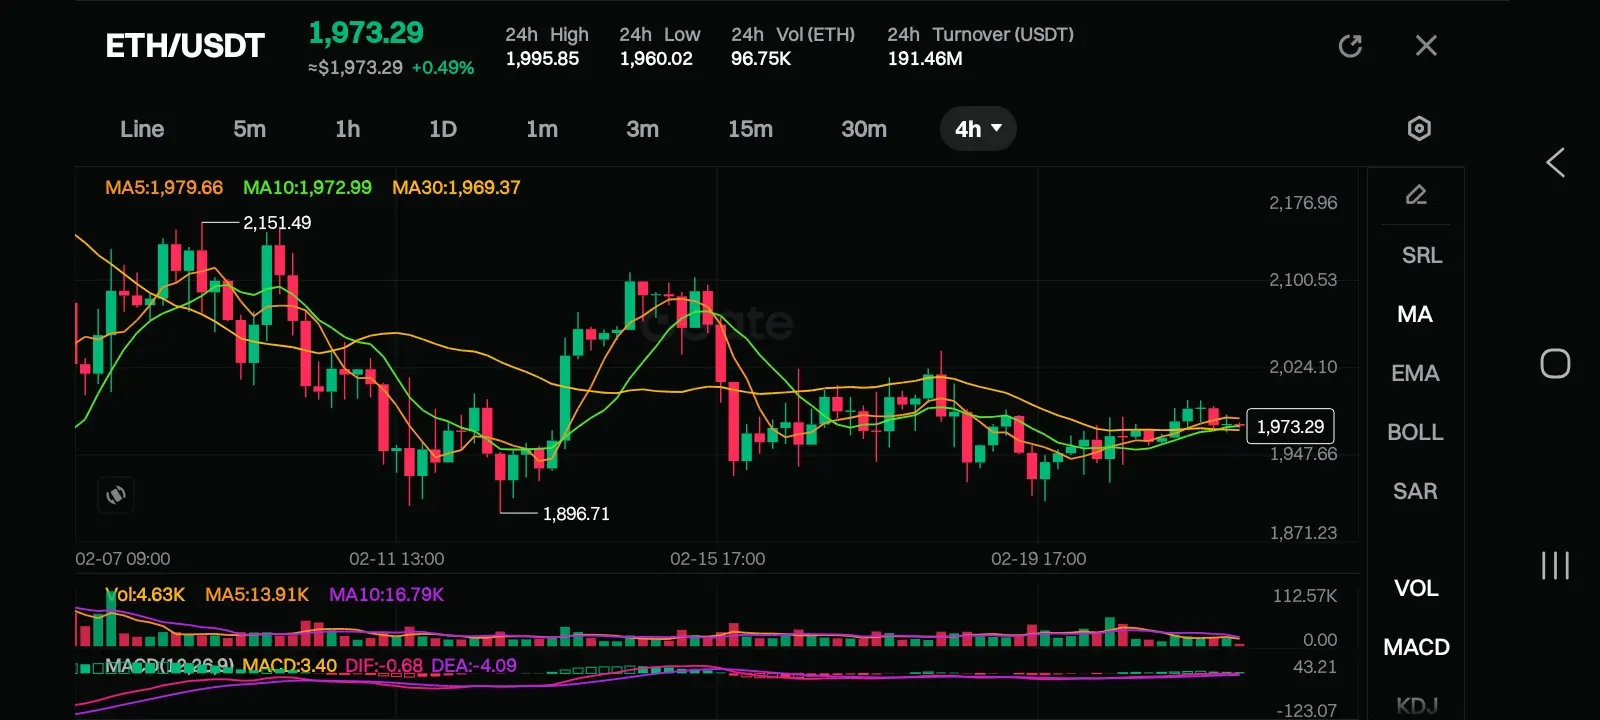
amazing informative article$ETH Based on the 15-minute and 4-hour charts for ETH/USDT, here is a comprehensive technical analysis and a structured trade plan.
Analysis
1. Trend & Price Action
4-Hour Chart (Macro): The price is in a consolidation phase. After a significant drop to $1,896.71, Ethereum has recovered but is currently struggling to break above the $2,000 psychological level. The Moving Averages (MA5, MA10, MA30) are clustering together, which typically precedes a "squeeze" or a volatile breakout.
15-Minute Chart (Micro): The short-term trend is neutral-to-bearish. Price is currently trading slightly belo
ETH-8.81%
- Reward
- 2
- Comment
- Repost
- Share
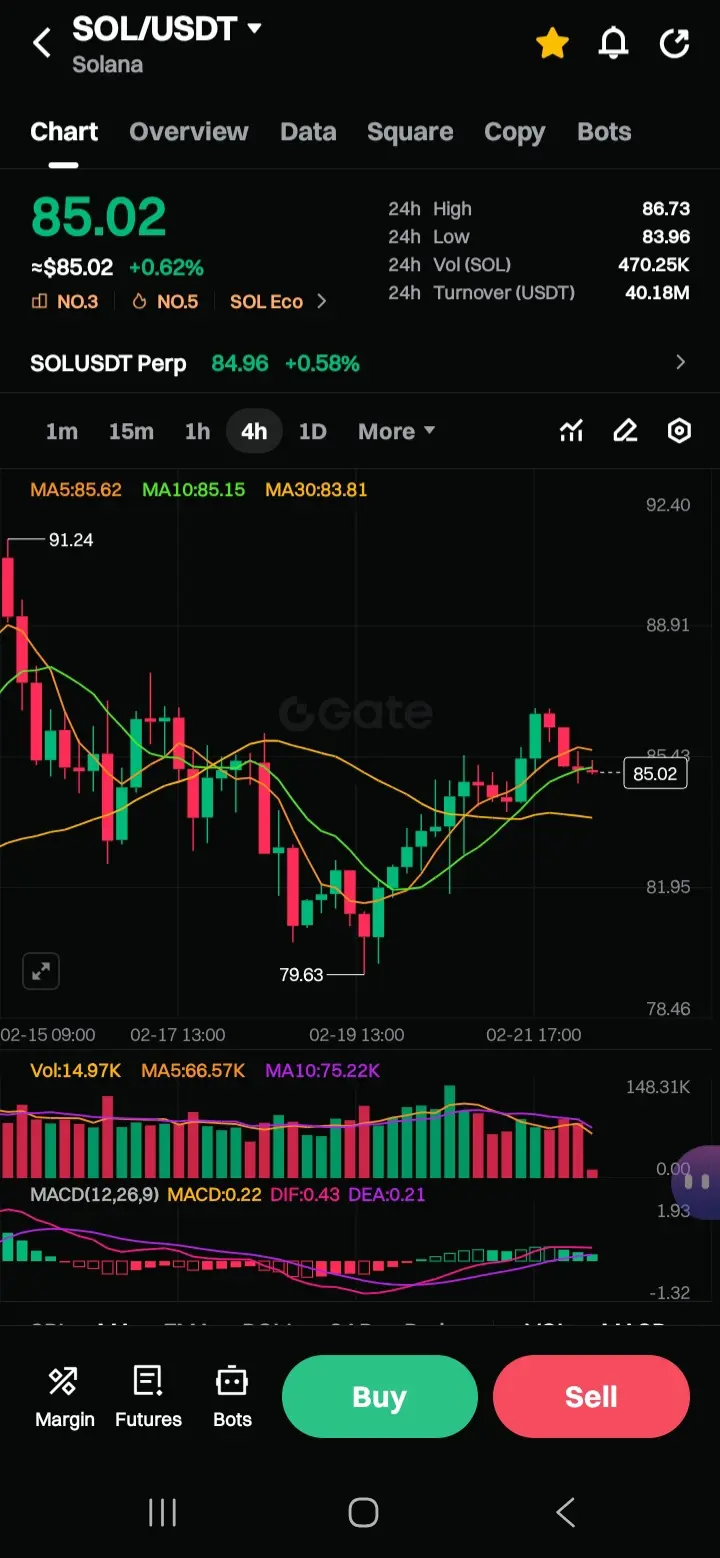
$SOL #CLARITYActAdvances
4-hour timeframe candlestick view of SOL/USDT (Solana perpetual futures or spot on Gate.io), with the price at $85.02 (up +0.62%).
This aligns closely with current live market data as of February 22, 2026, where SOL trades around $85.00–$85.20 (with minor fluctuations across exchanges, 24h range roughly $84.00–$86.70, and positive daily momentum of ~0.6–0.9%).
Here's a breakdown of the key technical elements visible on the chart and what they suggest:
Price Action & Recent Structure
SOL is in a short-term recovery/rebound phase after dipping to a low around $79.63 (
SOL-10.45%
- Reward
- 7
- 3
- Repost
- Share
repanzal:
To The Moon 🌕View More
$SOL #SOLStandsStrong
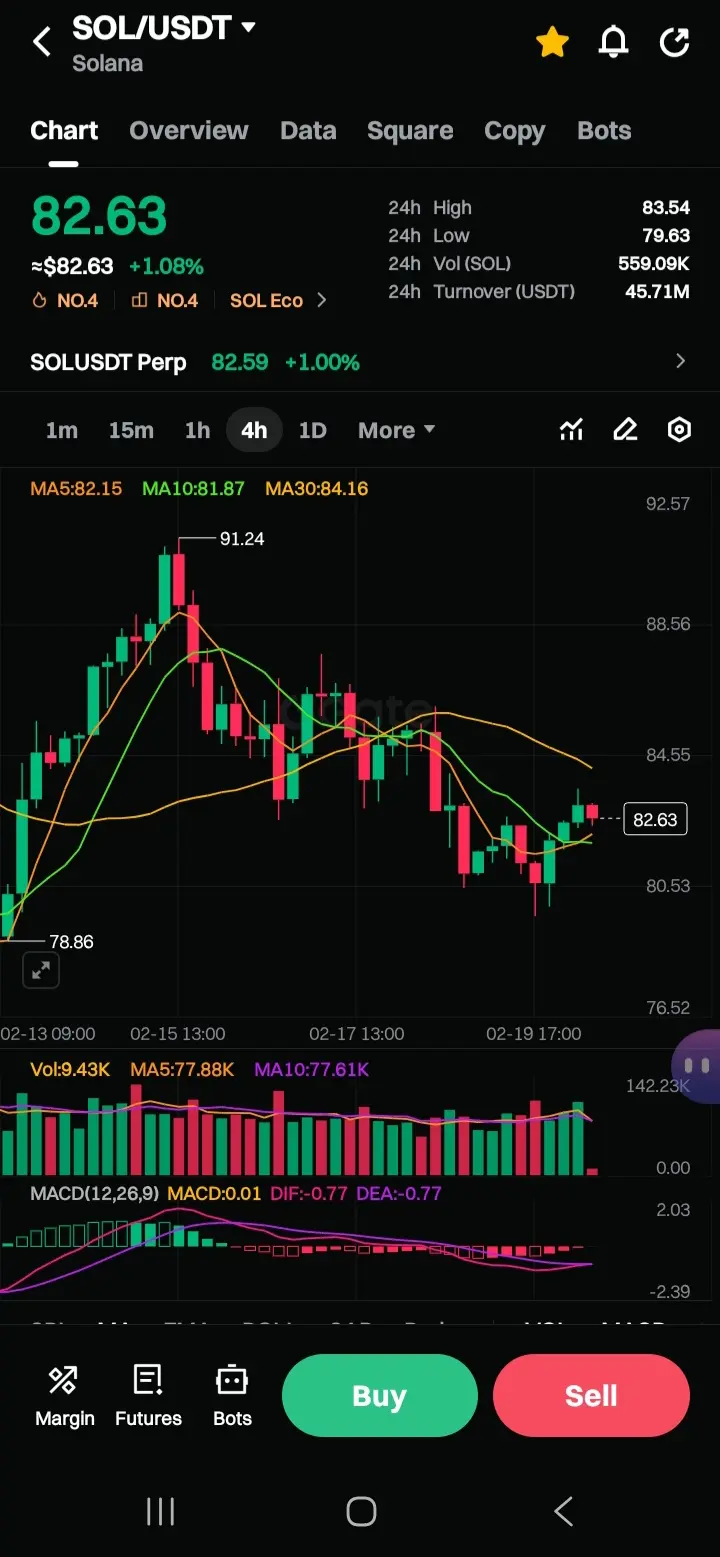
This is an in-depth technical analysis of the SOL/USDT 4-hour (4h) chart provided. Based on the indicators visible (Moving Averages, Volume, and MACD), here is the breakdown of the current market structure.
1. Price Action & Trend Structure
The chart shows Solana (SOL) in a short-term corrective phase following a local peak.
Recent High: The price hit a resistance level around $91.24, followed by a series of lower highs and lower lows.
Current Support: Price found temporary footing near $79.00 - $80.00. It is currently attempting a minor bounce, trading at $82.63.
C
SOL-10.45%

- Reward
- 4
- Comment
- Repost
- Share