Bitcoin, Ethereum, and XRP continue to trade cautiously on Wednesday as upward momentum across the cryptocurrency market gradually weakens. The cautious capital flow prevents large-cap coins from breaking out of prolonged consolidation.
BTC remains range-bound within a familiar parallel channel, reflecting hesitation between bulls and bears. ETH continues to struggle near a key resistance zone, attempting multiple times to break through but without success. Meanwhile, XRP stays fragile within a downtrend channel, posing risks if buying pressure does not improve soon.
Overall, the top three digital assets in the market have yet to establish a clear trend, as sideways accumulation continues to dominate investor sentiment.
Bitcoin Continues to Fluctuate in a Narrow Range
Bitcoin’s price hovers around $68,300 on Wednesday, continuing to consolidate within a relatively wide parallel channel. The short-term trend remains slightly bullish as long as the price stays above the midpoint of this structure. The nearest resistance is identified around $71,980, while notable support is at $65,120.
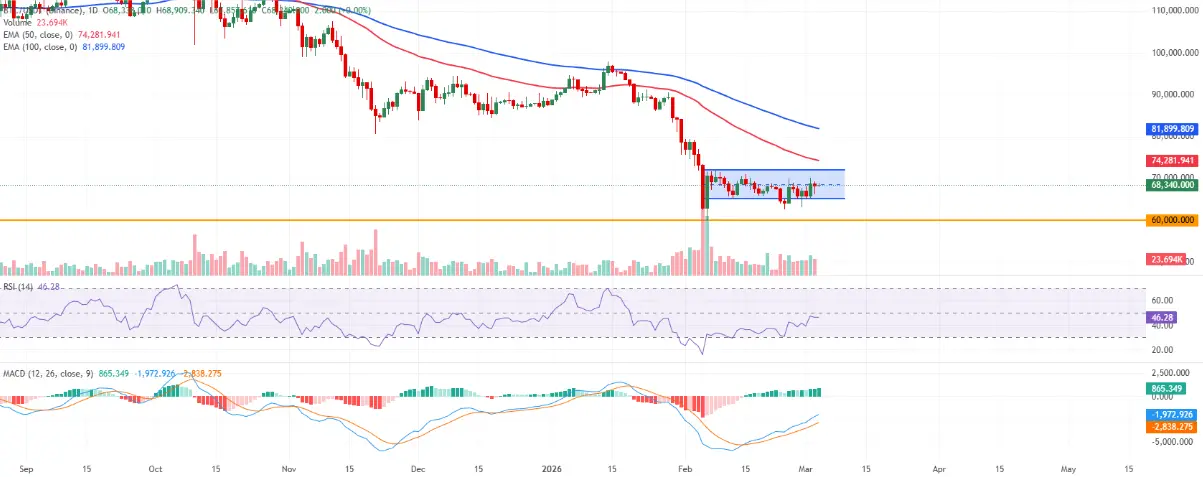 Daily BTC/USDT Chart | Source: TradingView “Crypto King” is still trading below the 50- and 100-day exponential moving averages (EMA), which are converging around $80,000 — a significant technical barrier in the medium term. However, the MACD indicator on the daily timeframe remains above the signal line and in positive territory, with the histogram expanding upward. This suggests that bullish momentum is gradually improving, though the medium-term trend still requires further confirmation.
The RSI stands at 46, indicating that selling pressure has eased after a rebound from oversold levels, reinforcing a balanced state rather than signaling a new wave of selling.
Technically, the resistance at $71,980 — the upper boundary of the channel — is a key hurdle. A daily close above this level could open the way toward the recent high near $75,770.
Ethereum Faces Rejection at Upper Boundary of Accumulation Zone
Ethereum is trading around $1,950 on Wednesday, but the short-term technical picture remains cautious. The price continues to move within a descending channel, with notable resistance near $2,148. Recent rebounds have made the market “more breathable,” but buying strength is still insufficient to challenge the upper boundary of the channel.
ETH remains below both the 50- and 100-day EMAs — both trending downward — indicating that the bearish trend still dominates. Momentum indicators show only temporary stability: the daily RSI has moved out of oversold territory and is rising toward 40, but remains well below the neutral 50 level. Meanwhile, MACD, although above the signal line, hovers near zero, implying selling pressure has weakened but not enough to confirm a clear reversal.
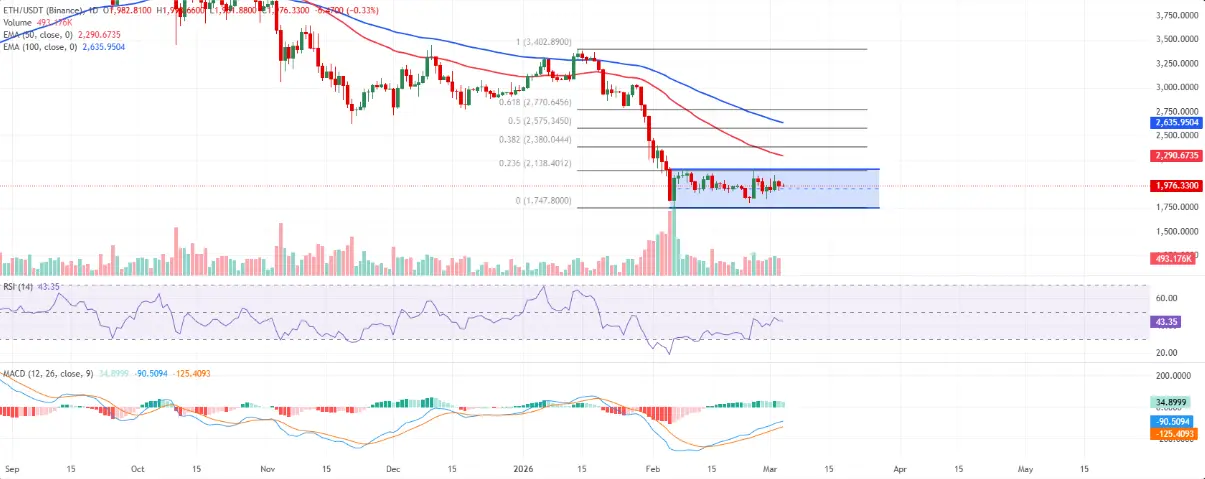 Daily ETH/USDT Chart | Source: TradingView Above, the zone between $2,138 and $2,148 — the confluence of the descending channel’s resistance and the 23.6% Fibonacci retracement (from $3,402 down to $1,747) — is a critical barrier. A daily close above this area could pave the way toward $2,380 — the 38.2% Fibonacci retracement level — where the 50-day EMA is likely to exert further pressure.
Conversely, the nearest support is at $1,856, with a deeper support around the channel’s bottom near $1,750, which also aligns with the Fibonacci retracement of the current correction. Losing the $1,750 level could extend the decline, while failure to break above $2,138 indicates bears still hold the short-term trend.
XRP Remains Trapped in a Downtrend Channel
XRP is trading around $1.36 at the time of writing, but the technical outlook remains cautious. The price continues to be confined within a downtrend channel starting from the over $2.80 high, keeping the short-term trend negative, although it has temporarily held above the lower boundary near $1.24.
Selling pressure persists as the price stays below the 50- and 100-day EMAs, currently converging around $1.55 — a significant resistance zone for any recovery attempts. The RSI is at 41, below neutral, reflecting a slight advantage for sellers despite previous oversold conditions easing. Meanwhile, MACD lines hover just above zero with a mildly positive histogram, indicating weak bullish momentum that is insufficient to reverse the main downtrend.
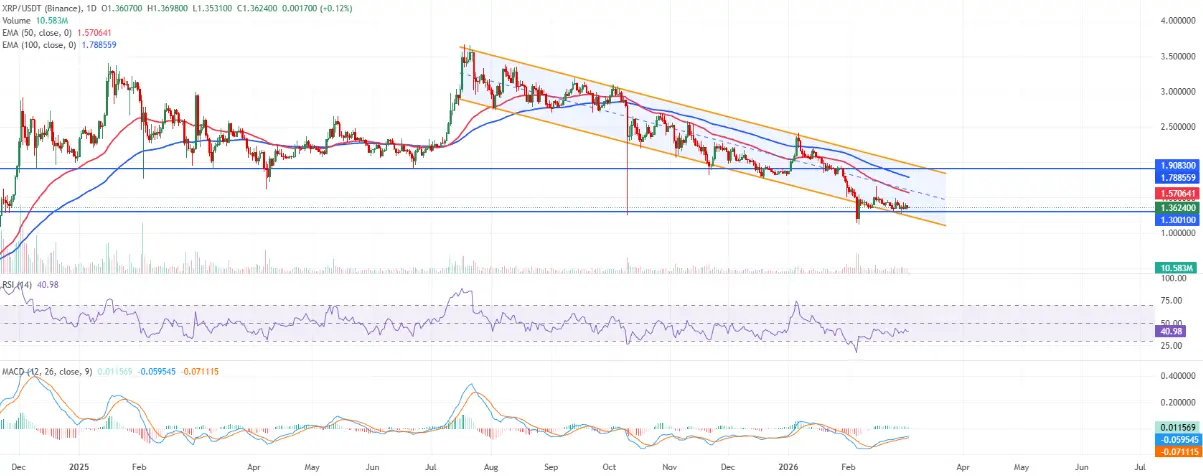 Daily XRP/USDT Chart | Source: TradingView Support levels include $1.30, the closest barrier — corresponding to the lower half of the channel. If this level is broken, the risk of retesting the channel’s bottom at $1.24 increases, potentially deepening the decline within the current negative structure.
On the upside, immediate resistance is at $1.58, where recent highs, the channel’s centerline, and the 50-day EMA converge. A stronger resistance zone lies at $1.91, aligning with previous horizontal resistance and near the 100-day EMA around $1.78. Only a decisive daily close above $1.91 would invalidate the downtrend, opening the door for a clearer and more sustained recovery.
Disclaimer: The information on this page may come from third parties and does not represent the views or opinions of Gate. The content displayed on this page is for reference only and does not constitute any financial, investment, or legal advice. Gate does not guarantee the accuracy or completeness of the information and shall not be liable for any losses arising from the use of this information. Virtual asset investments carry high risks and are subject to significant price volatility. You may lose all of your invested principal. Please fully understand the relevant risks and make prudent decisions based on your own financial situation and risk tolerance. For details, please refer to
Disclaimer.
Related Articles
BlackRock withdrew 2,607 BTC and 28,391 ETH from a certain CEX, for a total value of approximately $237 million
Gate News message: On April 8, according to monitoring by Onchain Lens, BlackRock withdrew 2,607 BTC from a certain CEX, worth approximately $178 million. It also withdrew 28,391 ETH, worth approximately $59 million.
GateNews30m ago
Trader “set 10 big targets first,” closed BTC and ETH long positions, with cumulative profits exceeding $12 million
Gate News message, April 8, the trader "set 10 big goals first" (@Jason60704294) disclosed on social media that he has closed out his BTC and ETH long positions, choosing to take profit and exit. In this trade, his 4x leverage long on BTC generated a profit of about $12.12 million, and his 2x leverage long on ETH generated a profit of about $728k, for a total profit of more than $12 million.
GateNews52m ago
ETH drops 0.97% in 15 minutes: Large capital flows concentrated into exchanges and a surge in derivatives short positions converge, triggering a pullback
From 23:30 to 23:45 on April 7, 2026 (UTC), ETH’s return in the span of 15 minutes recorded -0.97%. The price range was 2241.48–2273.25 USDT, and the amplitude reached 1.40%. During this period, the market saw significant volatility; trading activity declined and risk appetite shifted toward defense, drawing widespread attention from the market.
The primary drivers behind this unusual move were large capital transitioning into and then concentrating inflows into exchanges, as well as the synchronous increase in short positions in the derivatives market, which amplified spot sell pressure. On-chain data shows that, during this stage, the total large-amount inflows of ETH into exchanges exceeded 120,000 coins, accompanied by…
GateNews1h ago
ETH breaks through 2250 USDT
Gate News bot message, Gate price chart shows that ETH has broken through 2250 USDT, and the current price is 2250.66 USDT.
CryptoRadar1h ago
ETH jumps 1.92% in a 15-minute surge: major holders accumulate in bulk and exchange liquidity dries up in tandem to drive the rise
2026-04-07 22:45 to 2026-04-07 23:00 (UTC), the ETH spot price gained +1.92% over 15 minutes, rising from 2176.26 USDT to 2219.85 USDT, with an intraday swing of 2.00% during the period. Market attention increased in the short term, and volatility intensity clearly intensified. The current unusual move quickly sparked widespread attention on-chain and among exchange fund flows.
The main drivers behind this unusual move are concentrated net buying by top whale addresses and exchange balances falling to historical lows, which together boosted price elasticity. Data shows,
GateNews1h ago
ETH Breaks Through 2200 USDT
Gate News bot message, Gate market data shows ETH breaking through 2200 USDT, current price is 2202.89 USDT.
CryptoRadar2h ago
