
Gold and Bitcoin have both been moving in a big way lately, but in totally opposite directions. The gold price has been on an absolute tear, pushing straight up into what looks like the kind of late-stage run that usually grabs everyone’s attention.
At the same time, the BTC price has been doing the reverse, pulling back hard, clearing out leverage, and dragging the whole market back into that uncomfortable fear-heavy mood.
Gold may be nearing the end of its move, and Bitcoin could be entering the kind of reset zone that has historically shown up before major upside returns.
- Gold Might Be Near The End of Its Cycle Push
- Bitcoin is Doing The Opposite: Panic First, Base Later
- The Gold-Bitcoin Rotation Story Is Showing Up Again
Gold Might Be Near The End of Its Cycle Push
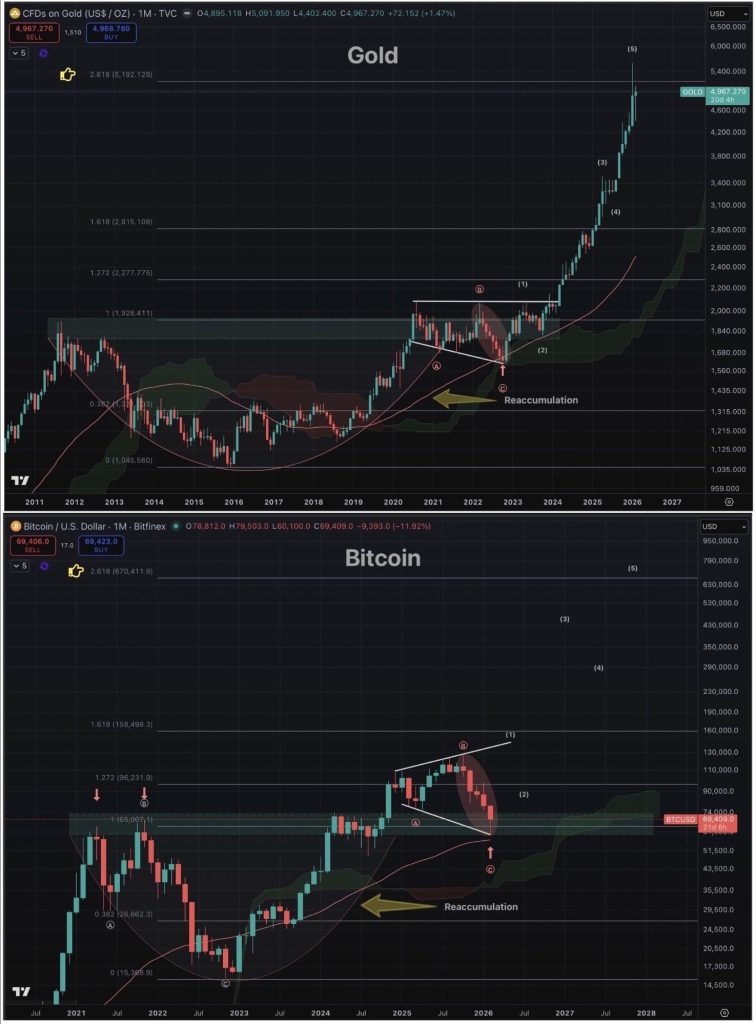
The top chart makes the gold story pretty easy to follow. The gold price spent years moving sideways, chopping around the $1,200–$2,000 range without much excitement. Then it finally broke out, and once it did, it accelerated fast.
You can see the reaccumulation phase marked on the chart, that long, boring stretch that acted like a launchpad for the breakout. Now the gold price is sitting near $4,950–$5,000, deep into the upper Fibonacci extension levels, which is usually where momentum starts to peak.
The move has been powerful, but vertical runs like this often cool off once late buyers rush in. Van de Poppe’s point is simple: gold may be close to topping out, or at least reaching a zone where upside becomes harder and pullbacks become more likely.
Source: X/@CryptoMichNL
Bitcoin is Doing The Opposite: Panic First, Base Later
The bottom chart tells a completely different story. The BTC price has dropped sharply from its recent highs near $110,000–$120,000 and is now trading back inside a major support band around $65,000–$74,000, a zone that’s acted as a base in past cycles.
This is the region labeled “reaccumulation,” and it’s the kind of area where Bitcoin has often spent time after ugly selloffs. It doesn’t look clean or bullish yet, but that’s normal. Bottoms rarely form with fireworks; they form with exhaustion candles, messy price action, and a market that feels completely unsure.
Van de Poppe also points out that weekly RSI has reached levels not seen since the major cycle lows in 2018 and 2022, which is part of why he thinks Bitcoin is closer to a bottom than a top.
This Altcoin vs Bitcoin Chart Just Flashed the Biggest Rotation Signal Since 2020_**
The Gold-Bitcoin Rotation Story Is Showing Up Again
One of the more interesting ideas here is how the gold price and the BTC price tend to trade off each other over time. Van de Poppe describes it like a pendulum.
Gold runs first, then stalls, and Bitcoin often follows with a delayed move higher. That pattern has shown up before in cycles like 2016 and 2020, when gold cooled off and Bitcoin eventually caught the next major upside wave.
Right now, the valuation gap between Bitcoin and gold is the widest it’s been since Bitcoin existed, with gold near $5,000 and Bitcoin sitting closer to $70,000 after its drawdown. If gold starts to cool off, the next big impulse could rotate back into crypto.
Disclaimer: The information on this page may come from third parties and does not represent the views or opinions of Gate. The content displayed on this page is for reference only and does not constitute any financial, investment, or legal advice. Gate does not guarantee the accuracy or completeness of the information and shall not be liable for any losses arising from the use of this information. Virtual asset investments carry high risks and are subject to significant price volatility. You may lose all of your invested principal. Please fully understand the relevant risks and make prudent decisions based on your own financial situation and risk tolerance. For details, please refer to
Disclaimer.
