Author: Common Sense Investor (CSI)
Translation: ShenChao TechFlow
ShenChao Guide: As the macro environment undergoes dramatic changes in 2026, market logic is shifting profoundly. Veteran macro trader Common Sense Investor (CSI) presents a contrarian view: 2026 will be the year bonds outperform stocks.
Based on the heavy interest expense pressure on the US government, signals of deflation from gold, extremely crowded short bond positions, and imminent trade conflicts, the author believes that long-duration US bonds (such as TLT) are at an explosive point with an “asymmetric game” advantage.
In a market where bonds are widely considered “uninvestable,” this article uses rigorous macro mathematical reasoning to reveal why long-term bonds could become the highest-return asset in 2026.
The main body is as follows:
Why I Overestimate TLT and TMF — and Why Stocks Will Underperform in 2026
I do not write this lightly: 2026 is destined to be the year bonds beat stocks. This is not because bonds are “safe,” but because macro math, position distribution, and policy constraints are converging in an unprecedented way—and such a scenario rarely ends with “Higher for Longer” high interest rates.
I have already put my money where my mouth is.
Currently, TLT (20+ year US Treasury ETF) and TMF (3x leveraged long 20+ year US Treasury ETF) account for about 60% of my portfolio. This article consolidates data from my recent posts, adds new macro context, and sketches a bullish scenario for long-duration bonds (especially TLT).
Core arguments overview:
- Gold’s trend: Gold’s historical performance does not signal sustained inflation—it signals deflation/deflation risk.
- Fiscal deficit: US fiscal math is collapsing: about $1.2 trillion in annual interest expenses and still rising.
- Issuance structure: Treasury bond issuance favors short-term, quietly increasing systemic refinancing risk.
- Short squeeze: Long-term bonds are among the most crowded short positions in the market.
- Economic indicators: Inflation data is cooling, sentiment is weak, and labor market pressures are rising.
- Geopolitics: Geopolitical and trade headlines are shifting toward “Risk-off,” not “Reflation.”
- Policy intervention: When cracks appear in certain links, policies tend to shift toward lowering long-term rates.
This combination has historically been the rocket fuel for TLT.
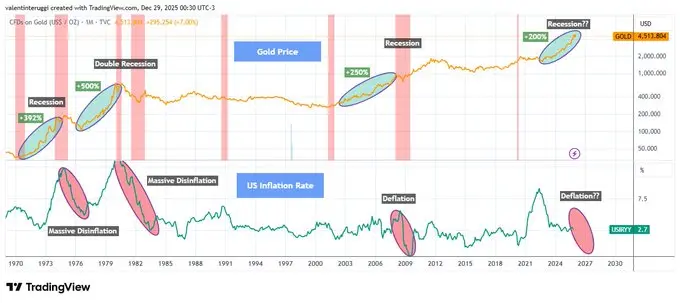
Gold Is Not Always an Inflation Warning
Whenever gold surges over 200% in a short period, it does not foreshadow runaway inflation—it signals economic stress, recession, and declining real interest rates (see Figure 1 below).
Historical experience shows:
- After gold soared in the 1970s, recession + disinflation followed.
- After the early 1980s surge, a double recession occurred, breaking inflation.
- Gold’s rise in the early 2000s foreshadowed the 2001 recession.
- After the breakout in 2008, deflation shocks ensued.
Since 2020, gold has surged again by about 200%. This pattern has never ended with persistent inflation.
When growth reverses, gold’s performance resembles a safe-haven asset.
US Interest Expenses Are Exploding Exponentially
The US currently spends about $1.2 trillion annually on interest, roughly 4% of GDP (see Figure 2 below).
This is no longer a theoretical issue. It’s real cash outflow—when long-term yields stay high, interest costs compound rapidly.
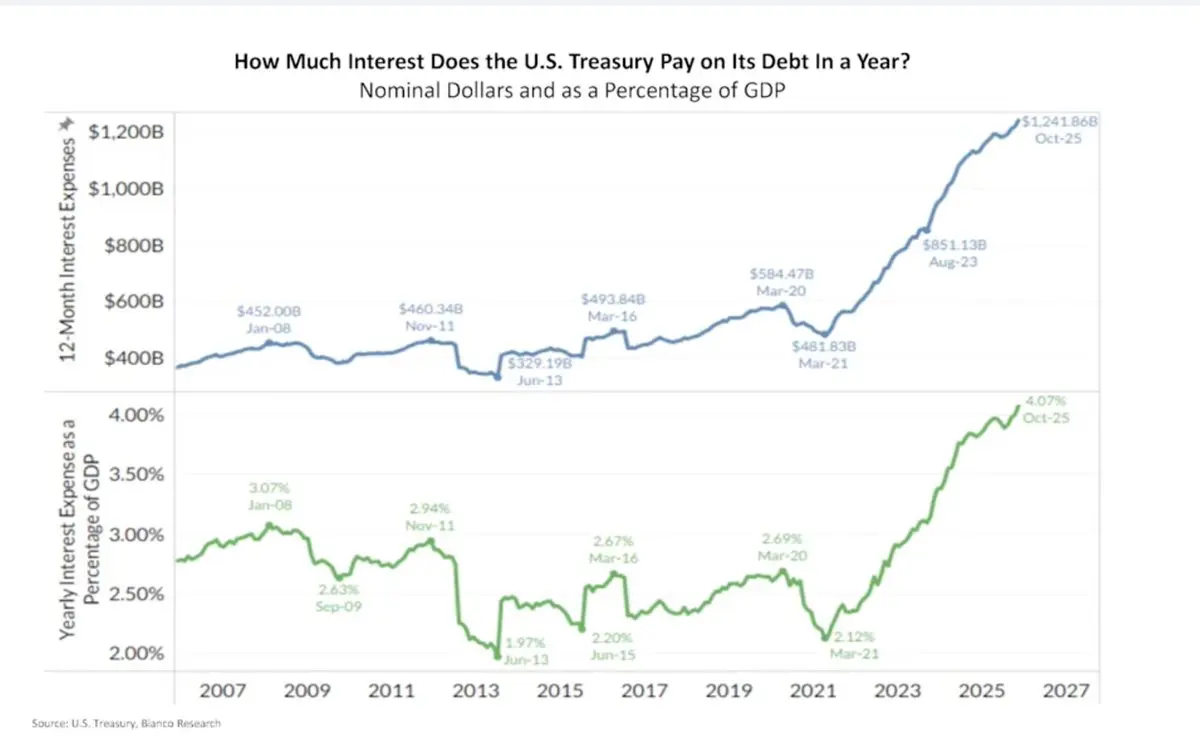
This is the so-called “Fiscal Dominance”:
- High interest rates mean higher deficits
- Higher deficits mean more debt issuance
- More debt issuance leads to higher term premiums
- Higher term premiums lead to even higher interest expenses!
This vicious cycle will not resolve itself through “Higher for Longer” rates. It must be addressed through policy intervention!
Short-Term Trap of the Treasury
To ease immediate pain, the Treasury has sharply reduced long-term bond issuance:
- 20- and 30-year bonds now account for only about 1.7% of total issuance (see Figure 3 below).
- The rest has been shifted entirely to short-term bills.
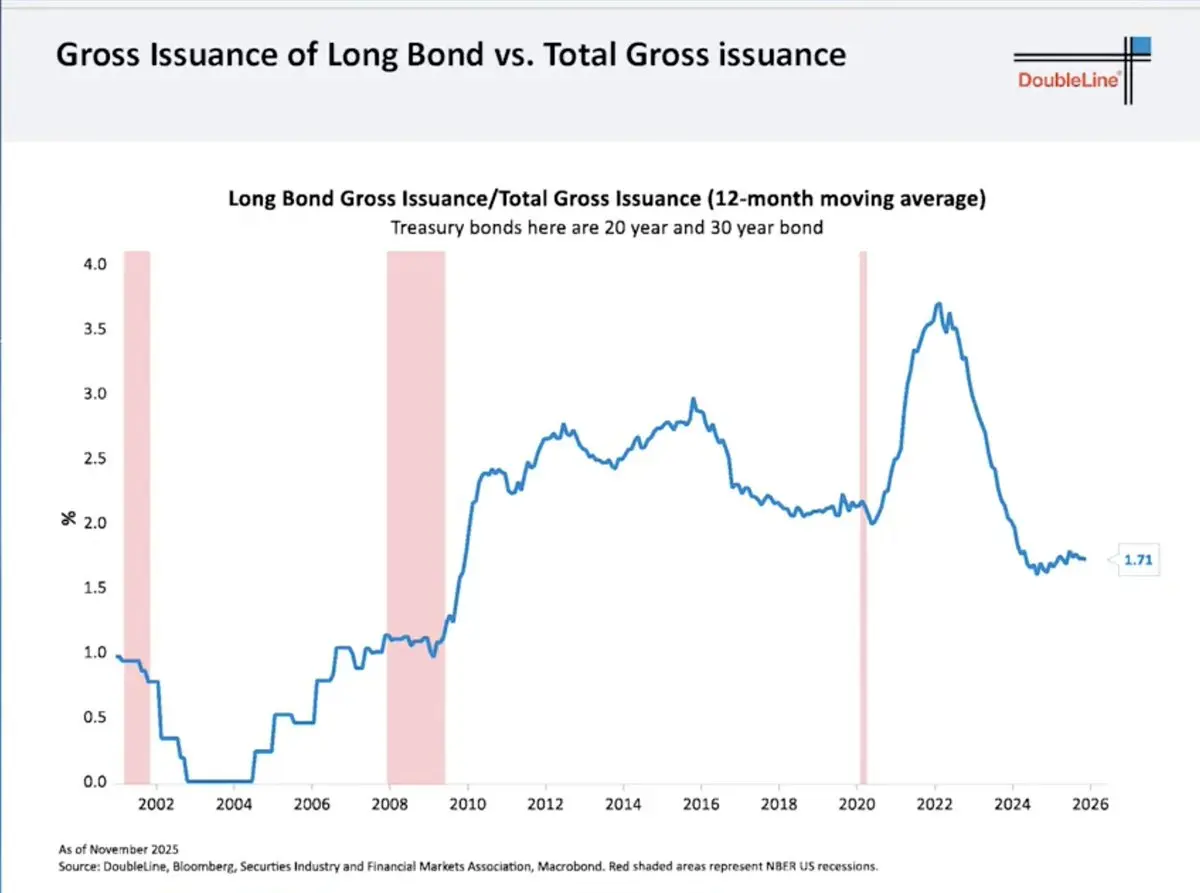
This does not solve the problem—it merely shifts it to the future:
- Short-term debt rolls over continuously.
- Refinancing will be at future interest rates.
- Markets see the risk and demand higher term premiums.
Ironically, this is exactly why long-term yields stay high… and why they will plunge sharply once growth collapses.
Fed’s Trump Card: Yield Curve Control
The Fed controls short-term rates, not long-term. When long-term yields:
- Threaten economic growth
- Trigger exploding fiscal costs
- Disrupt asset markets
…the Fed typically does only two things:
- Buy long bonds (QE)
- Implement Yield Curve Control (YCC)
They do not act preemptively. They only intervene when pressure becomes evident.
Historical references:
- 2008–2014: 30-year yield dropped from ~4.5% to ~2.2% → TLT surged +70%
- 2020: 30-year yield dropped from ~2.4% to ~1.2% → TLT surged +40% in less than 12 months
This is not just theory—it has actually happened!
Inflation Is Cooling, and Cracks Are Emerging in the Economy
Recent data shows core inflation is returning to 2021 levels (see Figure 4).
- CPI momentum is waning.
- Consumer confidence is at a decade low.
- Credit pressures are building.
- Labor market is beginning to show cracks.
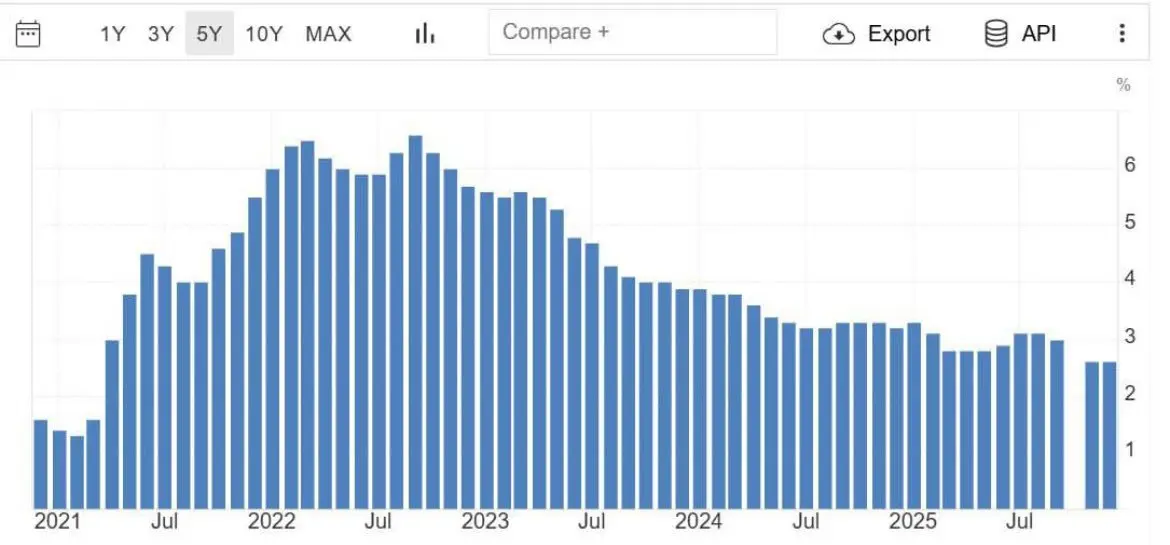
Markets are forward-looking. Bond markets have already started sensing these signals.
Crowded Short Positions
# Short interest in TLT is extremely high:
- About 144 million shares are shorted.
- Days to cover exceeds 4 days.
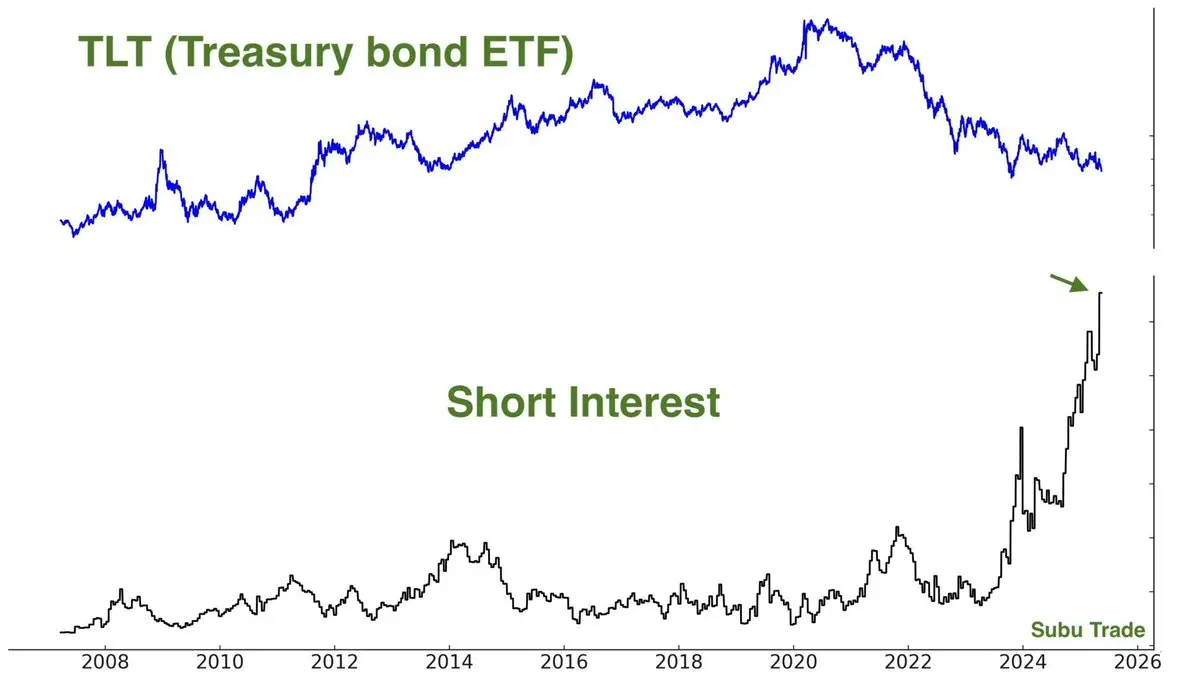
Crowded trades do not exit slowly. They reverse violently—especially when market narratives shift.
And importantly:
“Shorts pile in after the trend has already started to turn.”
This is typical late-cycle behavior!
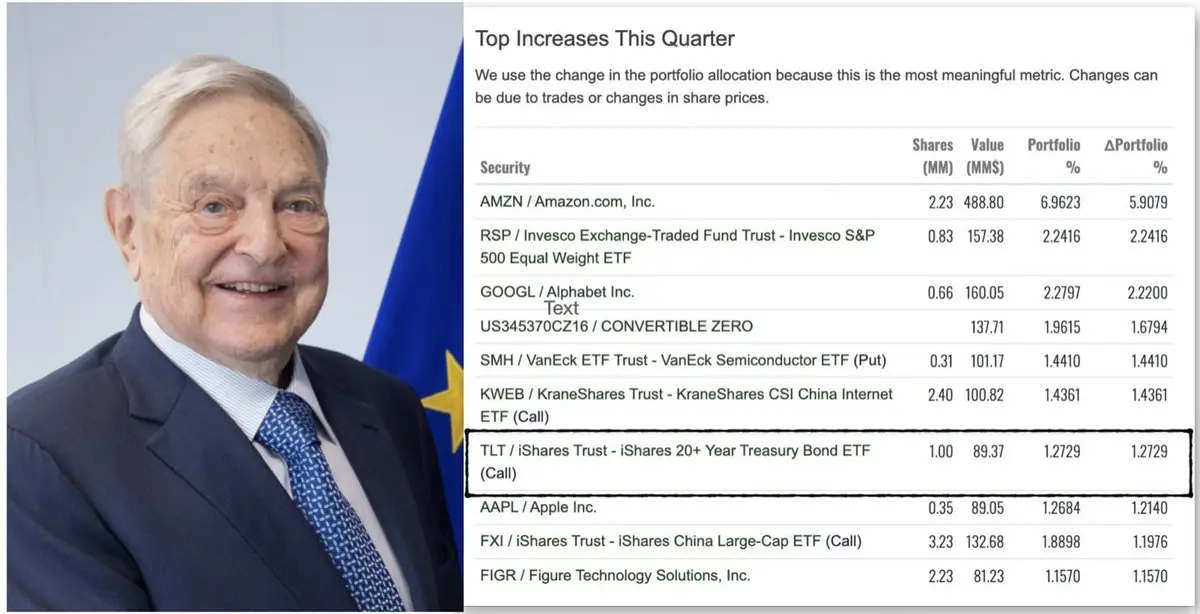
Smart Money Is Entering
Recent widely circulated 13F filings show that a major fund has increased holdings of TLT call options significantly in the quarter.
Credit to whoever, the message is simple: sophisticated capital is beginning to reposition for duration. Even George Soros’s fund holds TLT calls in its latest 13F.
Tariff Frictions and Deflationary Shock
Latest news reinforces the “risk-off” logic. President Trump announced new tariff threats over Denmark/Greenland disputes, and European officials are openly discussing freezing or suspending EU-US tariff agreements in response.
Trade frictions will:
- Hit growth
- Compress profit margins
- Reduce demand
- Push capital into bonds rather than stocks
This is not an inflation impulse—it’s a deflationary shock.
Valuation Mismatch: Stocks vs Bonds
Today’s stock valuations reflect:
- Strong growth
- Stable profit margins
- Moderate financing environment
While bond valuations reflect:
- Fiscal stress
- Sticky inflation concerns
- Permanent high yields
If one of these narratives deviates, returns will diverge sharply.
Long-duration bonds have “Convexity,” stocks do not.
$TLT Upside Scenario Analysis
TLT has:
- About 15.5 years of effective duration
- You can earn approximately 4.4–4.7% yield during the wait
Scenario analysis:
- If long yields fall by 100 basis points (bps), TLT’s price return is +15–18%
- If they fall by 150 bps, TLT’s return is +25–30%
- If they fall by 200 bps (not extreme historically), it could surge +35–45% or more!
This does not include interest income, convexity bonuses, or accelerated short covering effects. That’s why I see “asymmetric upside potential.”
Conclusion
Honestly: after the devastation of 2022, I vowed never to touch long bonds again. Watching duration assets get shattered was very frustrating.
But the market does not pay for your psychological trauma—it only pays for probabilities and prices.
When everyone agrees bonds are “uninvestable,” sentiment bottoms out, shorts pile up, yields are high, and growth risks are rising…
That’s when I start to buy!
- TLT + TMF currently make up about 60% of my portfolio. I achieved 75% returns in the 2025 stock market and reallocated most funds into bond ETFs in November 2025.
- I am “holding bonds and waiting for the rise” (earning over 4% yield).
- My positions are based on policy and growth shifts, not vague narratives.
2026 will ultimately be the “Year of Bonds.”
