Bitcoin (BTC) made a strong breakout over the weekend and continued its recovery into Monday trading session, despite the hot geopolitical developments following the US military campaign in Venezuela. Notably, CoinMarketCap’s “Crypto Fear and Greed Index” shifted back to neutral on Sunday, reflecting a clear improvement in investor sentiment. Previously, since mid-October, this measure mainly fluctuated within the “fear” and “extreme fear” zones.
Further supporting the bullish outlook, history shows that since 2020, Bitcoin has only closed January in the red once. Moreover, data from CoinGlass indicates that from 2013 to now, BTC has recorded an average monthly gain of 3.92% in the first month of the year. If this historical pattern continues, Bitcoin is likely to maintain an upward trend in January.
From a capital flow perspective, institutional investors are also showing optimism as we move into 2026. Specifically, Bitcoin ETF funds attracted a net inflow of $471.3 million on Friday — the highest since November 11, when $524 million was recorded, according to data from Farside Investors.
So, do BTC and the top altcoins have enough momentum to stay above key resistance levels? Let’s analyze the charts of the 10 largest cryptocurrencies to find out.
Technical Analysis of SPX
The S&P 500 (SPX) has retreated from the 6,945 level on 26/12 but is finding support at moving averages.
 Daily SPX Chart | Source: TradingView This indicates that bulls see correction phases as opportunities to accumulate. Buyers will try to strengthen their position by pushing the index above 6,945. If successful, the index could rise to the psychological level of 7,000 and then target 7,290.
On the downside, the moving averages are critical support zones to watch. If the index closes below the 50-day SMA at 6,809, SPX could fall to 6,720. This scenario suggests the index may continue consolidating within the 6,550 – 6,945 range for some more time.
Technical Analysis of DXY
The US Dollar Index (DXY) has rebounded above the 20-day EMA at 98.46, but the long wick indicates selling pressure near the 50-day SMA at 99.08.
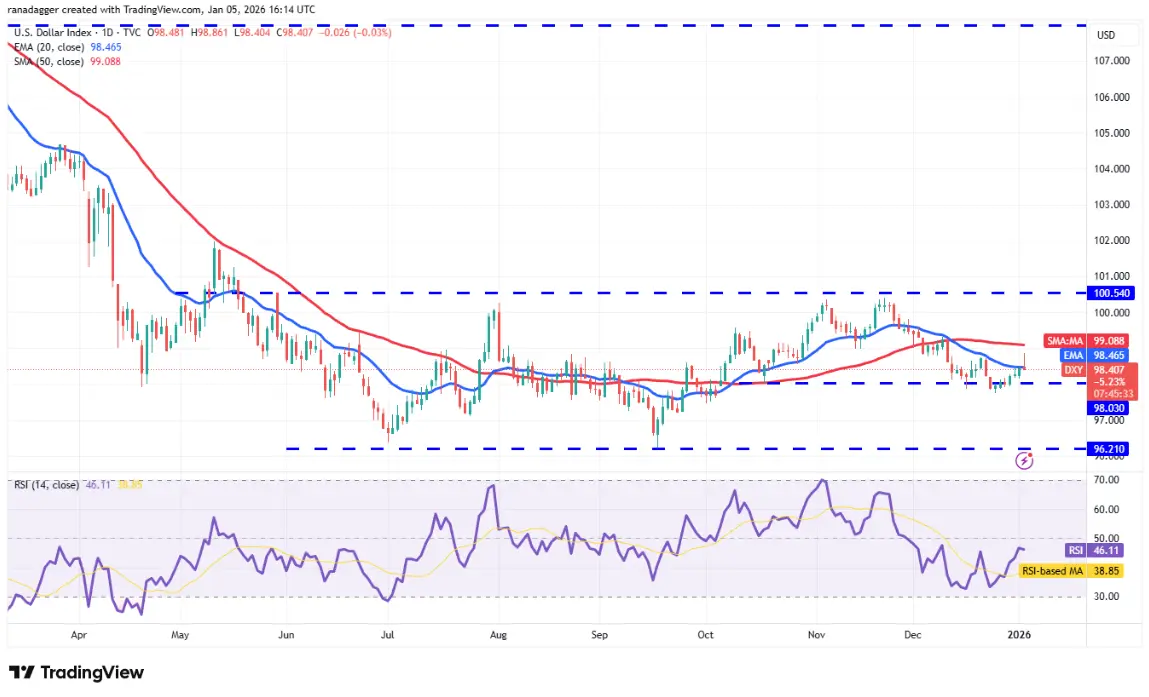 Daily DXY Chart | Source: TradingView Bears will attempt to push the price below the support zone at 98.03. If successful, the index is likely to oscillate within a broad range from 96.21 to 100.54 over the next few days.
On the upside, if DXY breaks out and closes above the 50-day SMA, it signals renewed strength. The index could then test the strong resistance zone at 100.54. A close above this level could open a new bullish trend toward 104.87.
Technical Analysis of BTC
Bitcoin closed above the 50-day SMA at $89,231 on Friday and continued rising toward the resistance zone above at $94,589.
 Daily BTC/USDT Chart | Source: TradingView The moving averages are approaching a bullish crossover, while the RSI is in positive territory, indicating bulls are in control. If buyers surpass the $94,589 mark, Bitcoin could surge toward the psychological level of $100,000 and further to $107,500.
Conversely, if the price sharply reverses from the resistance zone and breaks below the moving averages, BTC/USDT could continue to fluctuate within the $84,000 – $94,589 range for some time.
Technical Analysis of ETH
Ether has risen to the resistance line of the symmetrical triangle pattern, showing buying interest at lower price levels.
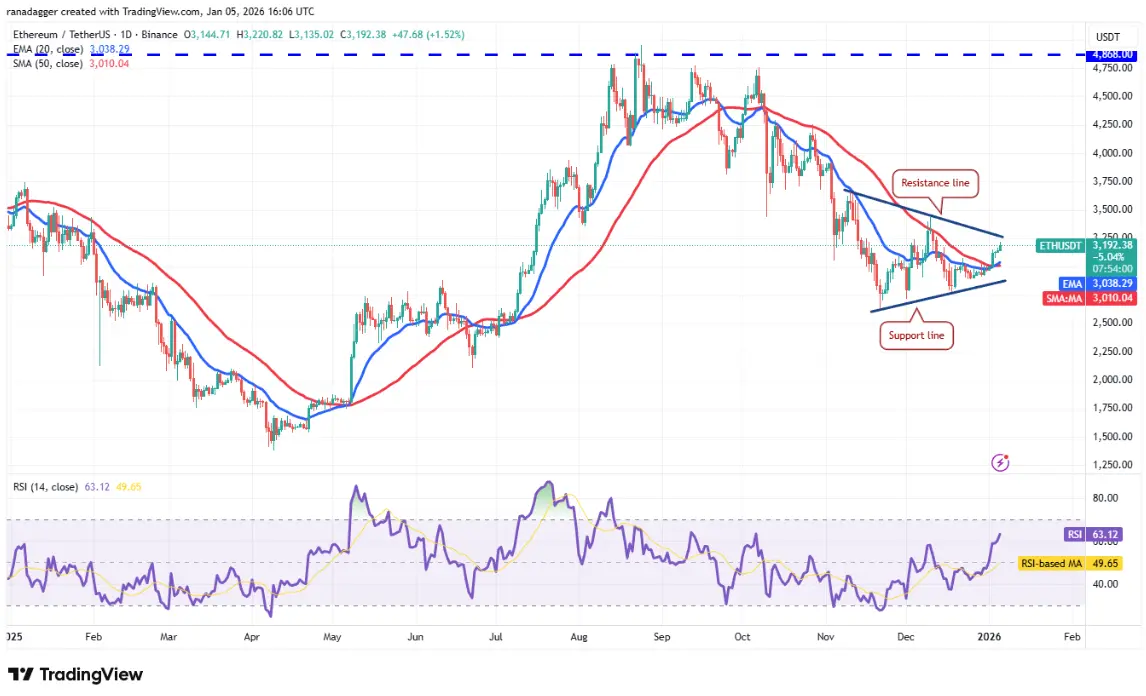 Daily ETH/USDT Chart | Source: TradingView The moving averages have completed a bullish crossover, and the RSI has crossed above 63, signaling an advantage for bulls. A close above the resistance line will open the path for ETH to rise to $3,659 and then to $4,000.
On the downside, the moving averages and the support line of the pattern are expected to attract buying interest. Bears need to push ETH/USDT below the support line to confirm a reversal to a downtrend.
Technical Analysis of XRP
XRP has moved above the moving averages, indicating that bulls have regained control.
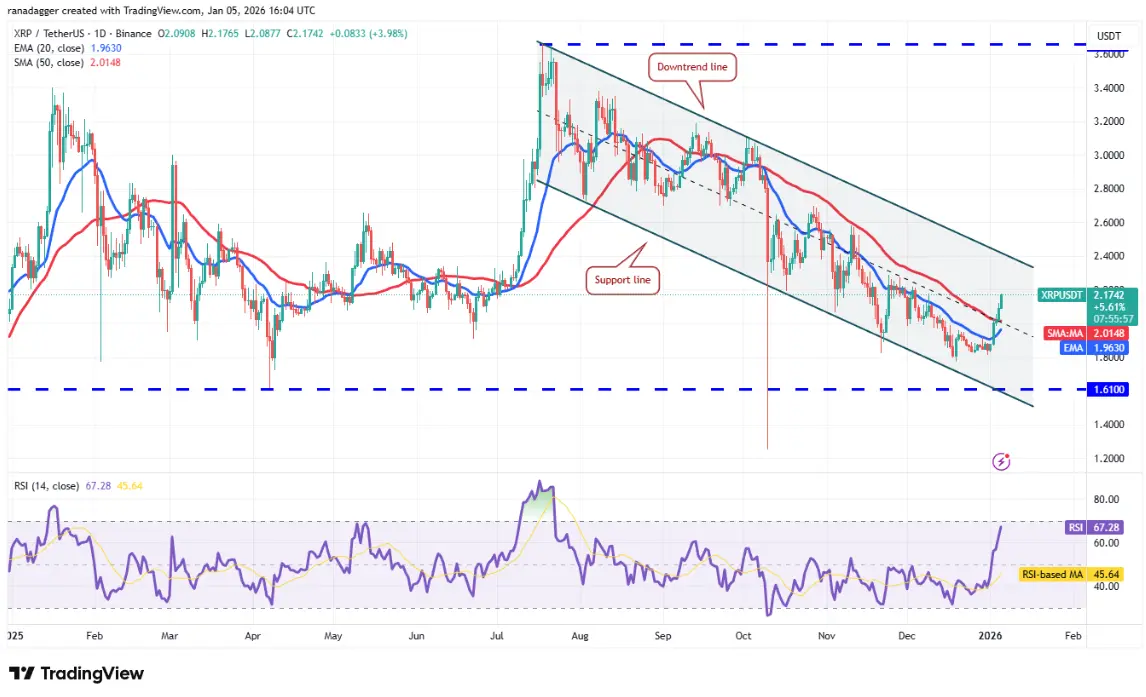 Daily XRP/USDT Chart | Source: TradingView XRP’s price could rise to the downtrend line of the descending channel pattern, which is expected to act as a major barrier. If the price sharply reverses from this trendline, XRP/USDT could continue to oscillate within the channel for a few more days.
Alternatively, if buyers close the price above the downtrend line, it will signal a short-term trend reversal. The pair could then rise to the $3 level. Bears need to push the price below the support zone at $1.61 to regain the advantage.
Technical Analysis of BNB
BNB continues to approach the $928 level after breaking above the moving averages on Friday.
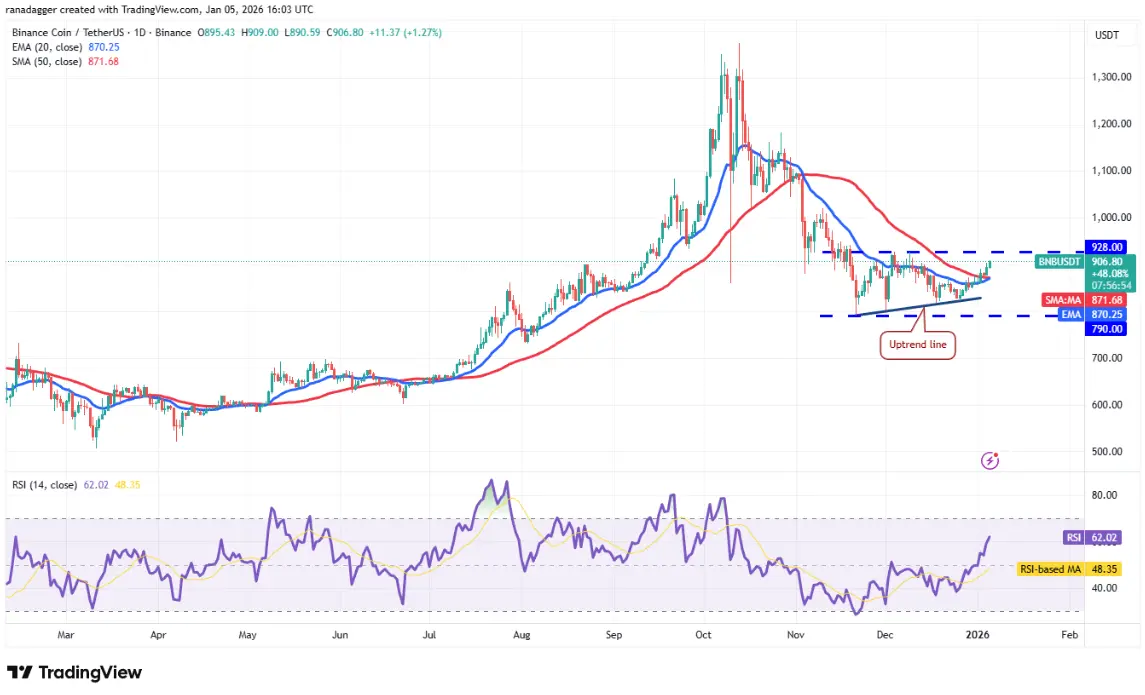 Daily BNB/USDT Chart | Source: TradingView Bears are expected to defend the $928 zone aggressively, as a close above this level would complete a bullish triangle pattern. The BNB/USDT pair could then surge toward the target of $1,066.
This optimistic scenario will be invalidated in the short term if BNB’s price reverses from $928 and breaks below the moving averages. This would suggest the pair may oscillate within the $790 – $928 range for some more time.
Technical Analysis of SOL
Solana (SOL) closed above the moving averages on Friday, indicating that the bears are gradually losing control.
 Daily SOL/USDT Chart | Source: TradingView The 20-day EMA (128 USD) has started trending upward, while the RSI has returned to positive territory, showing a slight advantage for bulls. The recovery could push the price toward $147, where selling pressure from bears is expected.
If the price corrects from the $147 resistance zone, it is likely to find support at the 20-day EMA. This indicates improving market sentiment and that bulls are ready to buy on dips. This increases the chances of SOL breaking above $147, potentially pushing the pair toward $172.
Technical Analysis of DOGE
Dogecoin (DOGE) broke above the moving averages on Friday, indicating the market has dismissed the downside breakout scenario below $0.13.
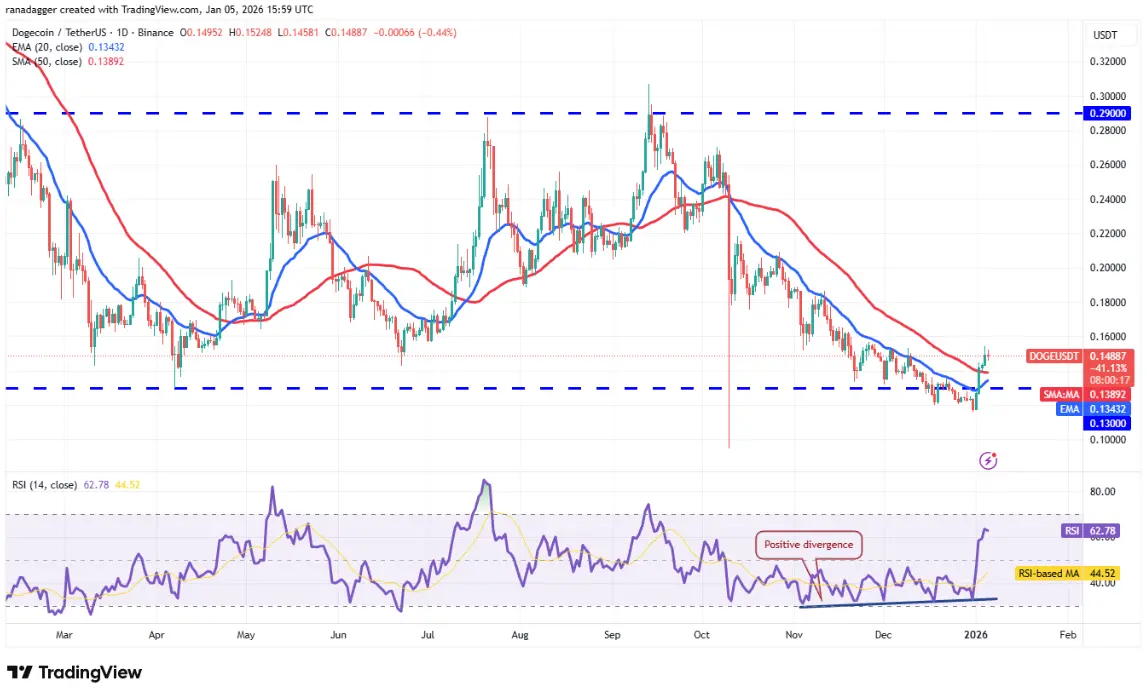 Daily DOGE/USDT Chart | Source: TradingView The 20-day EMA (0.13 USD) has started trending upward, along with RSI returning to positive territory, favoring bulls. Although there is minor resistance at $0.16, it is likely to be surpassed. The Dogecoin price could then rise to $0.19.
If the price corrects, the nearest support is expected at the 20-day EMA and then at $0.13. Bears need to push DOGE/USDT below $0.11 to regain control; then, the price could fall to $0.10.
Technical Analysis of ADA
Cardano (ADA)’s recovery has broken above the 50-day SMA (0.40 USD), indicating sustained buying interest from bulls.
 Daily ADA/USDT Chart | Source: TradingView Buyers will try to push ADA toward the $0.50 zone — the previous breakout level, where strong selling pressure from bears is expected. If ADA/USDT corrects from $0.50 but maintains support at the 20-day EMA (0.38 USD), it suggests positive market sentiment, increasing the likelihood of a breakout above $0.50 resistance.
Conversely, if the price reverses and breaks below $0.37, it indicates that bears are still actively selling on rallies. The pair could then test the key support zone at $0.33.
Technical Analysis of BCH
Bitcoin Cash (BCH) broke above the resistance at $651 on Saturday, indicating the upward trend is resuming.
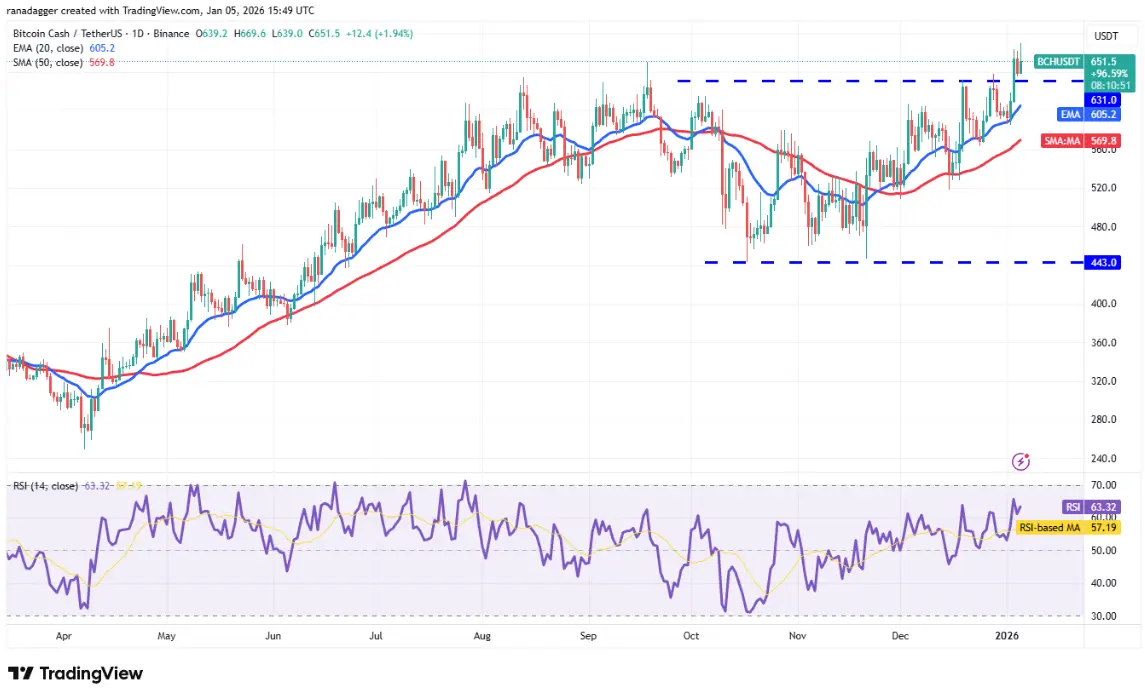 Daily BCH/USDT Chart | Source: TradingView Bears attempted to pull BCH back below the breakout level of $631 on Sunday, but bulls held firm. This suggests bulls are trying to turn $631 into support. BCH/USDT could then surge toward $720, where strong resistance from bears is expected.
Time is running out for bears. They need to quickly push the price below the 20-day EMA (605 USD) to weaken the current bullish momentum.
