Original Title: “On-chain Data Academy (3): Have the market makers who accumulated at the bottom taken profits?”
Original author: Mr. Beg, on-chain data analyst
This article is the 3rd in the on-chain data classroom series, which consists of 10 articles. It will guide you step by step in understanding on-chain data analysis. Interested readers are welcome to follow this series.
Related reading: “On-chain Data Classroom (II): The Hodlers Who Keep Making Money, What Is Their Cost of Buying BTC?”
TLDR
-
This article will introduce the on-chain indicator Realized Profit.
-
Realized Profit shows the amount of profit taken off the market daily.
-
A massive Realized Profit is usually only caused by holders of low-cost chips.
-
The top is usually accompanied by a massive amount of Realized Profit
Realized Profit & Realized Loss Introduction
Realized Profit, translated as “已实现利润”, is calculated based on the price of each BTC at the time of the last transfer and the price at the time of the previous transfer, determining how much BTC is taken for profit each day. By summing up the total profit from these BTC realizations, one can obtain the daily Realized Profit.
Of course, if the price at the time of the final transfer is lower than the price at the time of the previous transfer, it will be counted as Realized Loss.
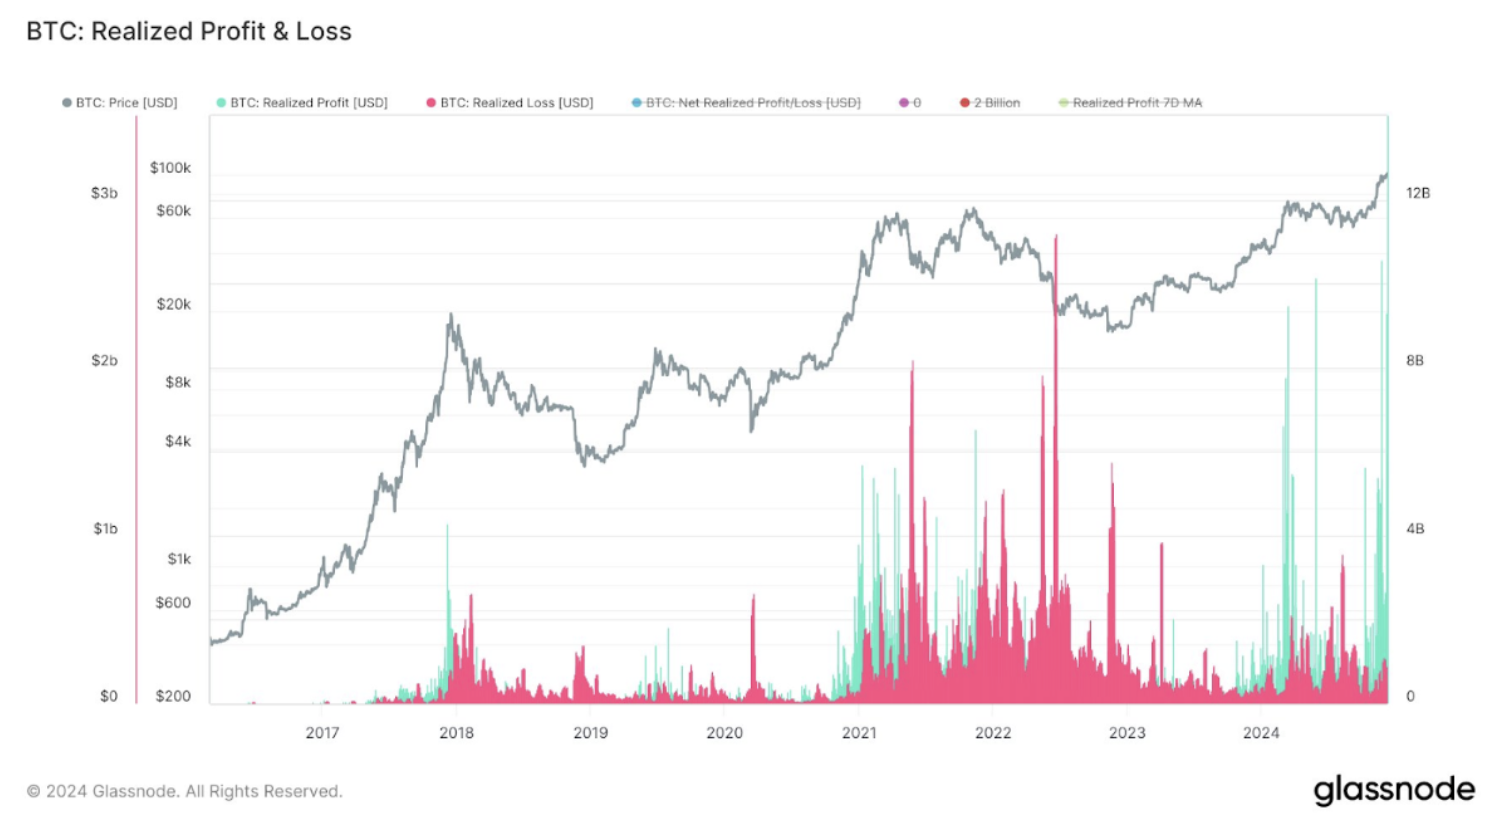
Realized Profit & Realized Loss Chart
Large amounts of Realized Profit are usually caused by holders of low-cost Accumulation.
As shown in the figure below: Due to high-cost chip holders, their profit margin is not large, so when they sell, the **Realized Profit** they can generate is not much.
So, when we see a huge amount of Realized Profit, it usually means that low-cost chips are selling BTC.
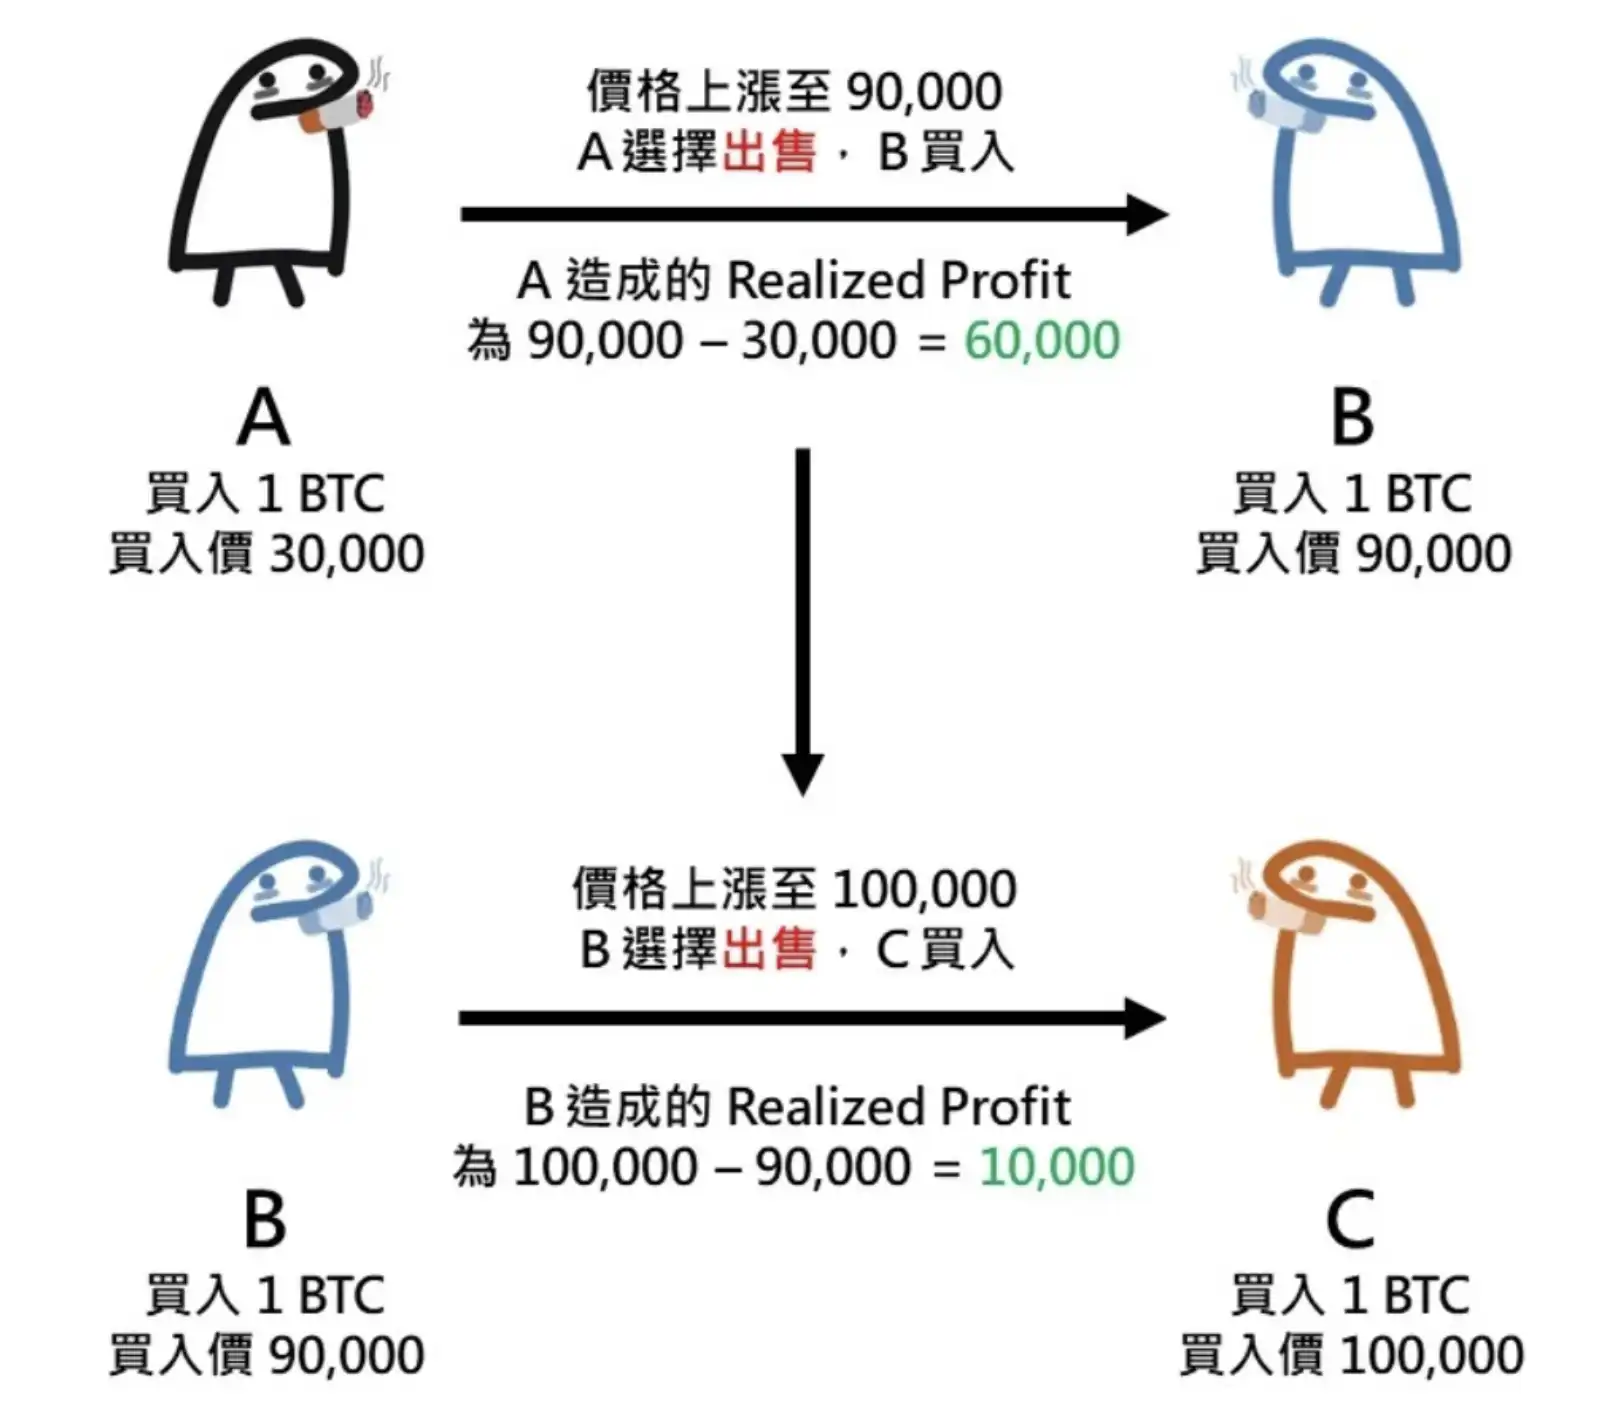
Realized Profit Calculation Diagram
The top is usually accompanied by a massive amount of Realized Profit
When a large number of low-cost chip holders sell their BTC, we will see a significant accumulation of realized profits on the chart.
At this time, since the remaining participants in the market are all high-cost buyers, the market price is relatively close to their cost price. Once the sentiment shifts slightly, it is easier for them to panic sell, causing a chain drop in prices and forming a top.
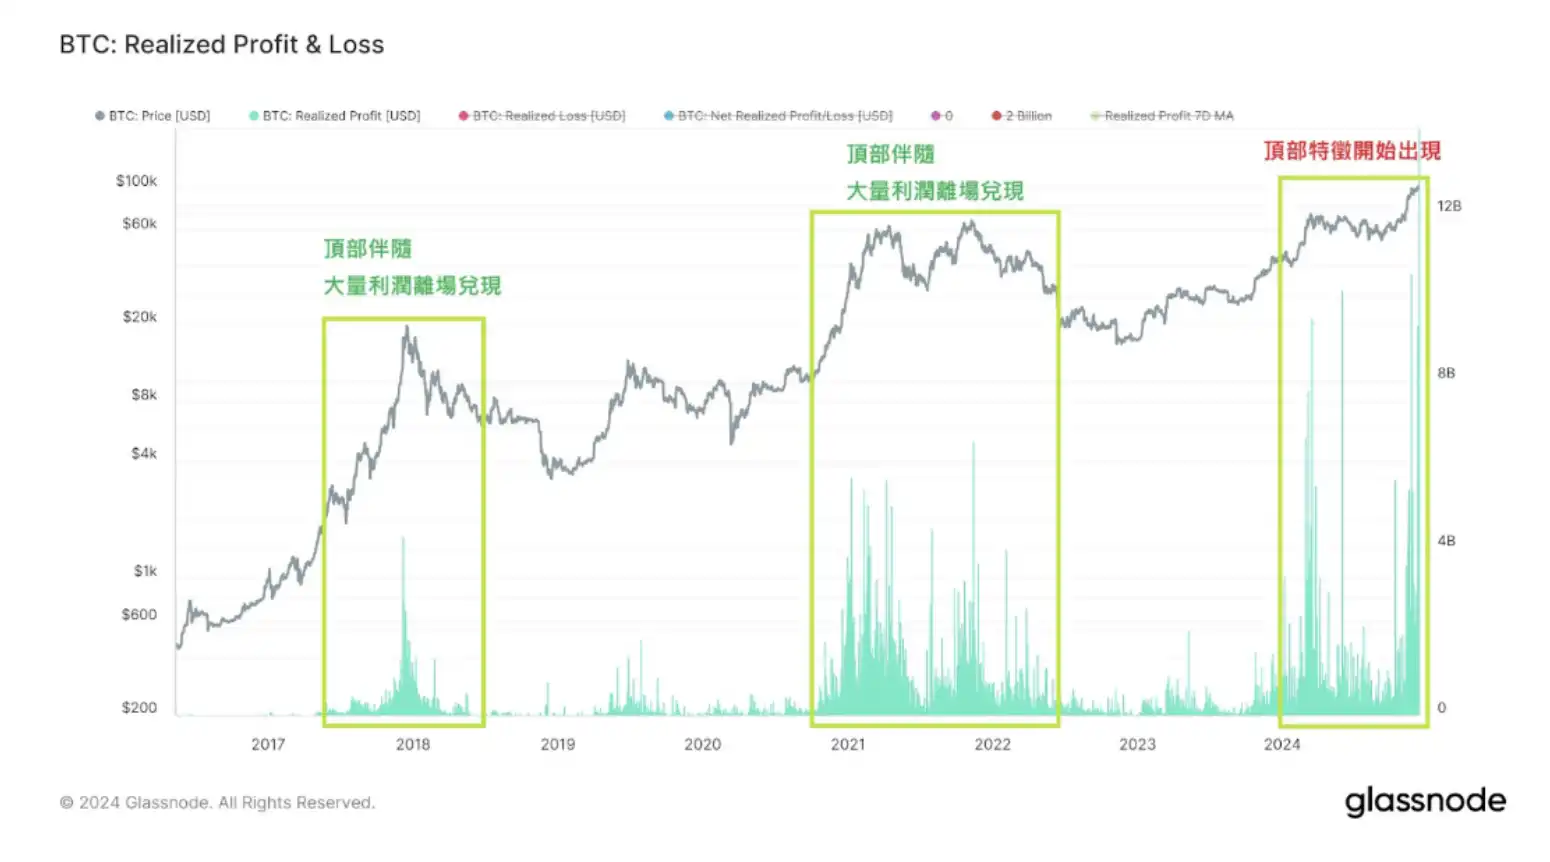
The top is usually accompanied by a huge amount of Realized Profit
Conclusion
The above is the complete content of the on-chain data school (3). Readers interested in further studying on-chain data analysis, be sure to follow this series of articles!
If you want to see more analysis and educational content about on-chain data, feel free to follow my Twitter (X) account!
I hope this article is helpful to you, thank you for reading.
Original link
:
Disclaimer: The information on this page may come from third parties and does not represent the views or opinions of Gate. The content displayed on this page is for reference only and does not constitute any financial, investment, or legal advice. Gate does not guarantee the accuracy or completeness of the information and shall not be liable for any losses arising from the use of this information. Virtual asset investments carry high risks and are subject to significant price volatility. You may lose all of your invested principal. Please fully understand the relevant risks and make prudent decisions based on your own financial situation and risk tolerance. For details, please refer to
Disclaimer.
