


$BNB
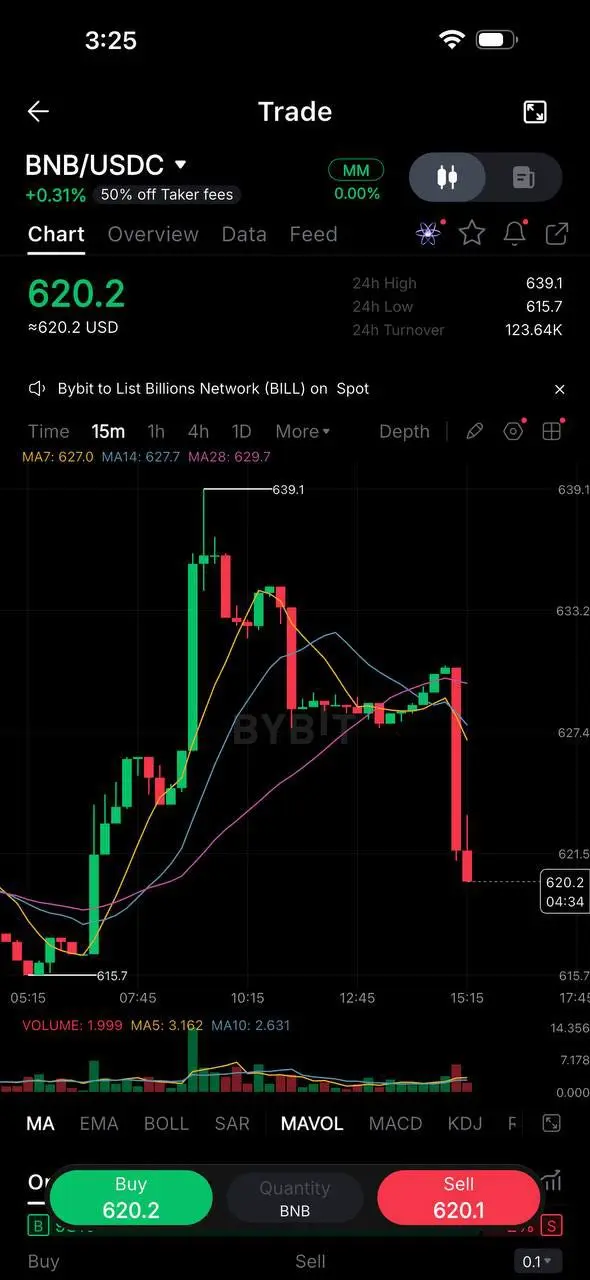
Looking at the 15-minute BNB/USDC chart, we just saw a sharp correction after that peak at 639.1. It’s a vivid reminder that the market doesn’t move in a straight line. Right now, we’re sitting at 620.2, testing a level that was previously a floor earlier this morning.
Moments like this are where the actual strategy happens. It’s less about chasing the high and more about watching how the price reacts to these old support zones. Are we looking at a temporary dip or a deeper shift?
I’m keeping a close eye on the volume here to see if the buyers step back in. If you’ve been waiting for a more grounded entry point than the morning’s rally, this might be the window you were looking for.
What’s your move when the red candles hit—do you see a discount or a reason to wait? Check the charts and let’s talk strategy in the comments.
#WCTCTradingKingPK