Futures
Access hundreds of perpetual contracts
TradFi
Gold
One platform for global traditional assets
Options
Hot
Trade European-style vanilla options
Unified Account
Maximize your capital efficiency
Demo Trading
Introduction to Futures Trading
Learn the basics of futures trading
Futures Events
Join events to earn rewards
Demo Trading
Use virtual funds to practice risk-free trading
Launch
CandyDrop
Collect candies to earn airdrops
Launchpool
Quick staking, earn potential new tokens
HODLer Airdrop
Hold GT and get massive airdrops for free
Pre-IPOs
Unlock full access to global stock IPOs
Alpha Points
Trade on-chain assets and earn airdrops
Futures Points
Earn futures points and claim airdrop rewards
BTC at high levels with hidden dangers: Above 75,000 is it takeoff or the final trap?
Current Price: 74,703
From the overall structure, BTC has completed a trend rise from 65,000 → 76,000, and is now entering a typical high-level sideways consolidation phase. The most critical question in the market now is:
Is this a buildup for a new high, or is it constructing a top?
Directly analyze the multi-cycle structure.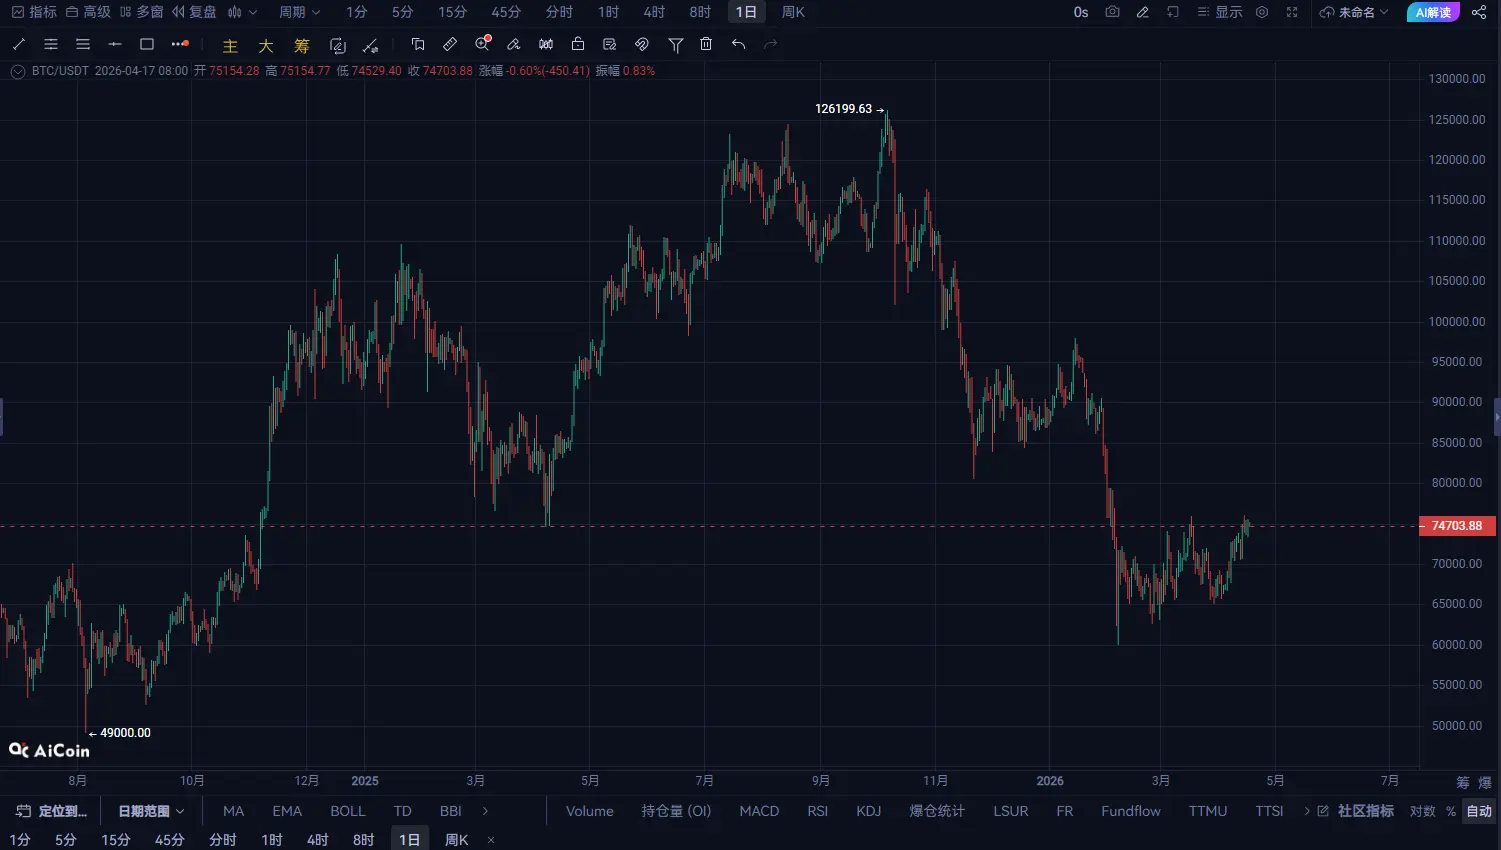
The daily trend is very standard:
65000 forms a phased bottom Then a continuous upward structure High point reaches 76,038 and faces resistance
Currently showing:
👉 High-level sideways + bullish trend not broken
But note an important signal:
👉 Several days in a row unable to effectively break through 76,000
Indicates:
Selling pressure above is beginning to appear Bullish momentum is weakening Daily conclusion: Trend: Bullish State: High-level oscillation
Key levels:
Support: 73,000 / 71,000 Resistance: 76,000 / 78,000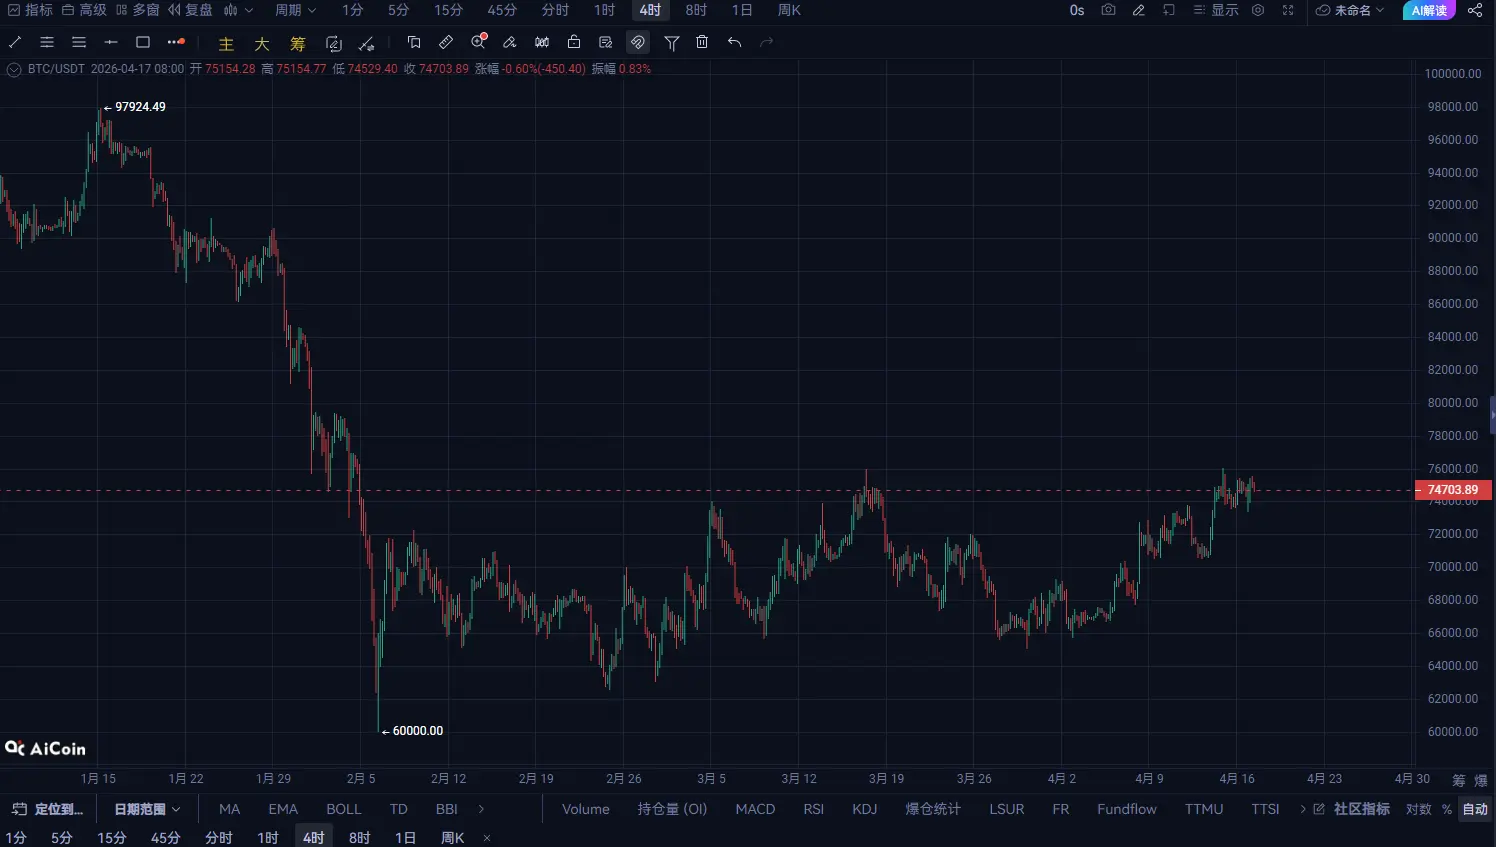 2. Four-hour Chart Level: Consolidation narrowing, trend reversal approaching
The four-hour structure is the current core:
Highs: Multiple rejections near 76,000 Lows: Gradually rising (72,000 → 73,500 → 74,000)
Forming a very typical structure:
👉 Triangle convergence
This means:
👉 Market is compressing volatility 👉 About to choose a direction
At the same time, we can see:
Pullbacks without volume decline Bulls still have support Four-hour conclusion:
Bias bullish consolidation, waiting for a breakout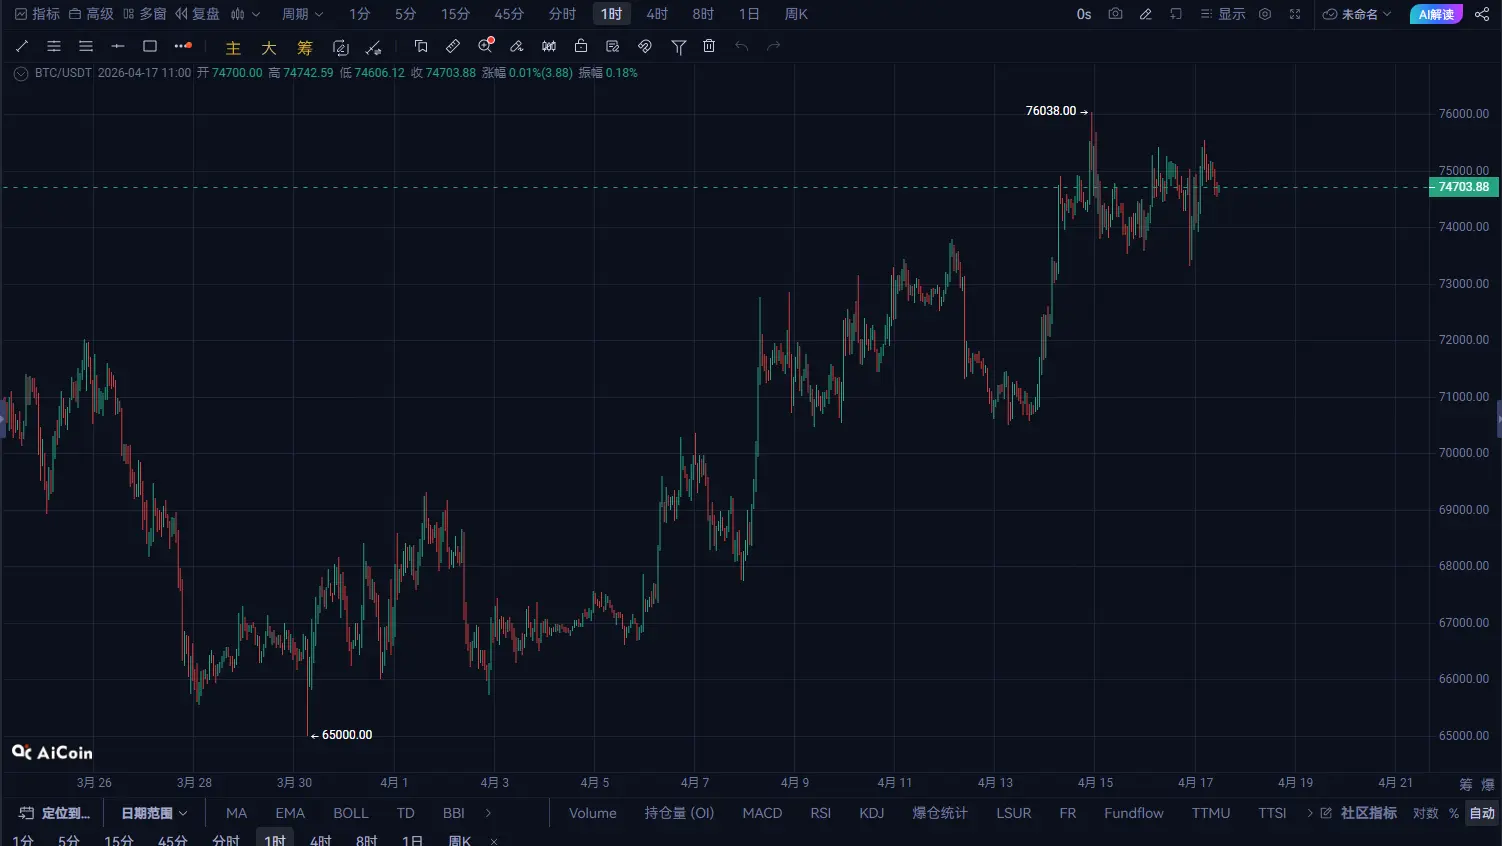
One-hour structure:
Range: 74,000 - 75,500 Multiple attempts to push higher and pull back But lows are rising continuously
This indicates:
👉 Bulls are gradually raising costs 👉 Bears cannot form effective suppression
But the key issue:
👉 No volume breakout
Critical trigger points:
Upside breakout:
Break through 75,500 and stabilize ➡️ Target: 76,000 → 78,000
Downside breakdown:
Fall below 74,000 ➡️ Target: 73,000 → 71,000 4. Core Logic Summary
Current BTC structure:
Daily: Uptrend Four-hour: Converging oscillation One-hour: Building momentum
👉 In essence, one sentence:
Trend is biased bullish, but a direction is being chosen
Stop-loss:
Fall below 72,000 2️⃣ Short strategy (short-term) Short near resistance at 76,000
Stop-loss:
Above 76,500
Target:
74,500 → 73,000
👉 Only do short-term shorts
3️⃣ Most taboo right now
❌ Frequently trading in the middle at 74,500 ❌ Chasing rallies and selling dips
The current market, in essence, is:
👉 High-level handover + re-distribution of chips
The oscillation you see is actually:
👉 Preparing for the next trend
BTC is not weak now, but:
👉 Calm before the storm.