Futures
Access hundreds of perpetual contracts
TradFi
Gold
One platform for global traditional assets
Options
Hot
Trade European-style vanilla options
Unified Account
Maximize your capital efficiency
Demo Trading
Introduction to Futures Trading
Learn the basics of futures trading
Futures Events
Join events to earn rewards
Demo Trading
Use virtual funds to practice risk-free trading
Launch
CandyDrop
Collect candies to earn airdrops
Launchpool
Quick staking, earn potential new tokens
HODLer Airdrop
Hold GT and get massive airdrops for free
Pre-IPOs
Unlock full access to global stock IPOs
Alpha Points
Trade on-chain assets and earn airdrops
Futures Points
Earn futures points and claim airdrop rewards
More
🚨【TON rises sharply then falls back! Is 1.51 a false breakout or the start of a new round?】🚨
Current Price: 1.423
First, the conclusion: 👉 In the short term, entering a high-level divergence zone means the risk of a pullback is increasing, but the trend hasn’t completely turned bad yet.
🧭 1. Daily Chart Level (Determines Direction)
From the daily chart, you can clearly see 👇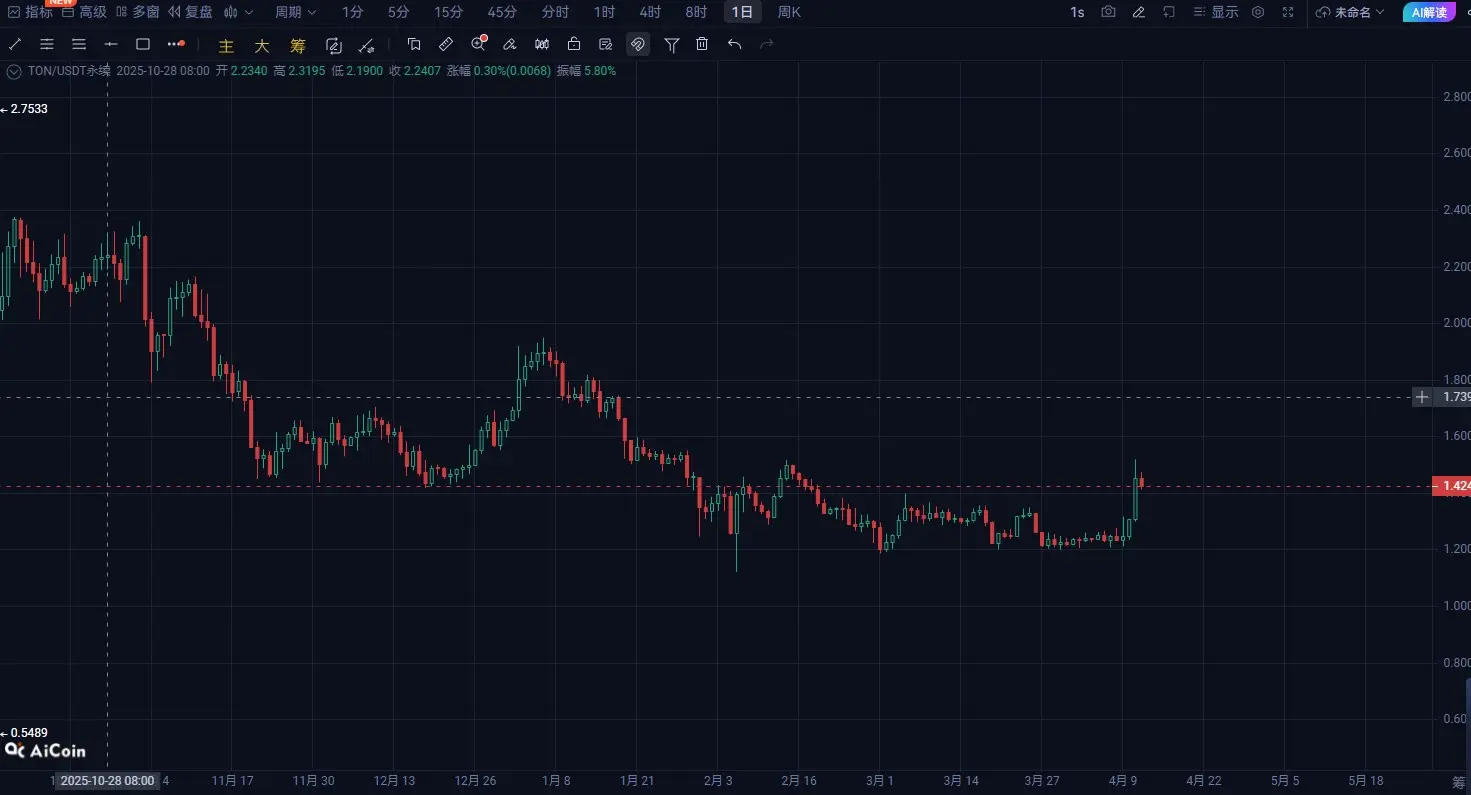
But the issue is also very clear: 👉 There has been a distinct surge-and-pullback in the high area (long upper wicks)
What does this mean? = Funds above have started to lock in profits
📌 Daily conclusion: The trend turning bullish is not a problem, but above 1.5 is a strong pressure zone, so it likely won’t break through easily in the short term
📊 2. 4-Hour Level (Determines Timing)
The 4-hour is the most critical cycle right now 👇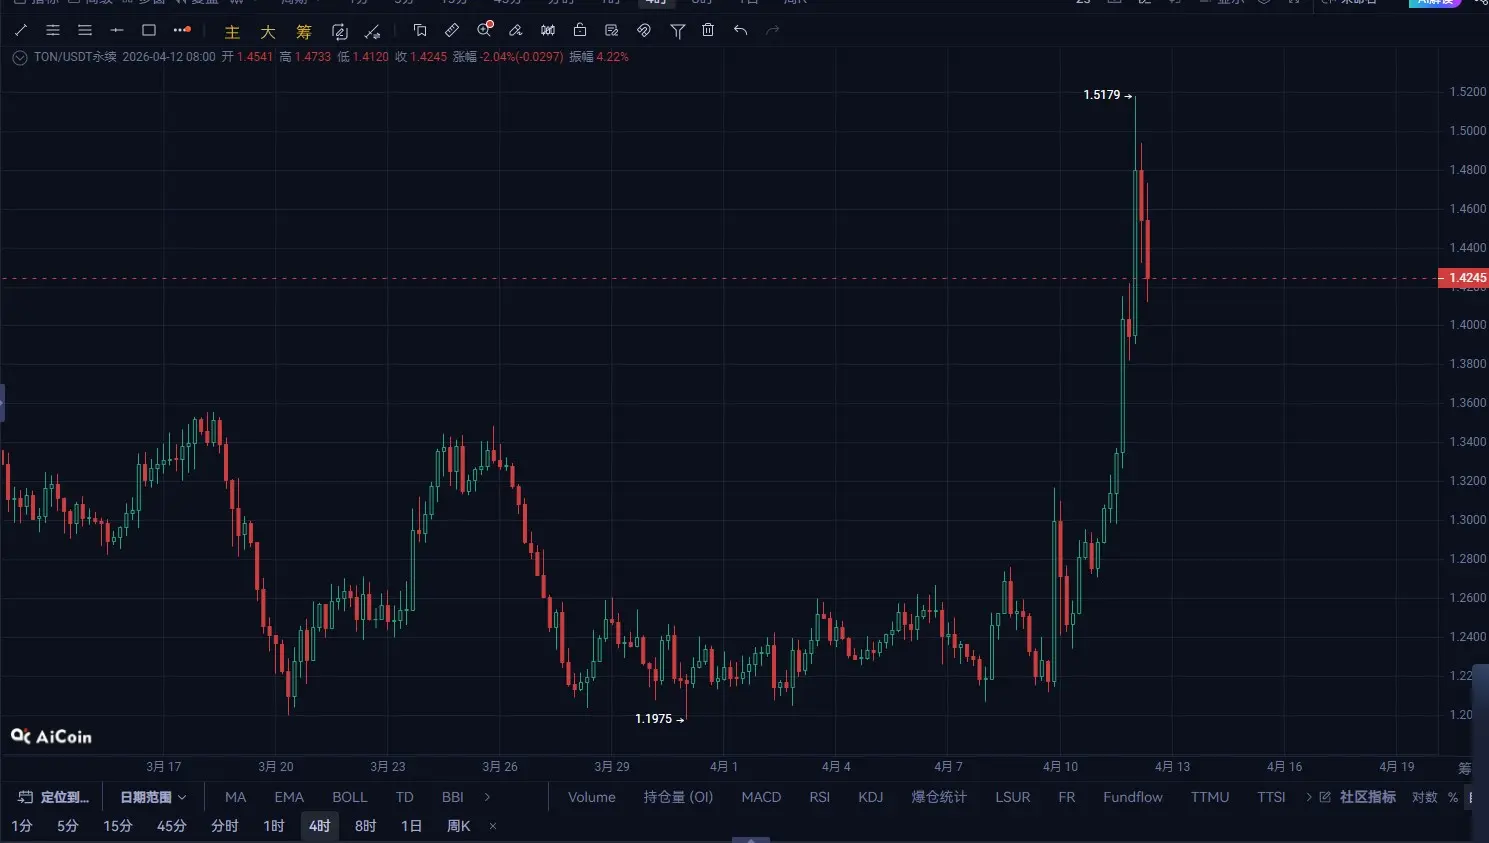
You’ll see a very typical structure: 👉 Accelerated rally → Volume spike at the top → Continuous pullback
Specific signals:
At the same time: 👉 This part of the move belongs to an “emotional rally,” not a steady push higher
📌 Key point: Current price is around 1.42, exactly sitting in the previous breakout level
📌 4-hour conclusion: If it doesn’t break 1.40, it can still be considered strong consolidation; once it breaks → there’s a high probability of a retest to 1.32
⏱ 3. 1-Hour Level (Determines Action)
For the short term, look at this 👇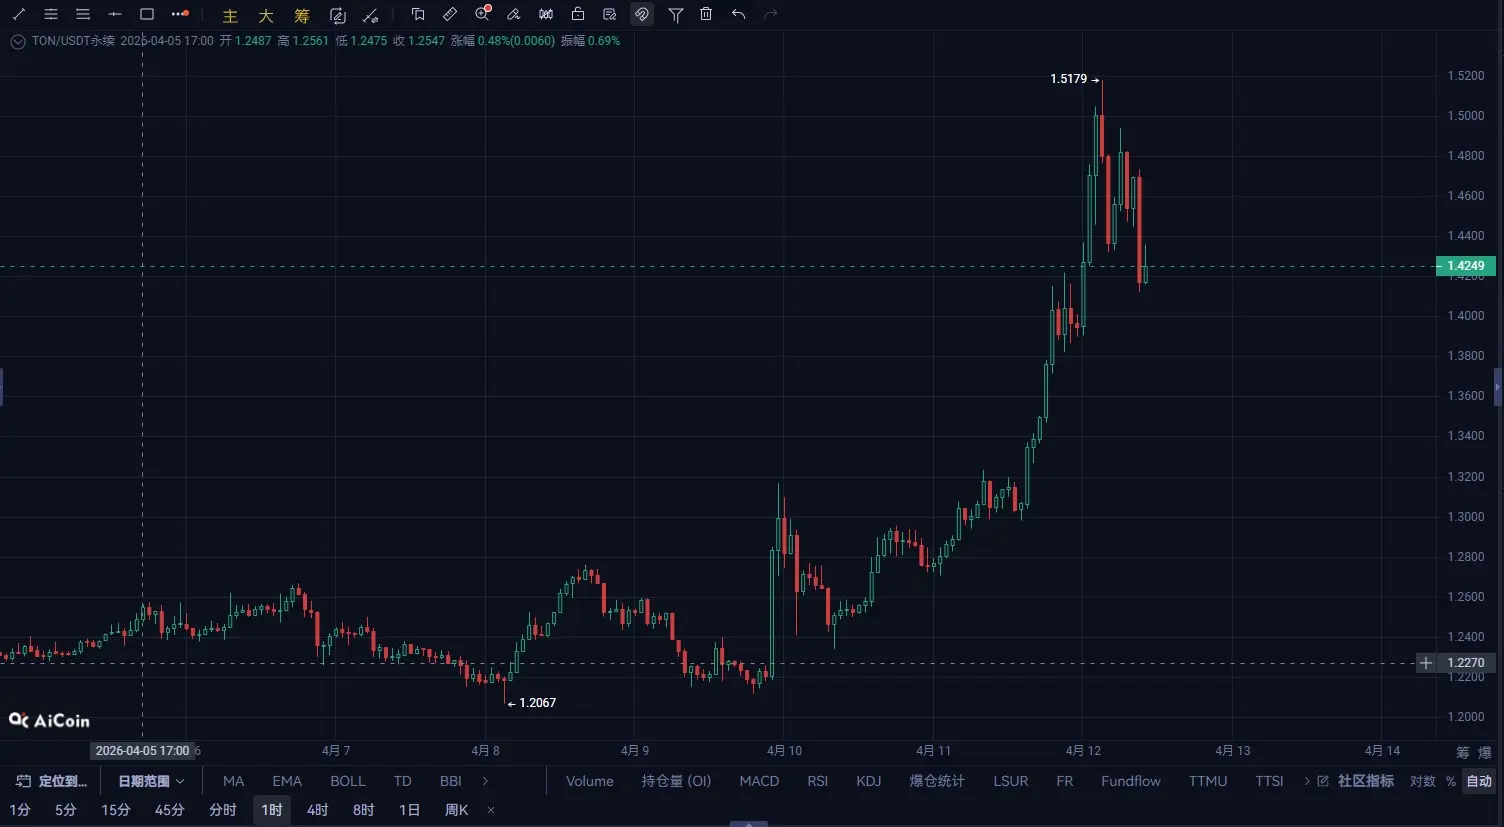
Right now, this is a typical scenario: 👉 A chance for you to exit during the rebound, not a chance to chase longs
📌 Key resistance: 1.45 - 1.47 📌 Key support: 1.40 / 1.35
📌 1-hour conclusion: Short-term is biased toward bearish chop, and the decline isn’t over yet
🎯 4. Today’s Trading Plan (April 12)
Let’s get straight to the point 👇
🟥 Short ideas (main approach)
👉 Logic: Pullback in the high area + fading bullish momentum
🟩 Long ideas (cautious)
👉 Prerequisite: Must see selling pressure ease and stabilization before acting
🧠 The last sentence (key point)
The essence of this market move is: 👉 The first shakeout after the rally ends
Many people will make mistakes here:
Remember one thing: Rallies rely on emotion; pullbacks rely on cognition.
Real pros don’t make money during the rise, but by surviving through the consolidation—making it through.