
Date: Fri, Dec 26, 2025 | 10:28 AM GMT
The broader cryptocurrency market is showing modest strength, with both Bitcoin (BTC) and Ethereum (ETH) trading in the green. This steady performance from the majors has helped stabilize overall market sentiment, allowing several altcoins to begin forming constructive technical structures including Virtuals Protocol (VIRTUAL).
VIRTUAL is currently trading slightly higher on the day, but the real story lies beneath the surface. The daily chart structure is beginning to hint at a potential shift in momentum, suggesting that sellers may be losing control as buyers quietly step back in.
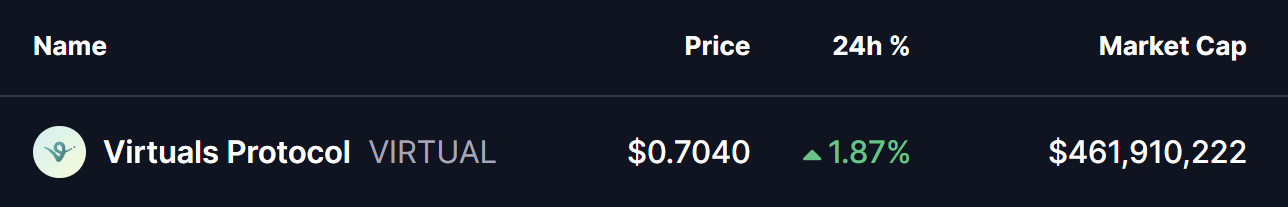
Source: Coinmarketcap
Falling Wedge Pattern Signals a Possible Reversal
On the daily timeframe, VIRTUAL is trading within a clearly defined falling wedge pattern. This structure is widely recognized as a bullish reversal formation, typically developing when selling pressure gradually weakens while price continues to make lower highs and lower lows within converging trendlines.
After several weeks of persistent downside, VIRTUAL found support around the $0.6518 level. This bounce marked an important reaction low and helped price recover toward the $0.7040 area. As seen on the chart, price is now pressing close to the wedge’s upper boundary, indicating that buyers are starting to challenge the prevailing downtrend.
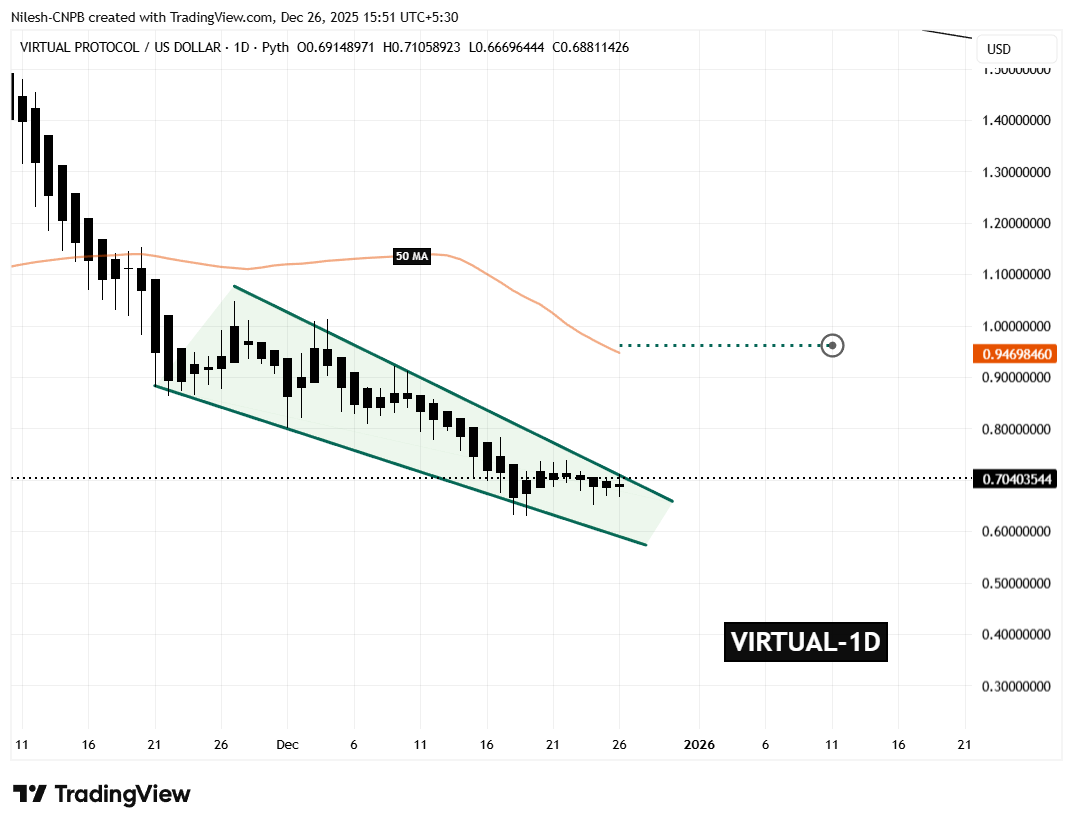
VIRTUAL Daily Chart/Coinsprobe (Source: Tradingview)
The compression within the wedge suggests that a decisive move may be approaching, with volatility likely to expand once price breaks out of the structure.
What’s Next for VIRTUAL?
A confirmed breakout above the falling wedge resistance, followed by a successful retest, would significantly improve the bullish outlook for VIRTUAL. In such a scenario, the first major area of interest lies near the 50-day moving average, currently positioned around $0.9469. This level also aligns closely with prior price congestion, increasing its technical importance.
Beyond that, the projected measured move from the wedge points toward a potential upside target near $0.962. Reaching this zone would represent a gain of more than 37% from current price levels, making it a notable recovery move if momentum accelerates.
On the flip side, failure to break above the wedge resistance could keep VIRTUAL range-bound. In that case, price may revisit the lower boundary of the wedge, where buyers would need to defend support to prevent a deeper retracement.
Disclaimer: The views and analysis presented in this article are for informational purposes only and reflect the author’s perspective, not financial advice. Technical patterns and indicators discussed are subject to market volatility and may or may not yield the anticipated results. Investors are advised to exercise caution, conduct independent research, and make decisions aligned with their individual risk tolerance.
Disclaimer: The information on this page may come from third parties and does not represent the views or opinions of Gate. The content displayed on this page is for reference only and does not constitute any financial, investment, or legal advice. Gate does not guarantee the accuracy or completeness of the information and shall not be liable for any losses arising from the use of this information. Virtual asset investments carry high risks and are subject to significant price volatility. You may lose all of your invested principal. Please fully understand the relevant risks and make prudent decisions based on your own financial situation and risk tolerance. For details, please refer to
Disclaimer.
Related Articles
Bitcoin Price Surges 10% Then Falls Into Bull Trap? Exchange Inflows Spike Draws Attention
Bitcoin price fluctuates at $70,700, with a monthly gain of approximately 10%. Both retail investors and whales are simultaneously accumulating Bitcoin, with capital inflows surging, yet this may bring selling pressure. The derivatives market shows bullish sentiment, but spot selling pressure could trigger forced liquidations. The key technical support level is at $70,700, and market dynamics require close monitoring.
GateNews14m ago
The bear market is causing another structural breakdown: What will happen next with WLD?
Worldcoin (WLD) experienced an impressive price rise on March 23, recovering 8.46% from a daily low. However, it struggled to maintain momentum after reaching $0.3296 and slipped back to around $0.3175, raising concerns about its future trend amidst a longer-term downtrend.
TapChiBitcoin16m ago
Stellar News: XLM Price Rises 14% Faces Resistance, Breakthrough of $0.1776 Could Trigger New Rally
Stellar (XLM) has risen 14% recently, approaching the Fibonacci resistance level of $0.1776, with buying pressure recovering. If it breaks through this resistance, it could advance toward $0.2010; if rejected, it may trigger liquidations. Watch key resistance levels and downside risks.
GateNews27m ago
Ethereum Whale Accumulation Ignites Rally Momentum, Is ETH About to Break Through $2400?
Due to continued accumulation by whales and tight market supply, Ethereum has formed support around $2100, with recent price rebounds to $2170, and is expected to potentially break through $2400 in the future. Network upgrades and quantum security technology enhancements boost investor confidence, with comprehensive bullish factors increasing.
GateNews30m ago
Why Did the Crypto Market Fall Today? US-Iran War Dampens Demand for Speculative Assets, Bitcoin and Altcoins Under Pressure
As of March 25, the cryptocurrency market capitalization was approximately $2.4 trillion, with overall stagnation. The US-Iran conflict elevated risk-averse sentiment, with Bitcoin price maintaining around $70,644. Ireland and Europol seized 500 Bitcoin. Technical analysis shows Bitcoin may face short-term pullback, with Decred also under downward pressure, as the market exhibits volatile trading.
GateNews34m ago
