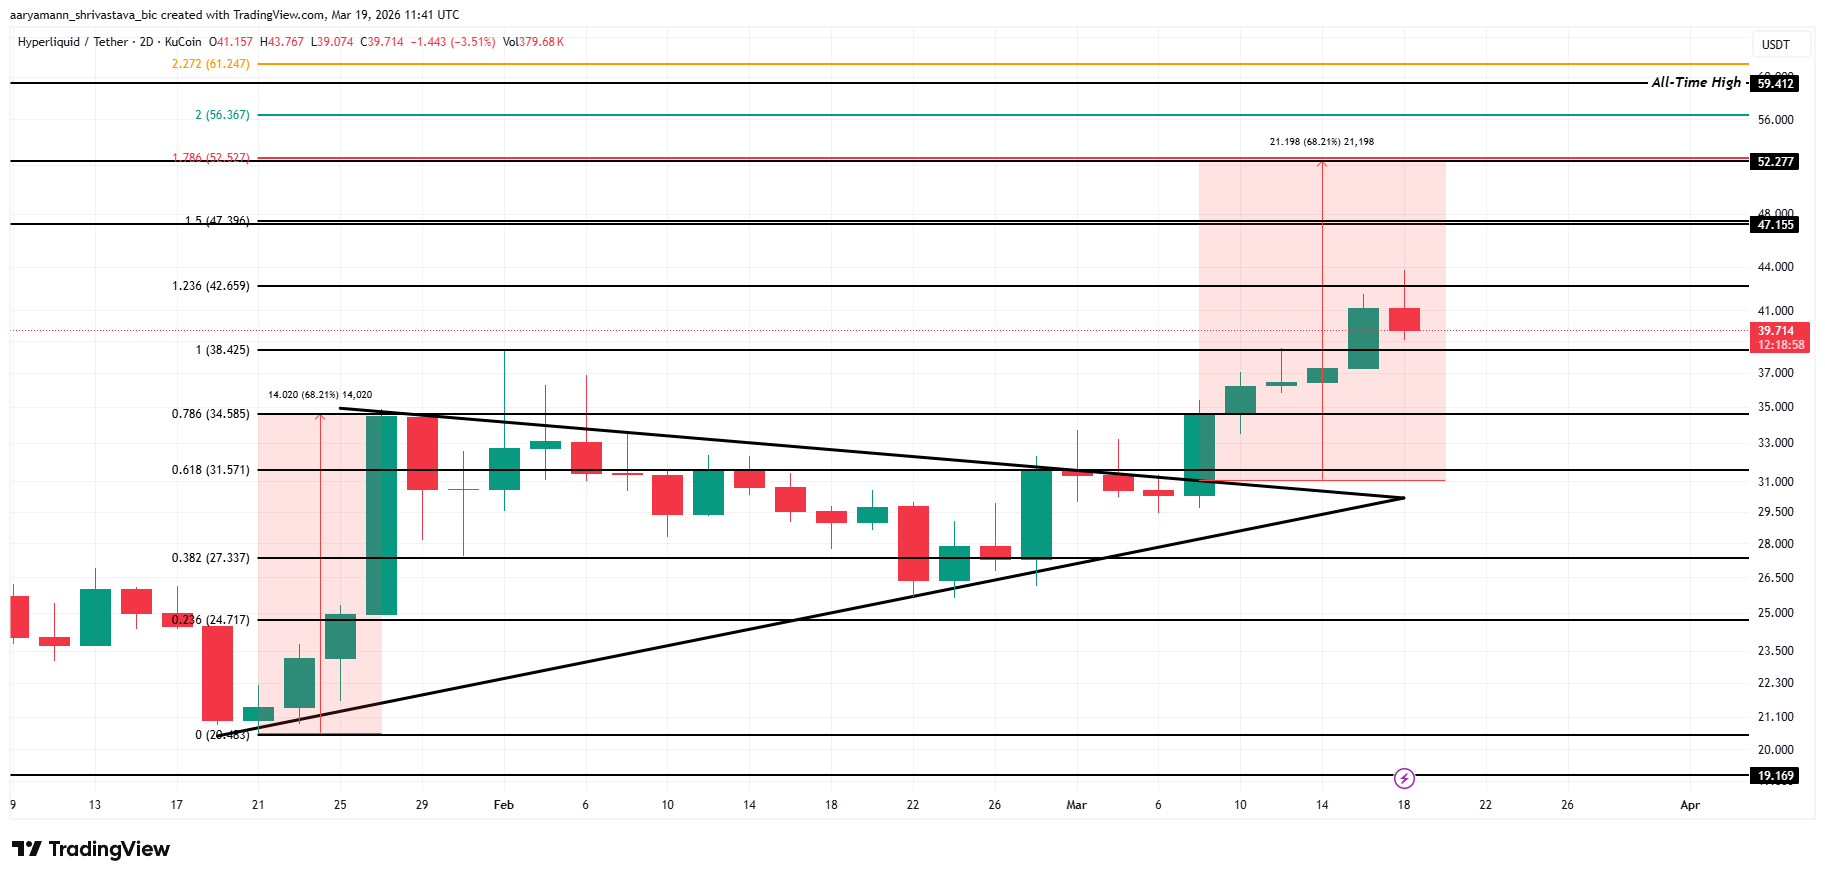
Hyperliquid (HYPE) is currently trading around $39.71 after breaking out of a multi-month symmetrical triangle pattern on the 2-day chart. The price target has been extended to $52.27, representing an increase of approximately 68% from the current level.
The breakout occurred after a prolonged consolidation phase between two converging trendlines since late January. Although HYPE has gained nearly 19% over the past week, a key momentum indicator is signaling a divergence with the bullish price structure.
Bearish Divergence Indicates Weakening Demand
The Chaikin Money Flow (CMF) indicator on the 2-day chart is at -0.08, below the neutral threshold of 0. This reflects capital outflows from HYPE, despite the price remaining near the $39 resistance zone.
Notably, the CMF is forming a bearish divergence compared to the price action. While HYPE has been making higher highs since early March, the CMF has been weakening along a downward trend since late January. This suggests the current rally may lack strong institutional support, raising doubts about sustaining momentum toward the $47–$52 zone.
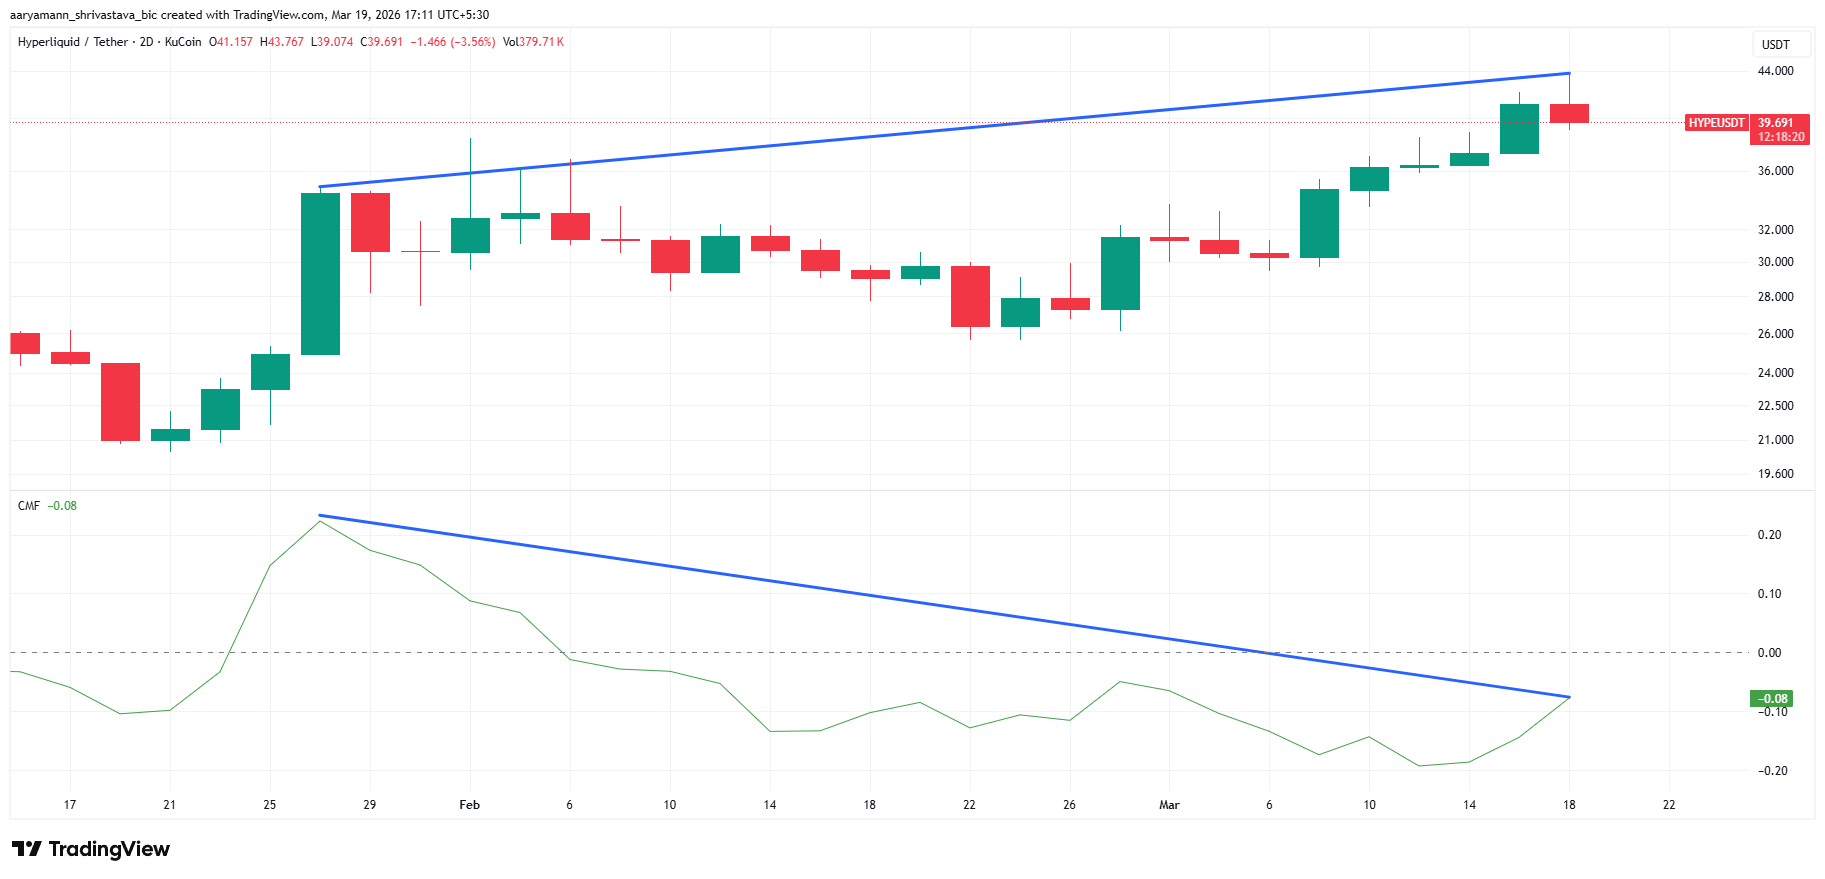 HYPE CMF Indicator | Source: TradingView To confirm an uptrend, the CMF needs to rise back above zero and stay stable. Until then, the current upward move is likely more liquidity-driven than genuine accumulation.
Short Liquidation Cluster: Catalyst or Barrier?
The liquidation map for the HYPE/USDT perpetual futures on Binance over the past 30 days shows a significant cluster of short liquidations concentrated between $45 and $48. At the $47 level, total short liquidation leverage is estimated at around $18.3 million.
This zone could act as a “magnet” for price. If HYPE breaks above the $43–$44 range with strong volume, the cascading short liquidations in the $45–$48 zone could trigger rapid buying pressure, accelerating the price increase. This area also has the highest liquidation density.
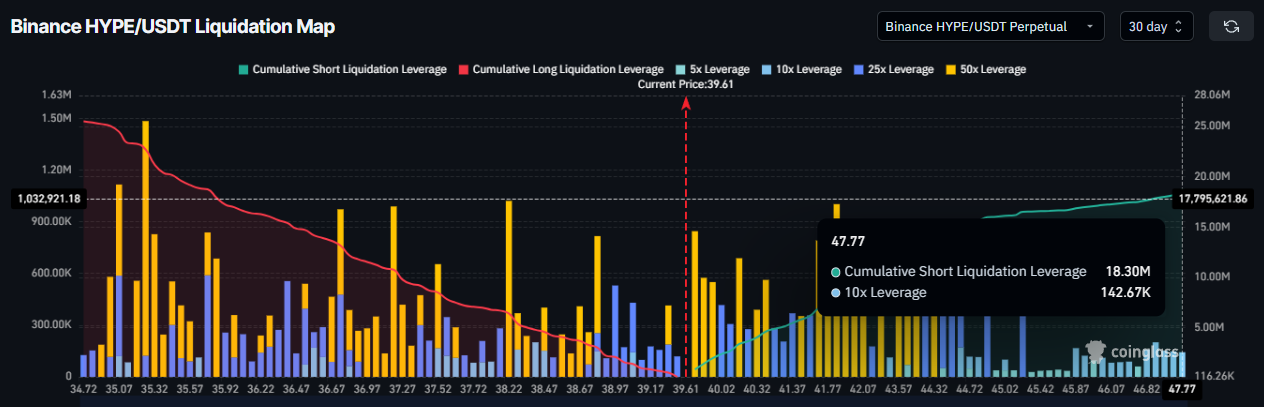 HYPE Liquidation Map | Source: Coinglass Conversely, the current price around $39.6 has seen a large amount of long positions being liquidated. This makes the area above temporarily more “clear,” but to reach the $45 zone, the price must decisively break through the resistance at $40–$43.
Key Level for Trend Direction
HYPE has completed a breakout from the symmetrical triangle pattern formed from mid-January to early March. The lower trendline acts as an ascending support from the $20.48 low, while the upper trendline has been resisting upward moves until it was broken.
According to technical analysis, the main target is at the Fibonacci extension level 1.786 at $52.27. An intermediate target at $47.40 (level 1.5) coincides with the large short liquidation cluster, reinforcing this zone as a key liquidity attractor.
 HYPE Price Analysis | Source: TradingView Additionally, Hyperliquid’s launch of a prediction market and options support in February 2026 could serve as a catalyst if overall market conditions turn favorable.
In the short term, the critical support level is at $38.42 (Fibonacci retracement 1.0). Holding this level, along with a CMF returning above zero, could open room for a rally toward $47.40. Conversely, losing this support would invalidate the breakout scenario, with a risk of price retreating to $34.59 (0.786 level). On the upside, the nearest resistance is at $42.66 (extension level 1.236), which must be surpassed before the market can target the $47 zone.
Disclaimer: The information on this page may come from third parties and does not represent the views or opinions of Gate. The content displayed on this page is for reference only and does not constitute any financial, investment, or legal advice. Gate does not guarantee the accuracy or completeness of the information and shall not be liable for any losses arising from the use of this information. Virtual asset investments carry high risks and are subject to significant price volatility. You may lose all of your invested principal. Please fully understand the relevant risks and make prudent decisions based on your own financial situation and risk tolerance. For details, please refer to
Disclaimer.
