In-Depth Breakdown of Bitcoin’s Move Toward the $70,000 Support Level and What Comes Next
Current Market Overview and Recent BTC Performance
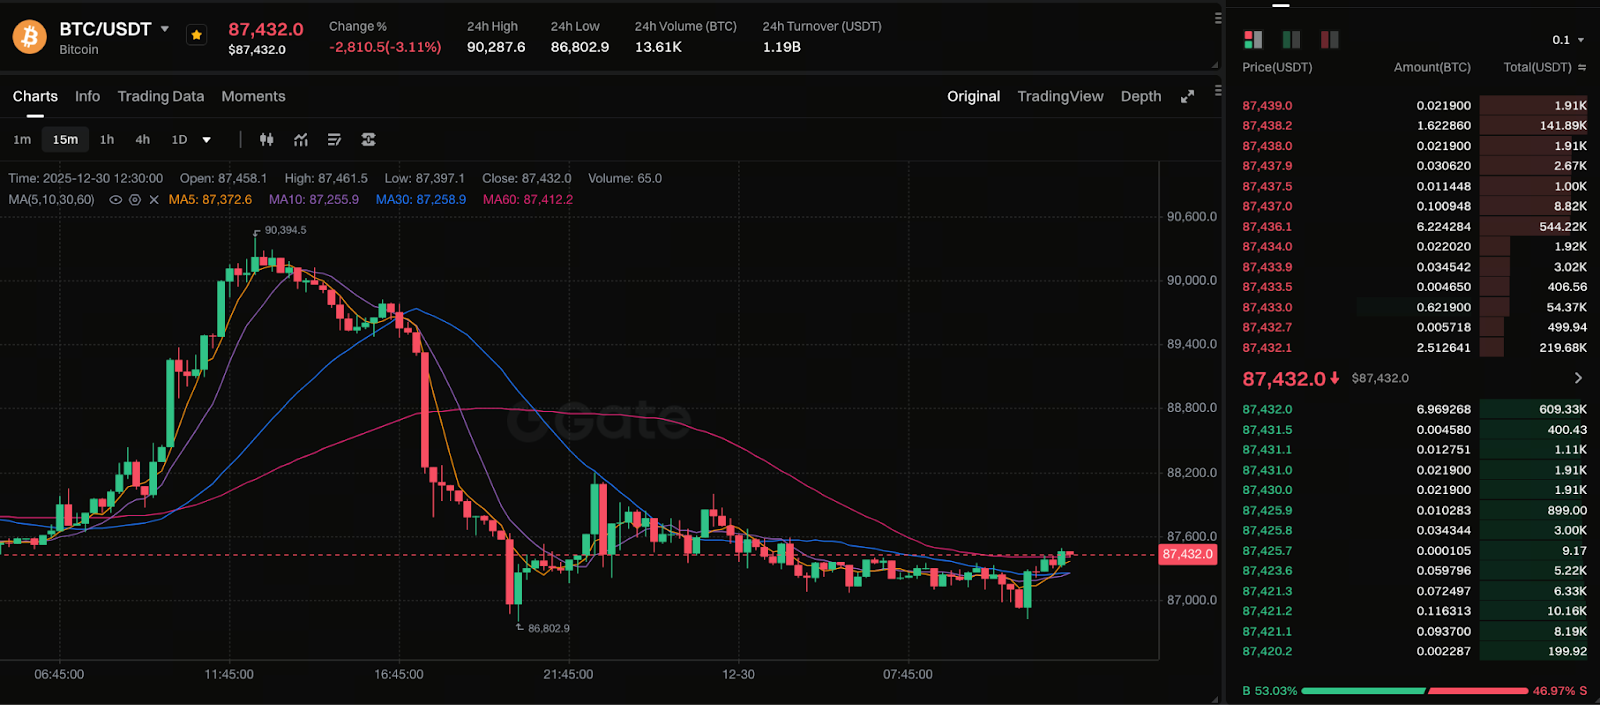
Chart: https://www.gate.com/trade/BTC_USDT
As of December 30, 2025, Bitcoin’s price has been consolidating in the $85,000 to $90,000 range. The market remains deeply divided on future direction. Some institutions and traders maintain that BTC has strong long-term upside potential. In contrast, other analysts argue a deeper correction would provide a healthier reset for the price structure.
Analyst Insights: Why a Pullback to $70K Is Possible
Analysts largely attribute the pullback scenario to technical signals in the current price structure. Market analyst CryptoOnchain noted on social media that Bitcoin is consolidating near a key high-volume trading zone. If BTC fails to break out or hold this area, there is a significant chance it could retest the $70,000 to $73,000 support level.
This price region has historically served as a major pivot, acting as both support and resistance in previous cycles. It is widely seen as a “support flip” zone. If the price revisits this level, market participants may see it as an opportunity for new buying positions.
Key Technical Indicator Analysis
Technically, the RSI is showing signs of divergence on certain timeframes, suggesting weakening momentum. Such signals often indicate that, without strong bullish momentum, the price could continue its structural correction. If BTC falls below the current high-volume trading zone, a further decline is possible.
Looking at trading volume, there has been significant historical activity around $70K. This level could serve as a strong accumulation support, but it may also increase short-term volatility. For traders, closely monitoring volume changes in this area is essential.
Market Divergence and Alternative Forecast Models
It’s important to note that analysts and institutions differ widely in their Bitcoin price forecasts. Some bullish models remain optimistic, projecting that BTC could reach higher levels in the coming months or years, with targets above $150,000 or even $250,000.
Meanwhile, experts applying Elliott Wave Theory suggest the current bull cycle may have ended, and that the market could enter a prolonged period of consolidation or correction. These perspectives tie directly to the $70K support zone.
How Investors Should Monitor Support Levels and Inflection Points
For long-term investors, major support levels serve not only as short-term price floors but also as critical areas for identifying trend reversals. Integrating capital management, risk controls, and macroeconomic variables—such as liquidity and interest rate expectations—can lead to a more comprehensive understanding of BTC’s price action.
During periods of extreme volatility, traders should pay close attention to shifts in market sentiment. Panic selling and FOMO (fear of missing out) can both intensify short-term price swings.
Conclusion
In conclusion, Bitcoin’s price trajectory cannot be summarized with a single outlook. Even if a short-term move down to the $70K range occurs, it should be viewed as a structural adjustment rather than a straightforward downtrend. Understanding these technical drivers and market behaviors will help investors approach future price volatility with greater rationality.
Share
Content


Related Articles

2025 BTC Price Prediction: BTC Trend Forecast Based on Technical and Macroeconomic Data

Flare Crypto Explained: What Is Flare Network and Why It Matters in 2025

How to Use a Crypto Whale Tracker: Top Tool Recommendation for 2025 to Follow Whale Moves

Pi Coin Transaction Guide: How to Transfer to Gate.com

What is N2: An AI-Driven Layer 2 Solution