Gate Research: BTC and ETH hold a low-range consolidation as dense moving-average breakout strategies capture structural opportunities
Market Overview
To systematically present the current capital behavior and structural changes in the cryptocurrency market, this report examines five key dimensions: the price volatility of Bitcoin and Ethereum, the long–short ratio (LSR), the size of futures open interest, funding rates, and liquidation data. Together, these indicators cover price trends, capital sentiment, and risk conditions, providing a comprehensive view of the market’s trading intensity and structural characteristics. The following sections analyze the latest developments in each metric since December 9:
1. Bitcoin and Ethereum Price Volatility Analysis
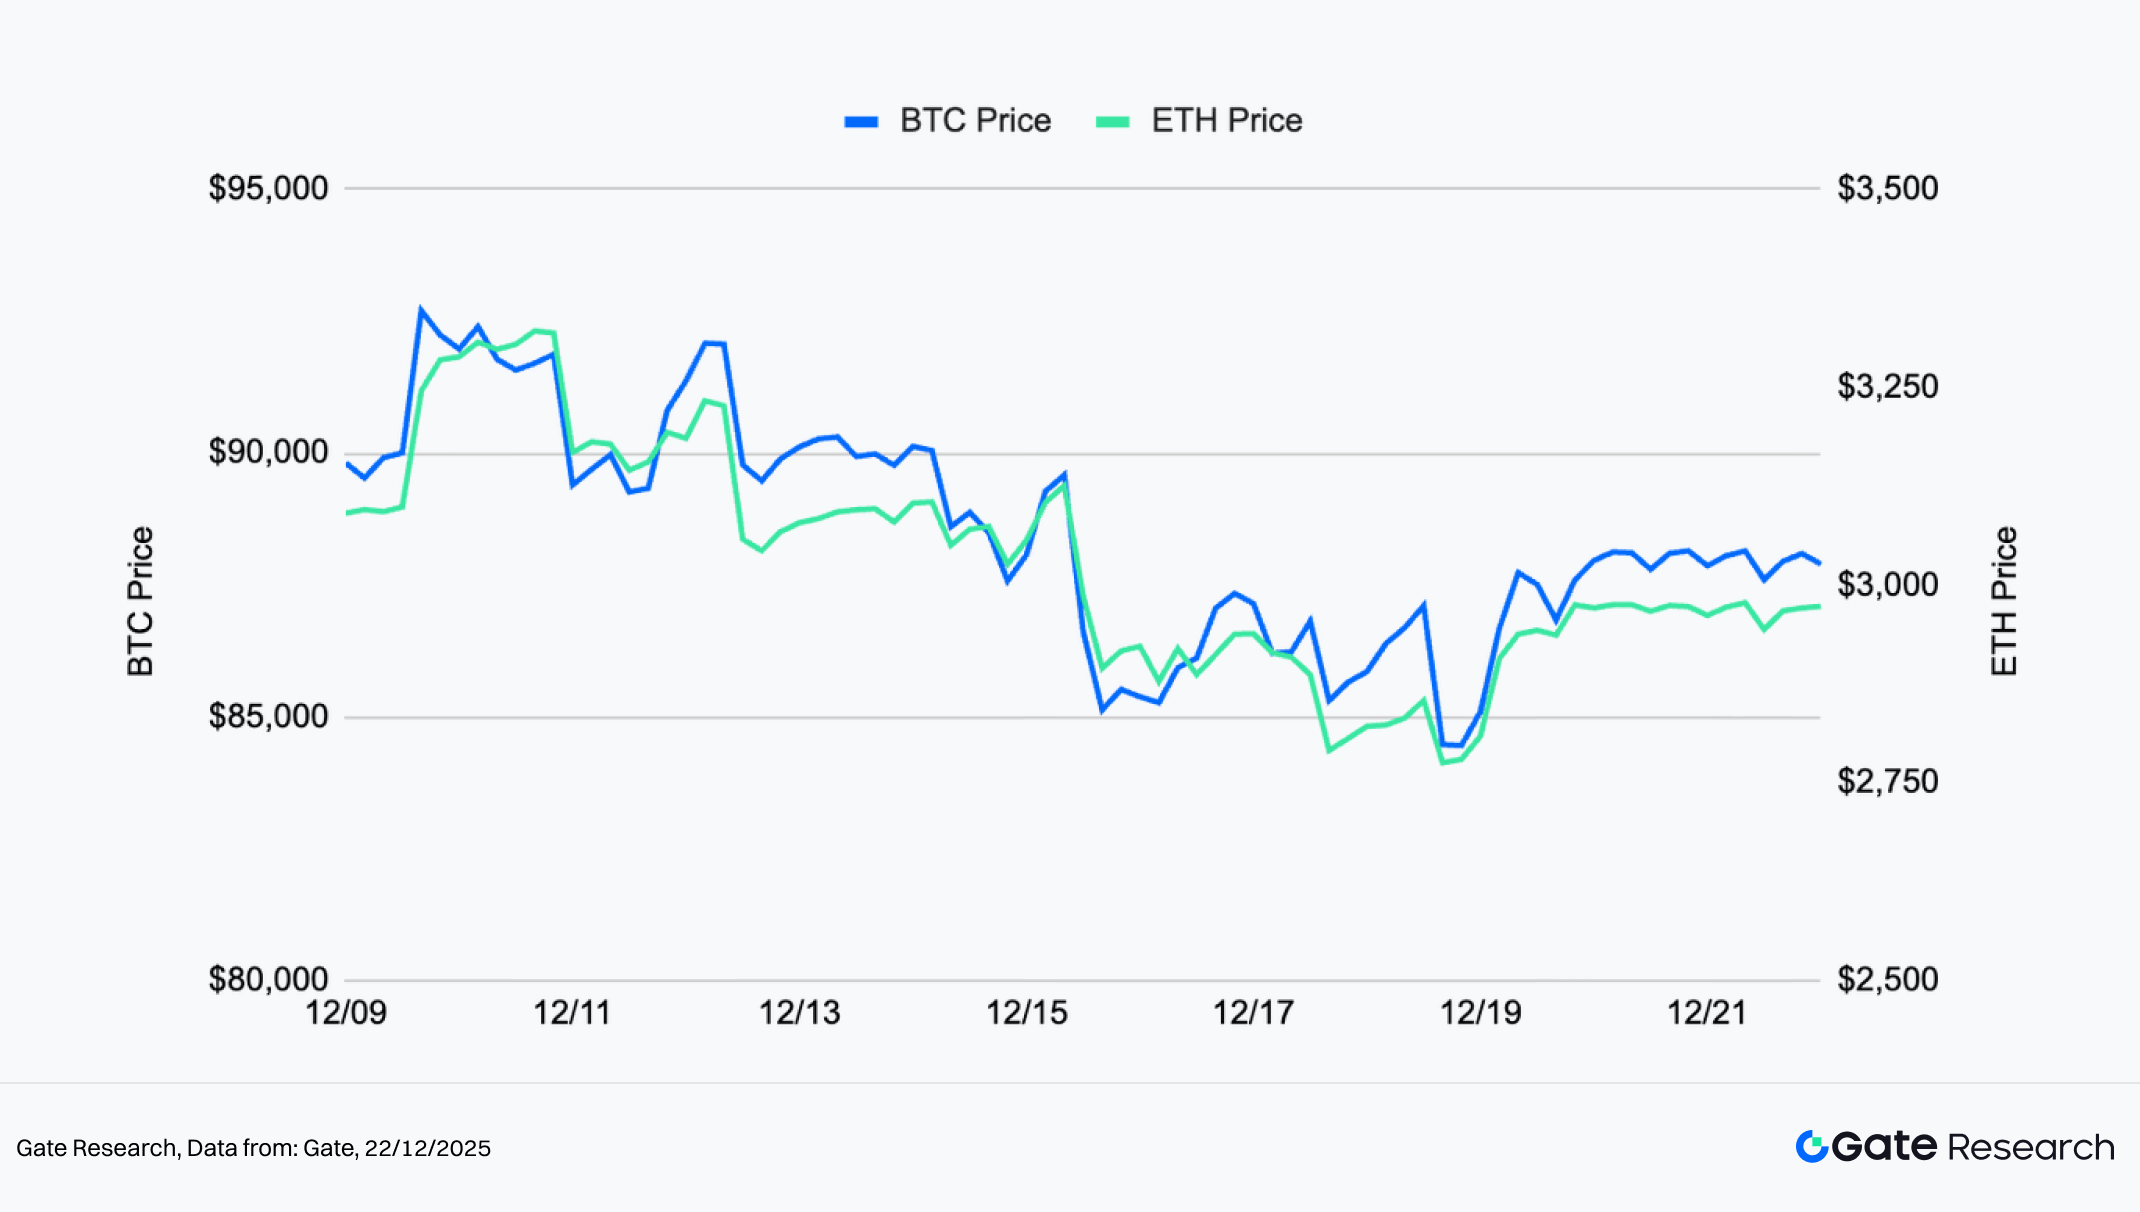
According to CoinGecko, during the period from December 9 to December 22, BTC and ETH exhibited a weak recovery following a phase of volatile downside movement, with price anchors shifting notably lower compared to previous highs and overall market sentiment remaining cautious. BTC initially attempted to break higher but quickly retraced and entered a choppy consolidation pattern; several rebound attempts were repeatedly capped by overhead resistance, failing to produce a meaningful trend reversal and instead remaining characteristic of a technical repair within a lower trading range. ETH largely mirrored BTC’s trajectory but with a steeper downside gradient. Throughout the decline, ETH repeatedly broke short-term support levels, and subsequent rebounds lagged in rhythm and magnitude, reflecting comparatively weaker performance than BTC.【1】【2】【3】
Structurally, both assets experienced a pronounced volume-driven sell-off mid-period, then stabilized at lower levels and transitioned into horizontal consolidation. However, rebound amplitudes remained limited, indicating insufficient buying demand. ETH saw several technical bounce attempts near local lows but failed to alter the overarching bearish alignment, with muted signs of capital re-entry. BTC held relatively firmer by comparison, but its rebounds similarly lacked follow-through and were largely driven by short-covering rather than proactive accumulation.
Overall, BTC and ETH have yet to break free from post-correction consolidation, with price action continuing to lean toward weak-to-neutral oscillation. In the absence of fresh capital inflows and clear directional signals, upside potential appears constrained in the short term, and price behavior is expected to remain range-bound until key resistance areas are decisively breached, which would be necessary to confirm a structural turn toward strength.
Figure 1: After retreating from recent highs, BTC and ETH entered synchronized weak consolidation, with shallow rebound slopes and trends dominated by corrective oscillation.
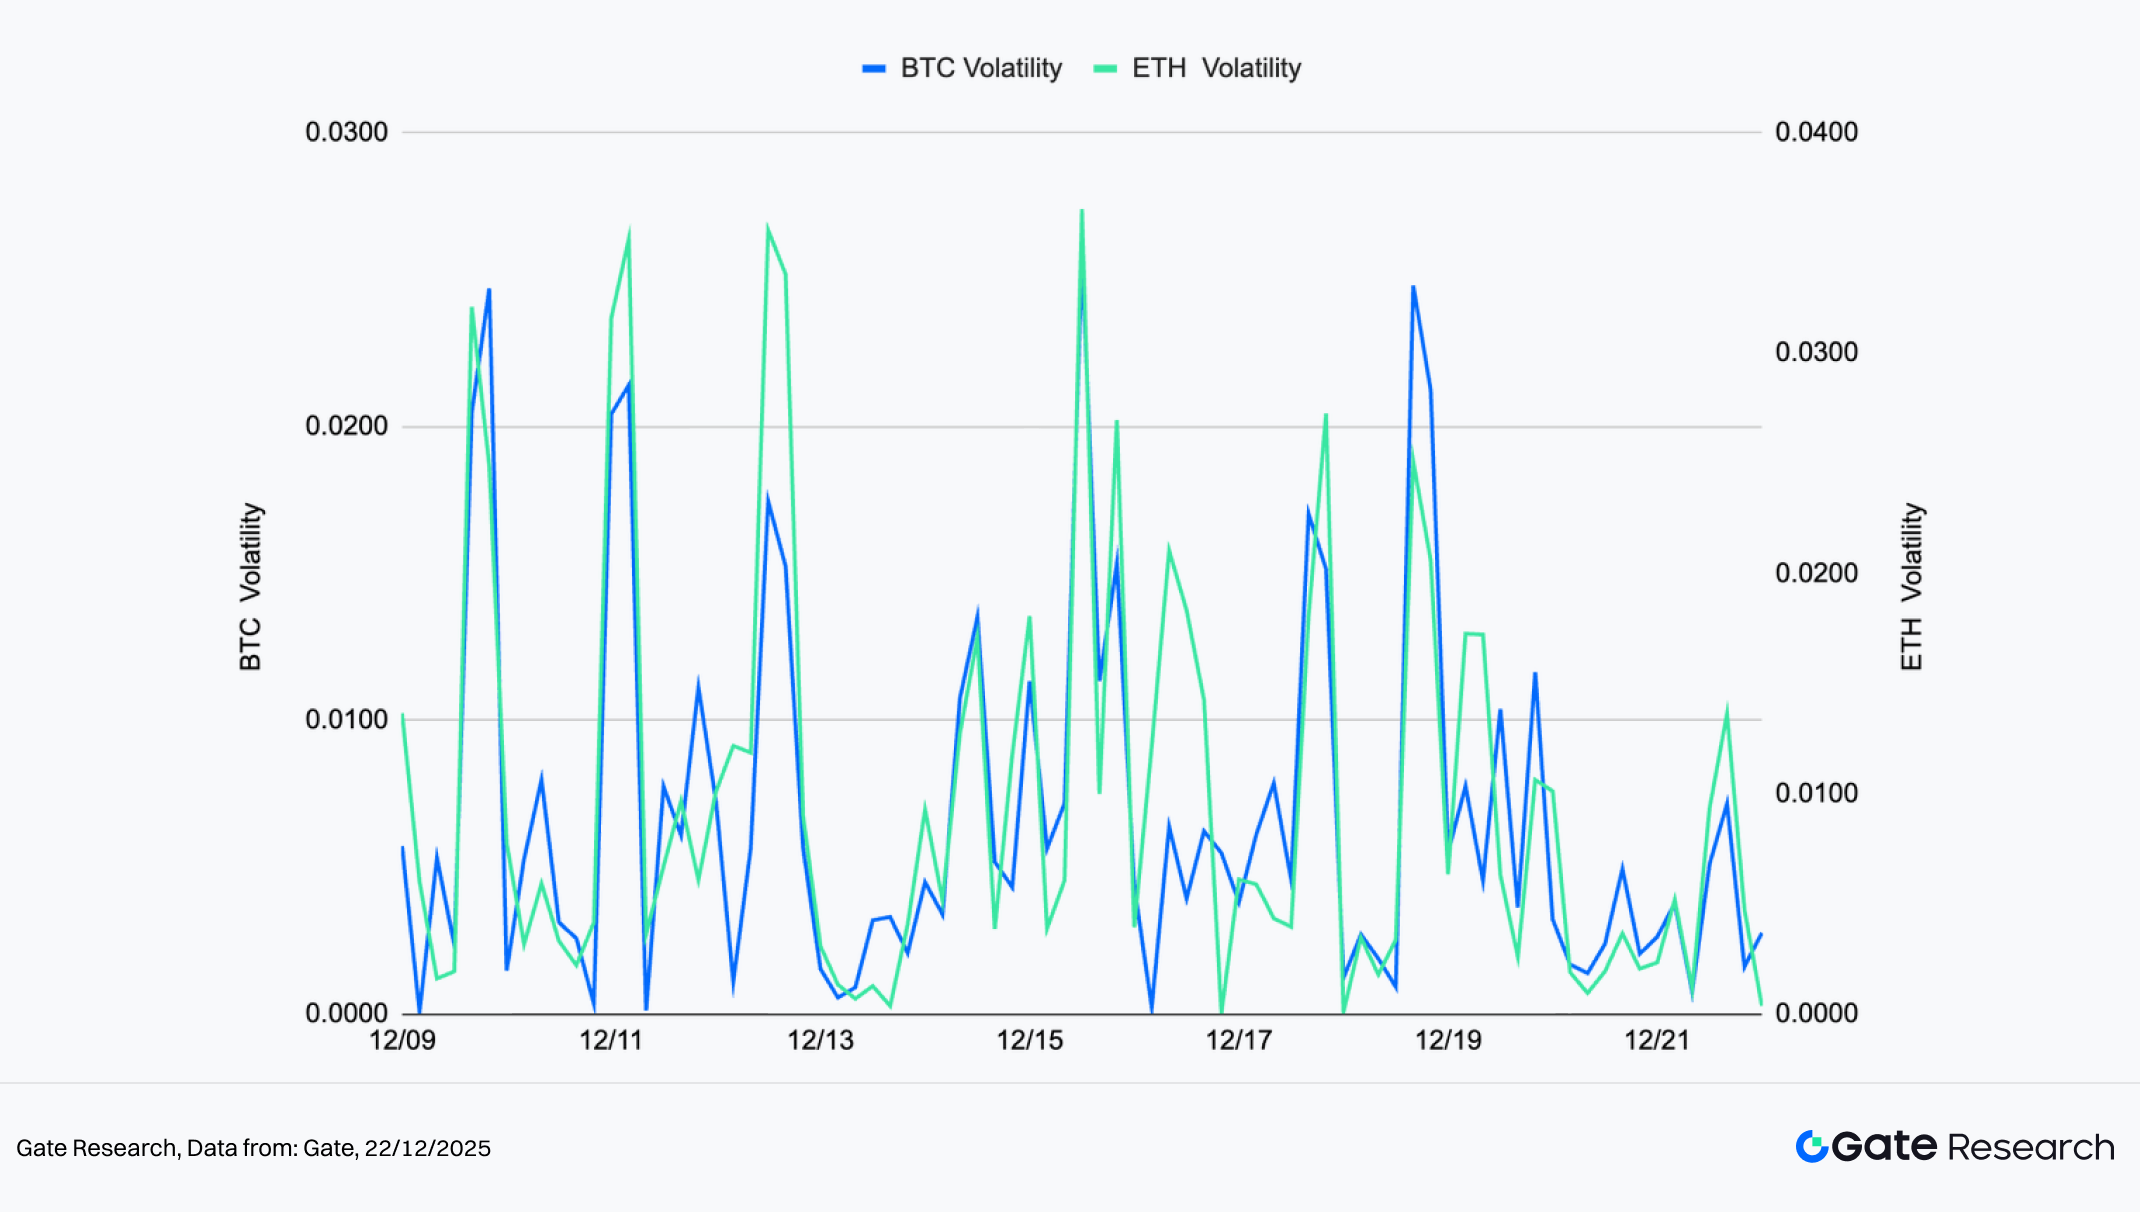
BTC and ETH’s short-term volatility remained characterized by high-frequency fluctuations, with multiple episodes of sharp intraday spikes. However, there was a clear divergence in volatility intensity between the two. BTC’s volatility, measured on the left axis, oscillated frequently but within a comparatively contained range, suggesting a more restrained emotional response from the market during price swings. In contrast, ETH’s volatility spikes were more aggressive, repeatedly registering higher peaks that signaled denser short-term capital turnover and a more sensitive sentiment environment.
Structurally, ETH’s volatility expansions often coincided with abrupt price drops or rapid rebounds, suggesting a higher proportion of speculative and short-duration trading activity. BTC’s volatility rose concurrently, but remained more controlled, indicative of tactical positioning near key price zones rather than disorderly sentiment-driven swings.
In summary, the current market environment remains active in volatility but lacking in clear directional conviction. ETH’s elevated volatility profile implies that short-term risks and opportunities coexist, while BTC’s relatively subdued volatility reflects a cautious stance among dominant capital. A synchronized rise in volatility for both assets, accompanied by expanding trading volume, would be a stronger signal for the potential initiation of a new directional trend.
Figure 2: BTC volatility remains comparatively contained with lower peaks, while ETH volatility shows repeated expansions, reflecting heightened short-term sentiment sensitivity.
2. Analysis of Long/Short Taker Size Ratio (LSR) for Bitcoin and Ethereum
The Long/Short Taker Size Ratio (LSR) is a key indicator that measures the volume of aggressive buying versus aggressive selling, often used to gauge market sentiment and trend strength. An LSR greater than 1 indicates that the volume of market buys (aggressive longs) exceeds that of market sells (aggressive shorts), suggesting a bullish market bias.
According to Coinglass, from December 9 to December 22, the Long/Short Ratio (LSR) of BTC and ETH fluctuated around the 1.0 level without exhibiting a persistent directional skew, indicating that leveraged capital remains primarily focused on short-term trading and range-bound speculation rather than committing to trend-driven positioning. The current LSR dynamics reflect frequent sentiment rotation rather than the accumulation of directional leverage.【5】
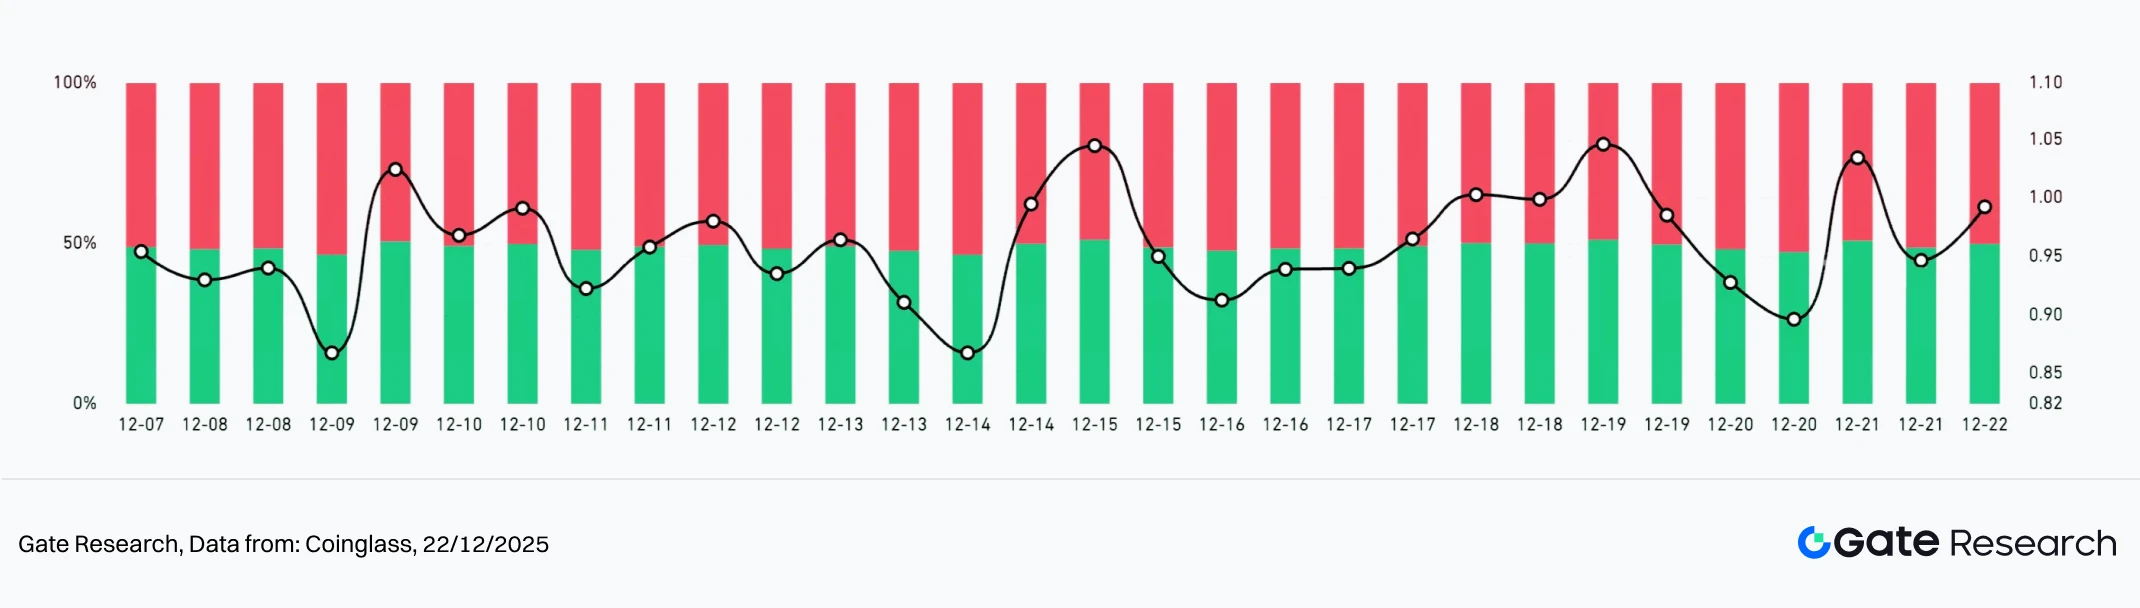
Structurally, BTC’s LSR range was comparatively narrow, holding mostly within 0.95–1.05, which suggests a cautious stance among dominant market participants. ETH’s LSR, by contrast, displayed wider amplitude, frequently dipping toward 0.90 and rebounding to approximately 1.05, implying a higher proportion of short-term leveraged and sentiment-driven capital and a noticeably stronger sensitivity to price fluctuations relative to BTC.
Overall, BTC and ETH LSR are more suitable as sentiment indicators in a range-bound market environment. Rising LSR levels often correspond to short-term rebounds, whereas declines toward lower bounds tend to align with temporary stabilization or localized pullbacks. However, in the absence of sustained extreme readings, price action is likely to remain confined within a range, favoring contrarian sentiment strategies and range-based trading approaches rather than trend continuation setups.
Figure 3: BTC’s LSR remains anchored within 0.95–1.05, indicating a cautious stance among dominant capital.
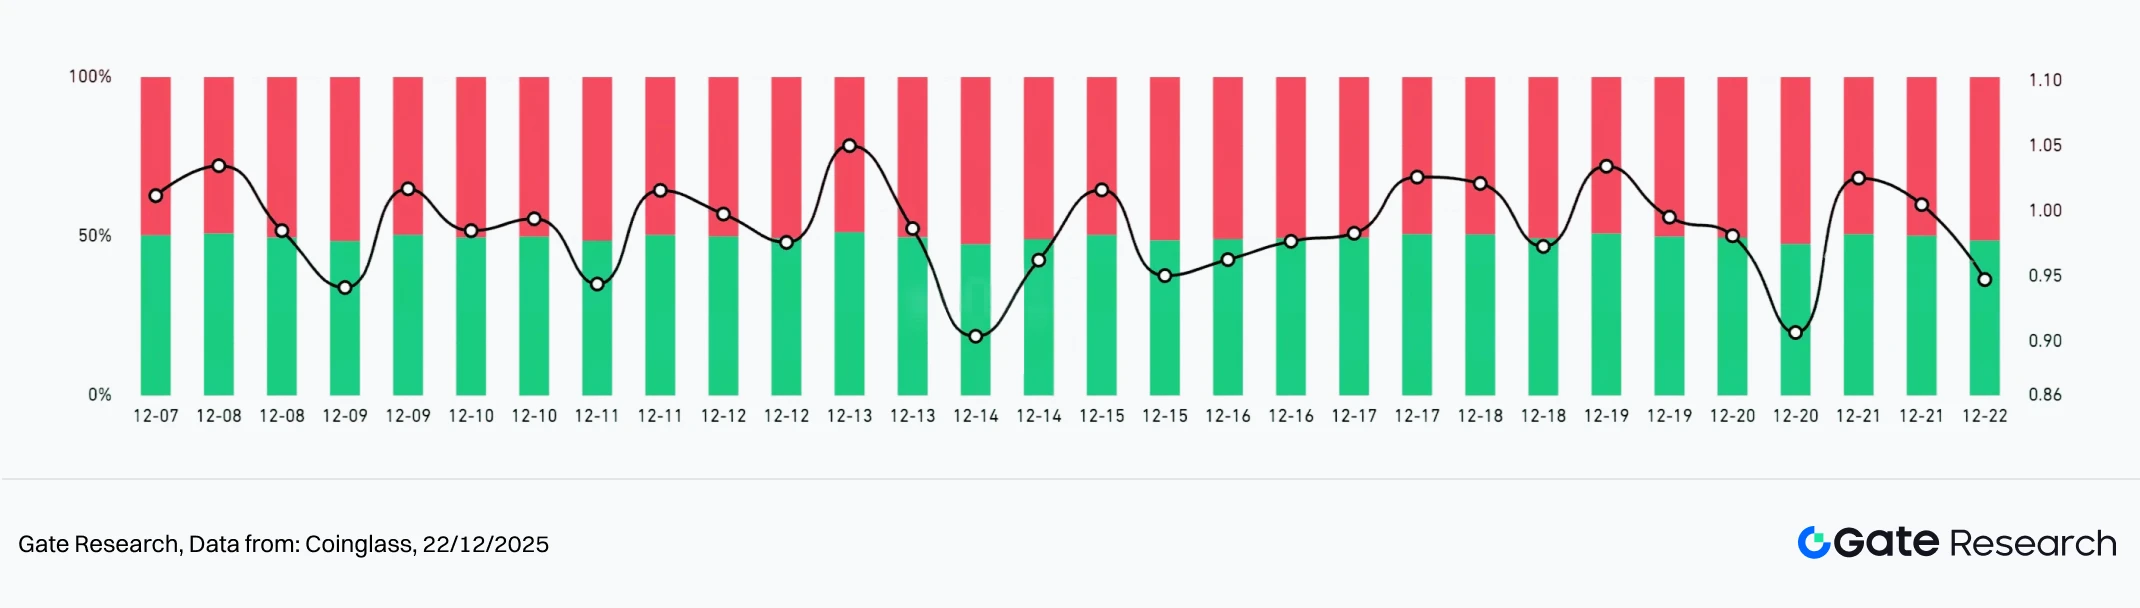
Figure 4: ETH’s LSR exhibits larger fluctuations, signaling a higher share of short-term leveraged participation and stronger sensitivity to price swings compared to BTC.
3. Open Interest Analysis
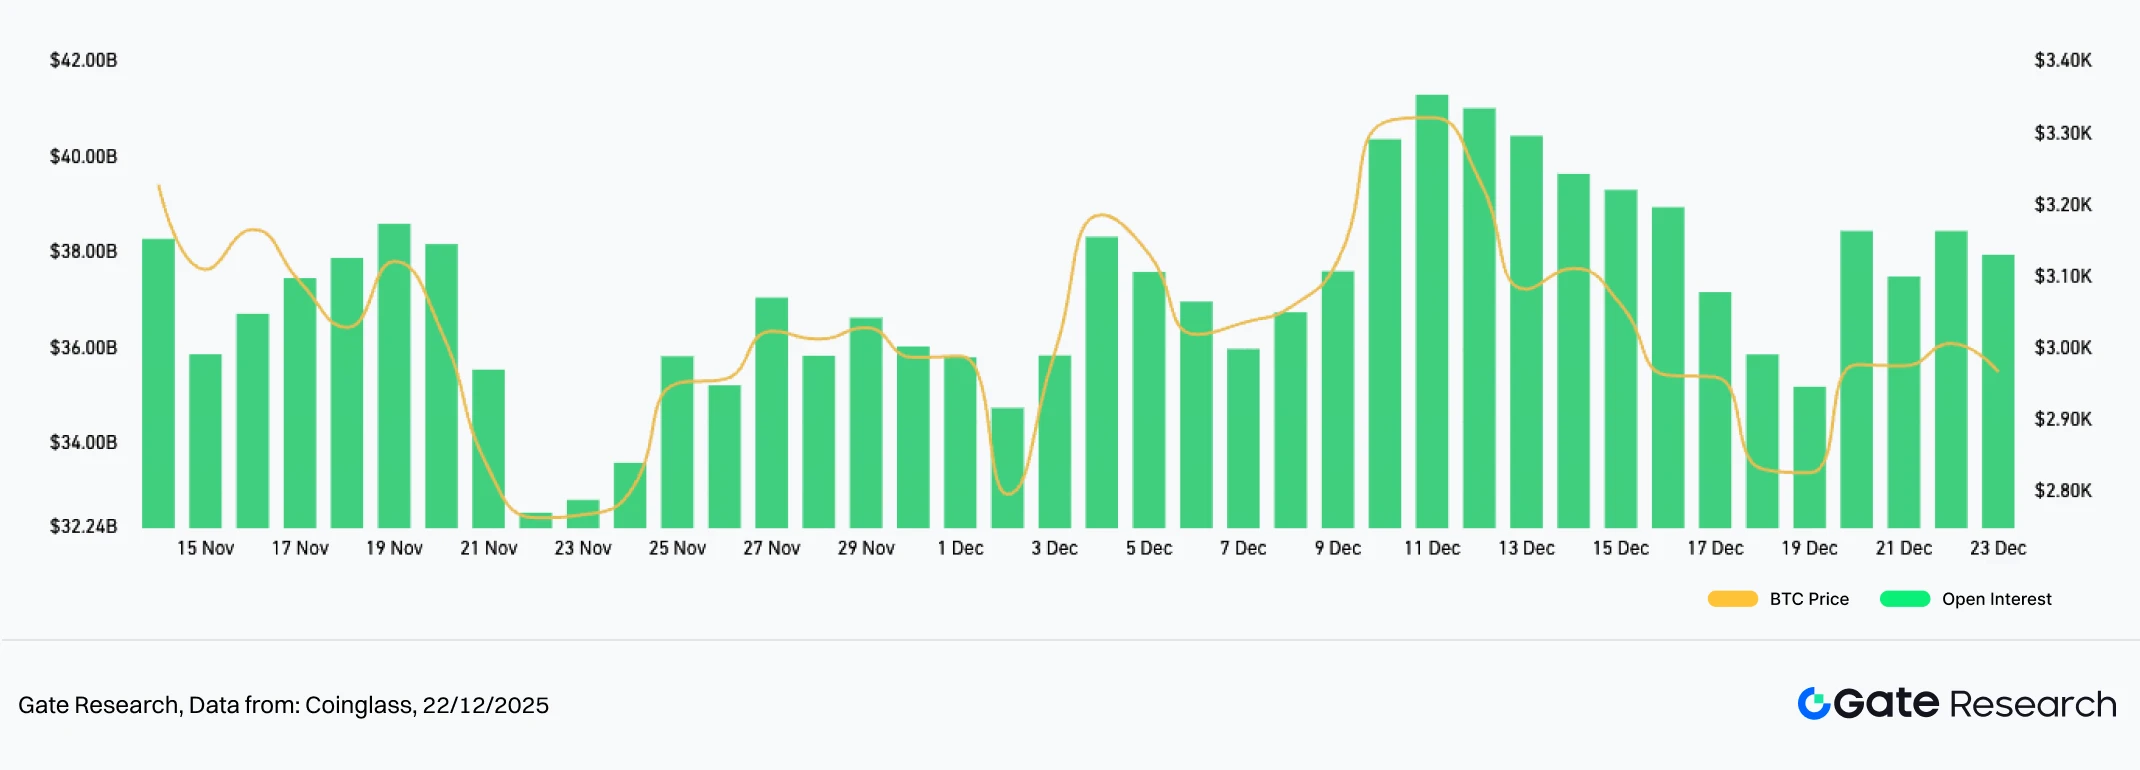
According to Coinglass, a review of BTC and ETH derivatives open interest and price performance over the past two weeks indicates that the market remains in a post-deleveraging consolidation and recovery phase. During rebound attempts, neither asset recorded sustained expansion in open interest, suggesting that price movements were largely driven by existing capital rather than fresh trend-aligned inflows. This reflects a cautious risk appetite and limited willingness to re-leverage at the current stage.【6】
Structurally, BTC’s open interest fluctuations were relatively stable, with only modest recovery after the initial drawdown. This implies that dominant market participants are prioritizing risk control rather than actively scaling leverage. ETH, by contrast, saw a more notable rise in open interest during interim rebounds, but this expansion quickly reversed, indicating a higher share of short-term participation and insufficient positioning stability, with more pronounced sentiment-driven behavior.
Overall, in the absence of meaningful growth in open interest, and without alignment from funding rates or long/short ratios to support a directional narrative, BTC and ETH are more likely to remain range-bound. A stronger signal for the start of a new directional trend would require concurrent price appreciation, sustained expansion in open interest, and evidence of a more stable leverage structure.
Figure 5: BTC’s open interest shows only modest recovery post-pullback, highlighting a cautious stance among dominant capital.
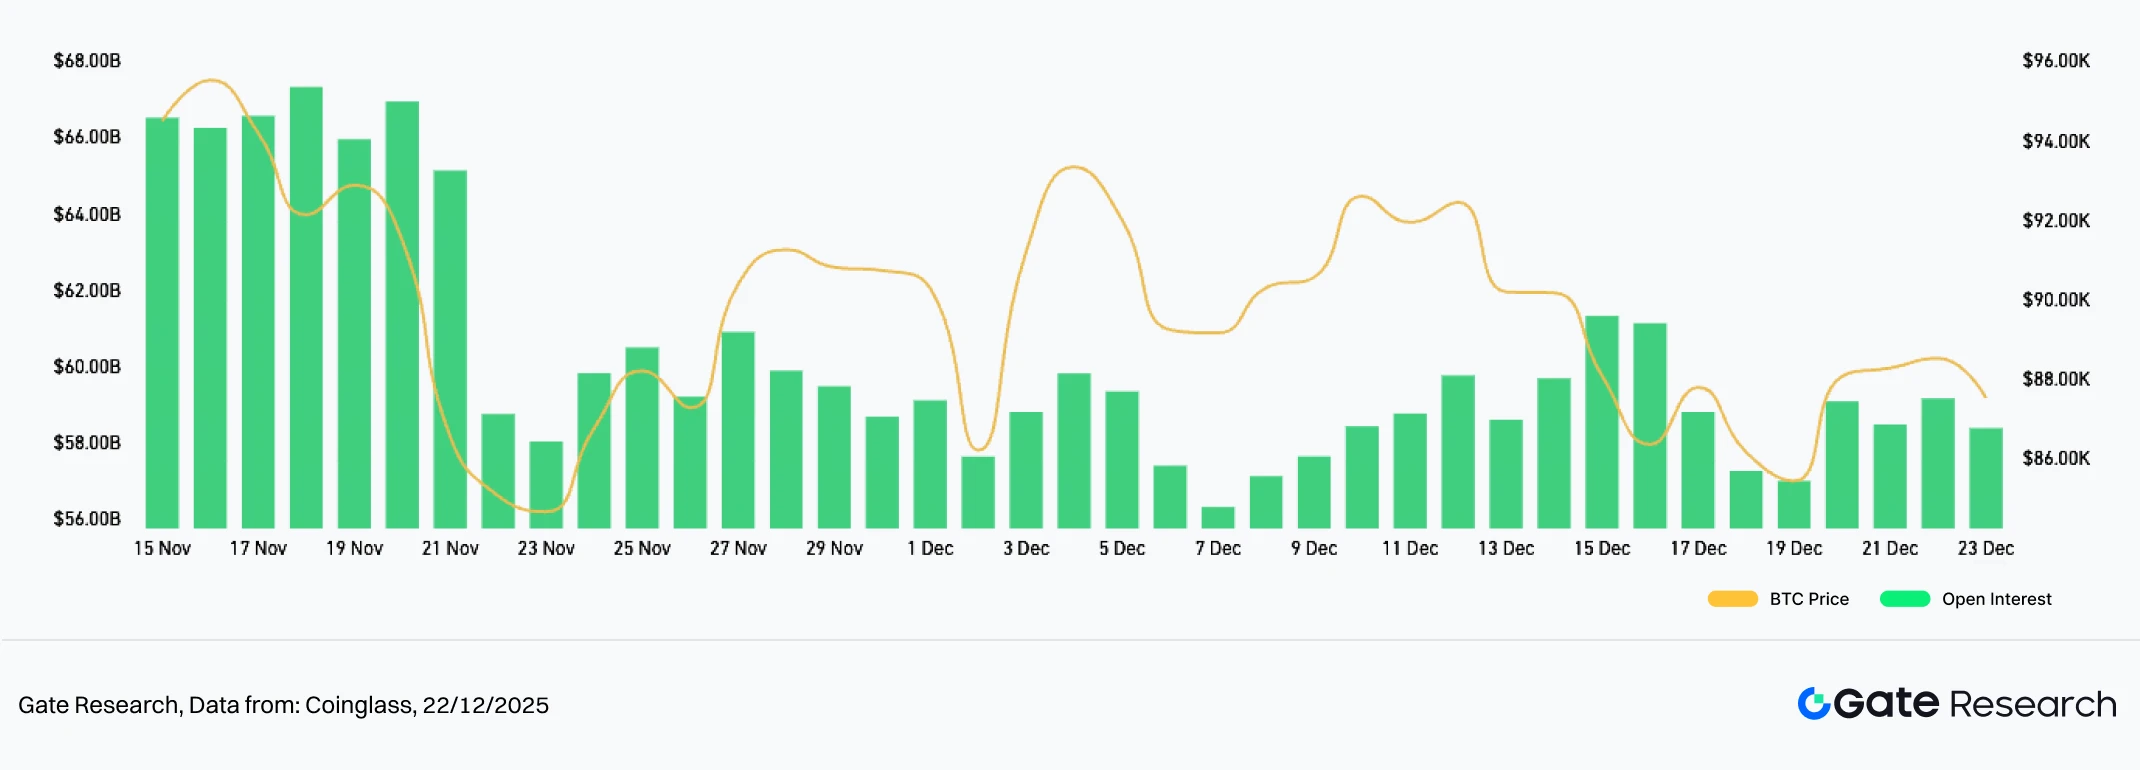
Figure 6: ETH’s open interest briefly expanded during rebound phases before retreating, indicating active short-term participation but insufficient stability in positioning.
4. Funding Rate
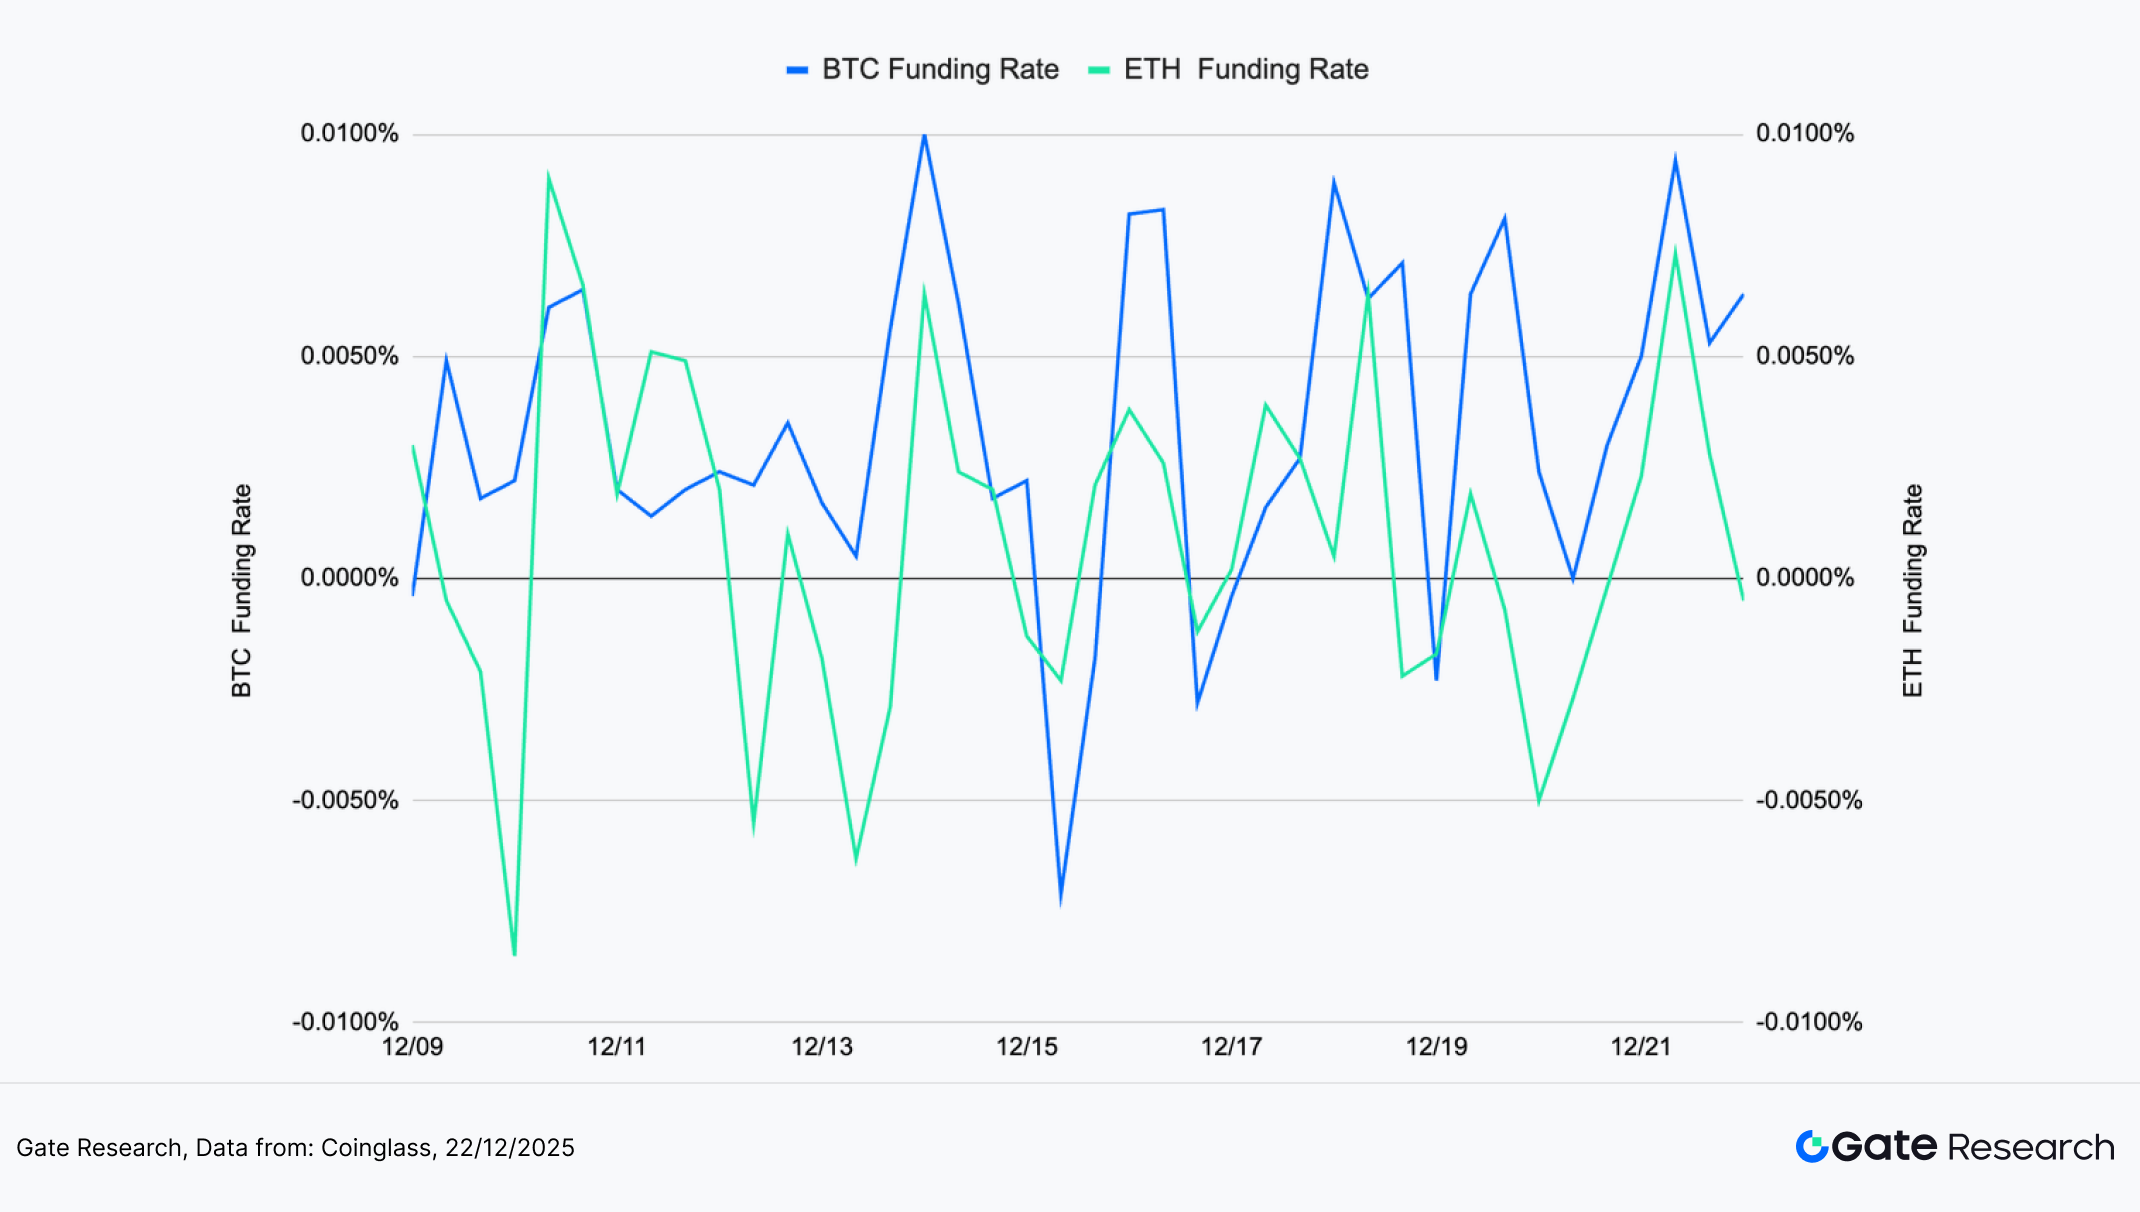
During the observation period, BTC and ETH funding rates exhibited high-frequency oscillations, repeatedly switching above and below the zero line, underscoring the lack of directional consensus and the ongoing rotation in long–short sentiment. BTC’s funding rate frequently flipped from positive to negative before quickly recovering, with individual swings becoming increasingly pronounced. This pattern reflects continuous position adjustments by leveraged participants during episodes of price volatility and retracement, with overall risk appetite remaining cautious.【7】【8】
ETH’s funding rate trajectory largely mirrored BTC’s but showed sharper short-term fluctuations. During corrective phases, ETH funding rates more readily slipped into negative territory before rapidly reverting toward neutral levels, indicating higher turnover among short-term participants and greater sensitivity to price changes. Compared with BTC, ETH displayed slightly larger amplitude in funding rate swings, driven more distinctly by trading activity.
In summary, current funding rate behavior remains in a state of “non-directional, rapid rotation,” signaling that short-term speculation continues to dominate while trend-following capital has yet to establish a sustained presence. A persistent move into positive territory accompanied by a recovery in trading volume would serve as a more constructive signal for potential stabilization or rebound; conversely, an extended period of negative readings would warrant attention to the risk of renewed downside pressure from short-side positioning.
Figure 7: BTC and ETH funding rates oscillate around the zero line at high frequency, reflecting recurring sentiment reversals and a lack of clear directional conviction.
5. Cryptocurrency Liquidation Chart
According to Coinglass, recent liquidation data indicates that over the past two weeks the market has been characterized by high-frequency liquidations on both the long and short sides, without evidence of sustained one-sided squeezes. Most liquidation events remained moderate in scale, with only isolated trading days showing notable spikes. This suggests that recent price swings have largely been driven by leverage adjustments within a choppy environment rather than trend-driven capitulation events.【9】
Structurally, long liquidations expanded significantly during several pullbacks, reflecting pressure on late-entry long positions as rebounds failed to sustain and highlighting insufficient stability in leveraged long exposure. Short liquidations, meanwhile, appeared mainly during brief rebounds or sharp intraday surges, but without longevity, indicating that short positions were generally speculative and lacked the conviction necessary to trigger continuous short squeezes. The overall liquidation rhythm follows a pattern of “rapid release and quick retreat,” with leveraged positioning being adjusted frequently.
In aggregate, the current liquidation profile is consistent with earlier signals from funding rates, long/short ratios, and open interest: the market remains in a post-deleveraging recovery phase. Absent a sequence of large-scale, multi-day liquidations concentrated in a single direction, price action is more likely to remain range-bound. Only when liquidations begin to cluster directionally and coincide with decisive price breaks above or below key zones would there be stronger confirmation of a new directional trend.
Figure 8: Liquidations remain mostly moderate, with only isolated spikes, indicating that recent price swings have been driven primarily by leverage adjustments within consolidation rather than trend-driven cascades.

In the current weak and volatile environment, BTC and ETH remain in low-level consolidation with limited rebound momentum. Multiple surges in volatility indicate a cautious market regime that remains highly sensitive to key price thresholds. The long/short ratio, funding rates, and open interest continue to exhibit high-frequency fluctuations near lower ranges, signaling a lack of directional clarity among leveraged participants and subdued overall risk appetite, consistent with a post-deleveraging recovery structure.
Against this backdrop, the core trading focus shifts toward identifying trend transitions and structural breakouts with precision. Going forward, attention will center on evaluating the performance of multi–moving average breakout strategies during weak consolidation and early trend formation phases, assessing their effectiveness in filtering range-bound noise, improving entry and exit discipline, and reducing susceptibility to emotion-driven decision-making.
Quantitative Analysis – Dense Moving Average Breakout Strategy
(Disclaimer: All forecasts in this article are based on historical data and market trends and are for informational purposes only. They should not be considered investment advice or a guarantee of future market performance. Investors should carefully assess risks and make prudent decisions when engaging in related investments.)
1. Strategy Overview
The Dense Moving Average Breakout Strategy is a momentum-based methodology that incorporates trend identification through technical analysis. The strategy monitors multiple short- to mid-term moving averages (e.g., 5-day, 10-day, 20-day) or their equivalent intraday configurations. When these averages converge and move in alignment, it indicates that the market is in a consolidation phase and potentially approaching a directional breakout. If price action breaks above the clustered moving average zone, it generates a bullish initiation signal; conversely, a breakdown below this zone is treated as a bearish signal.
To improve operational reliability and risk control, the strategy integrates fixed ratio take-profit and stop-loss conditions. This ensures that positions are managed systematically once price momentum confirms, balancing return potential with disciplined downside protection. Overall, the strategy targets short- to mid-term trend cycles and emphasizes rule-based execution.
2. Core Parameter Settings

3. Strategy Logic and Operational Mechanism
Entry Conditions
- Dense Moving Average Assessment
Calculate six moving averages: SMA20, SMA60, SMA120, EMA20, EMA60, and EMA120.
Measure the distance between the maximum and minimum values of these averages (hereinafter referred to as MA range). When the MA range falls below a predefined threshold (e.g., 1.5% of the current price), the system marks a dense moving average condition.
A threshold refers to a boundary value that defines the minimum or maximum level required for an effect or signal to be recognized.
- Breakout Confirmation
- Bullish entry: Price breaks above the highest of the six moving averages.
- Bearish entry: Price falls below the lowest of the six moving averages.
Exit Conditions — Dynamic Take-Profit and Stop-Loss
- For Long Positions
- Stop-loss: Price falls below the lowest moving average at the time the position was opened.
- Take-profit: Price rises by a factor equivalent to (distance between entry price and lowest moving average ×
reward-to-risk ratio).
- For Short Positions
- Stop-loss: Price rises above the highest moving average at the time the position was opened.
- Take-profit: Price falls by a factor equivalent to (distance between entry price and highest moving average ×
reward-to-risk ratio).
Practical Example Chart
- Trading Signal Triggered
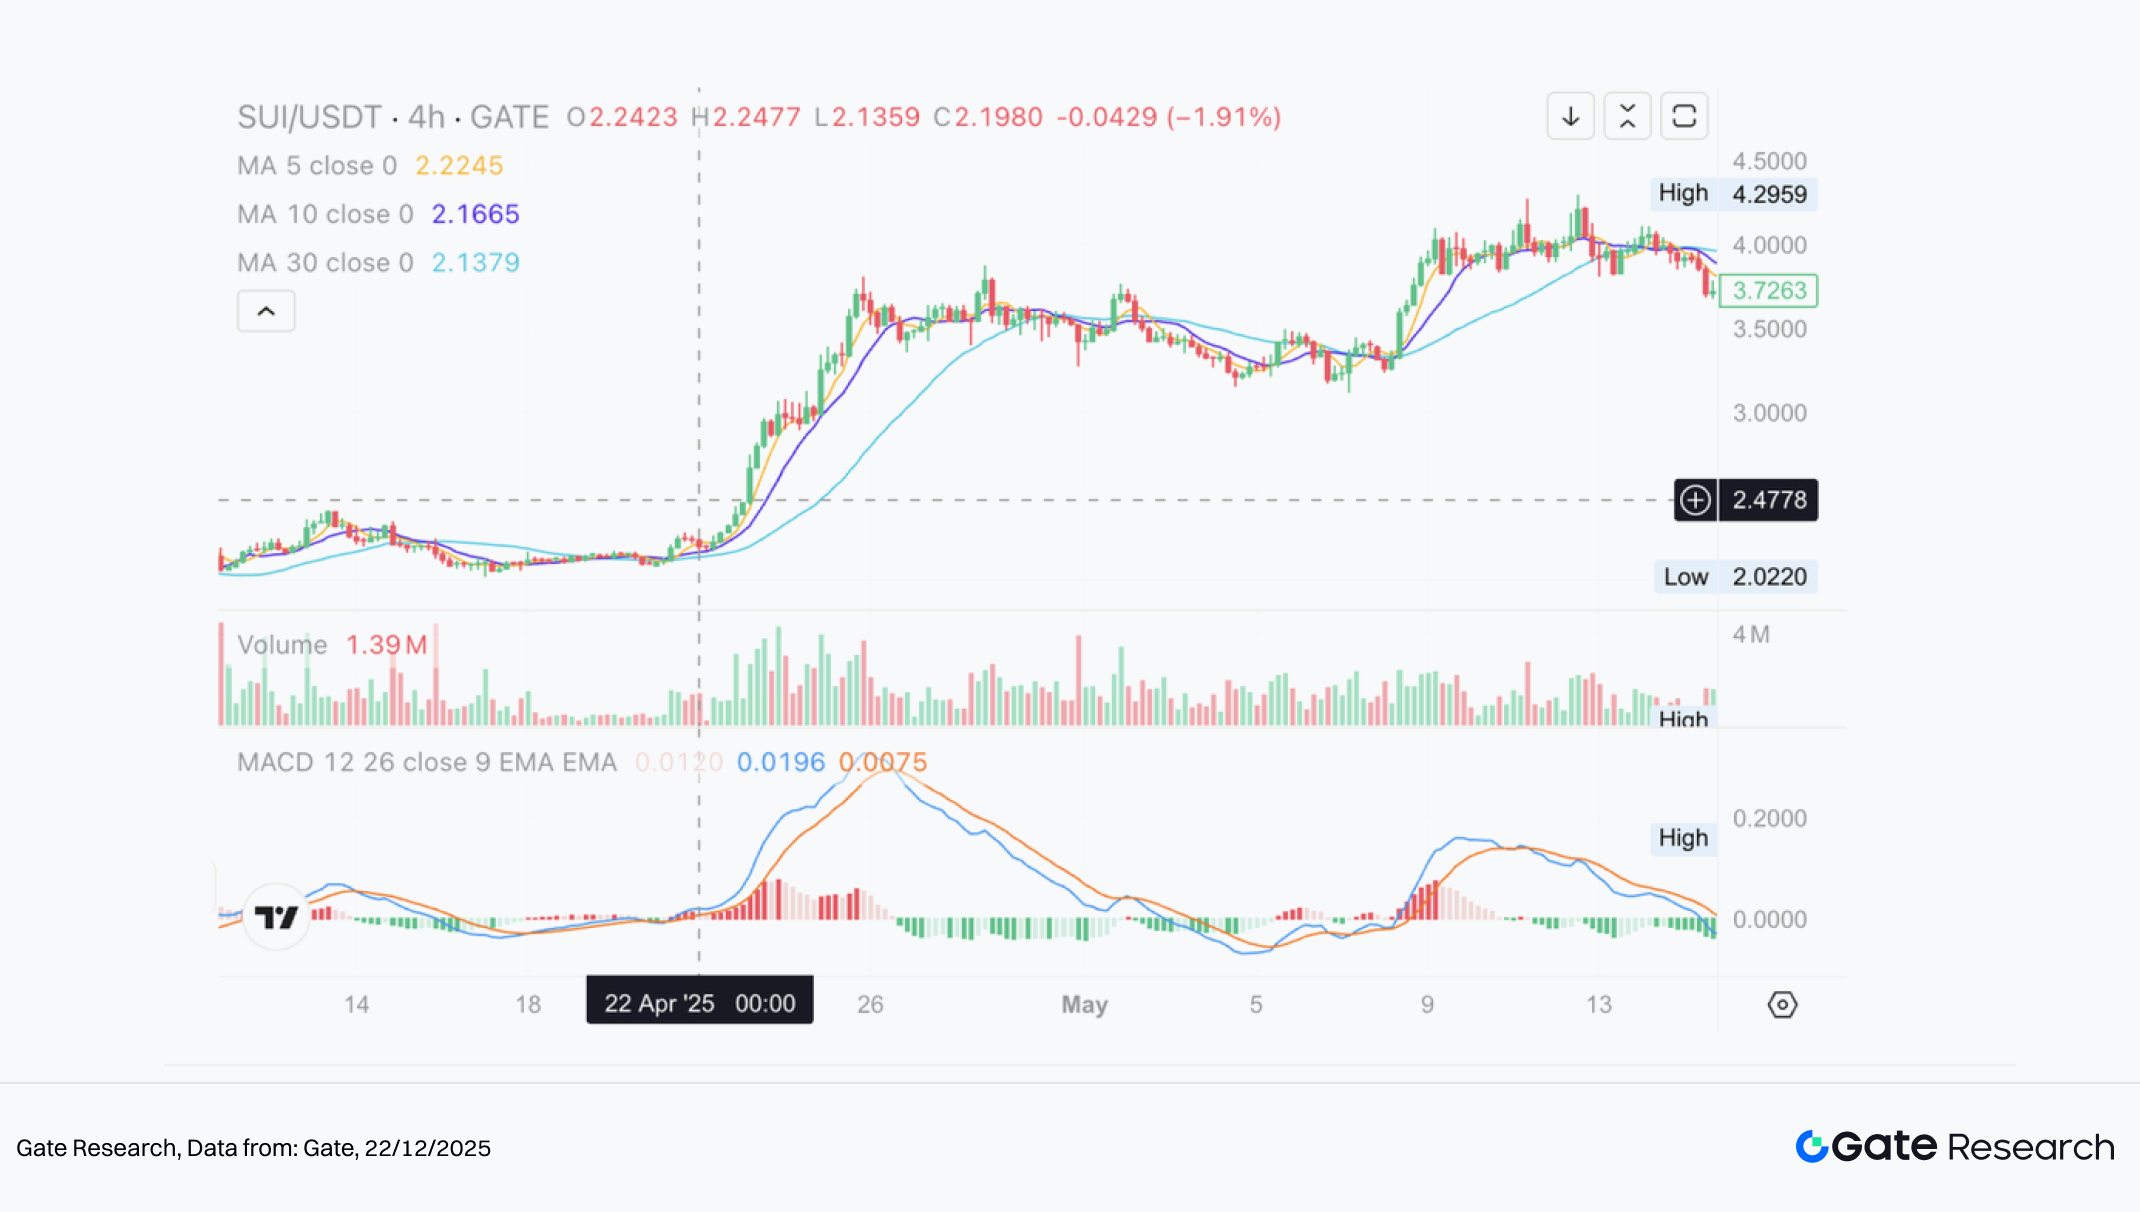
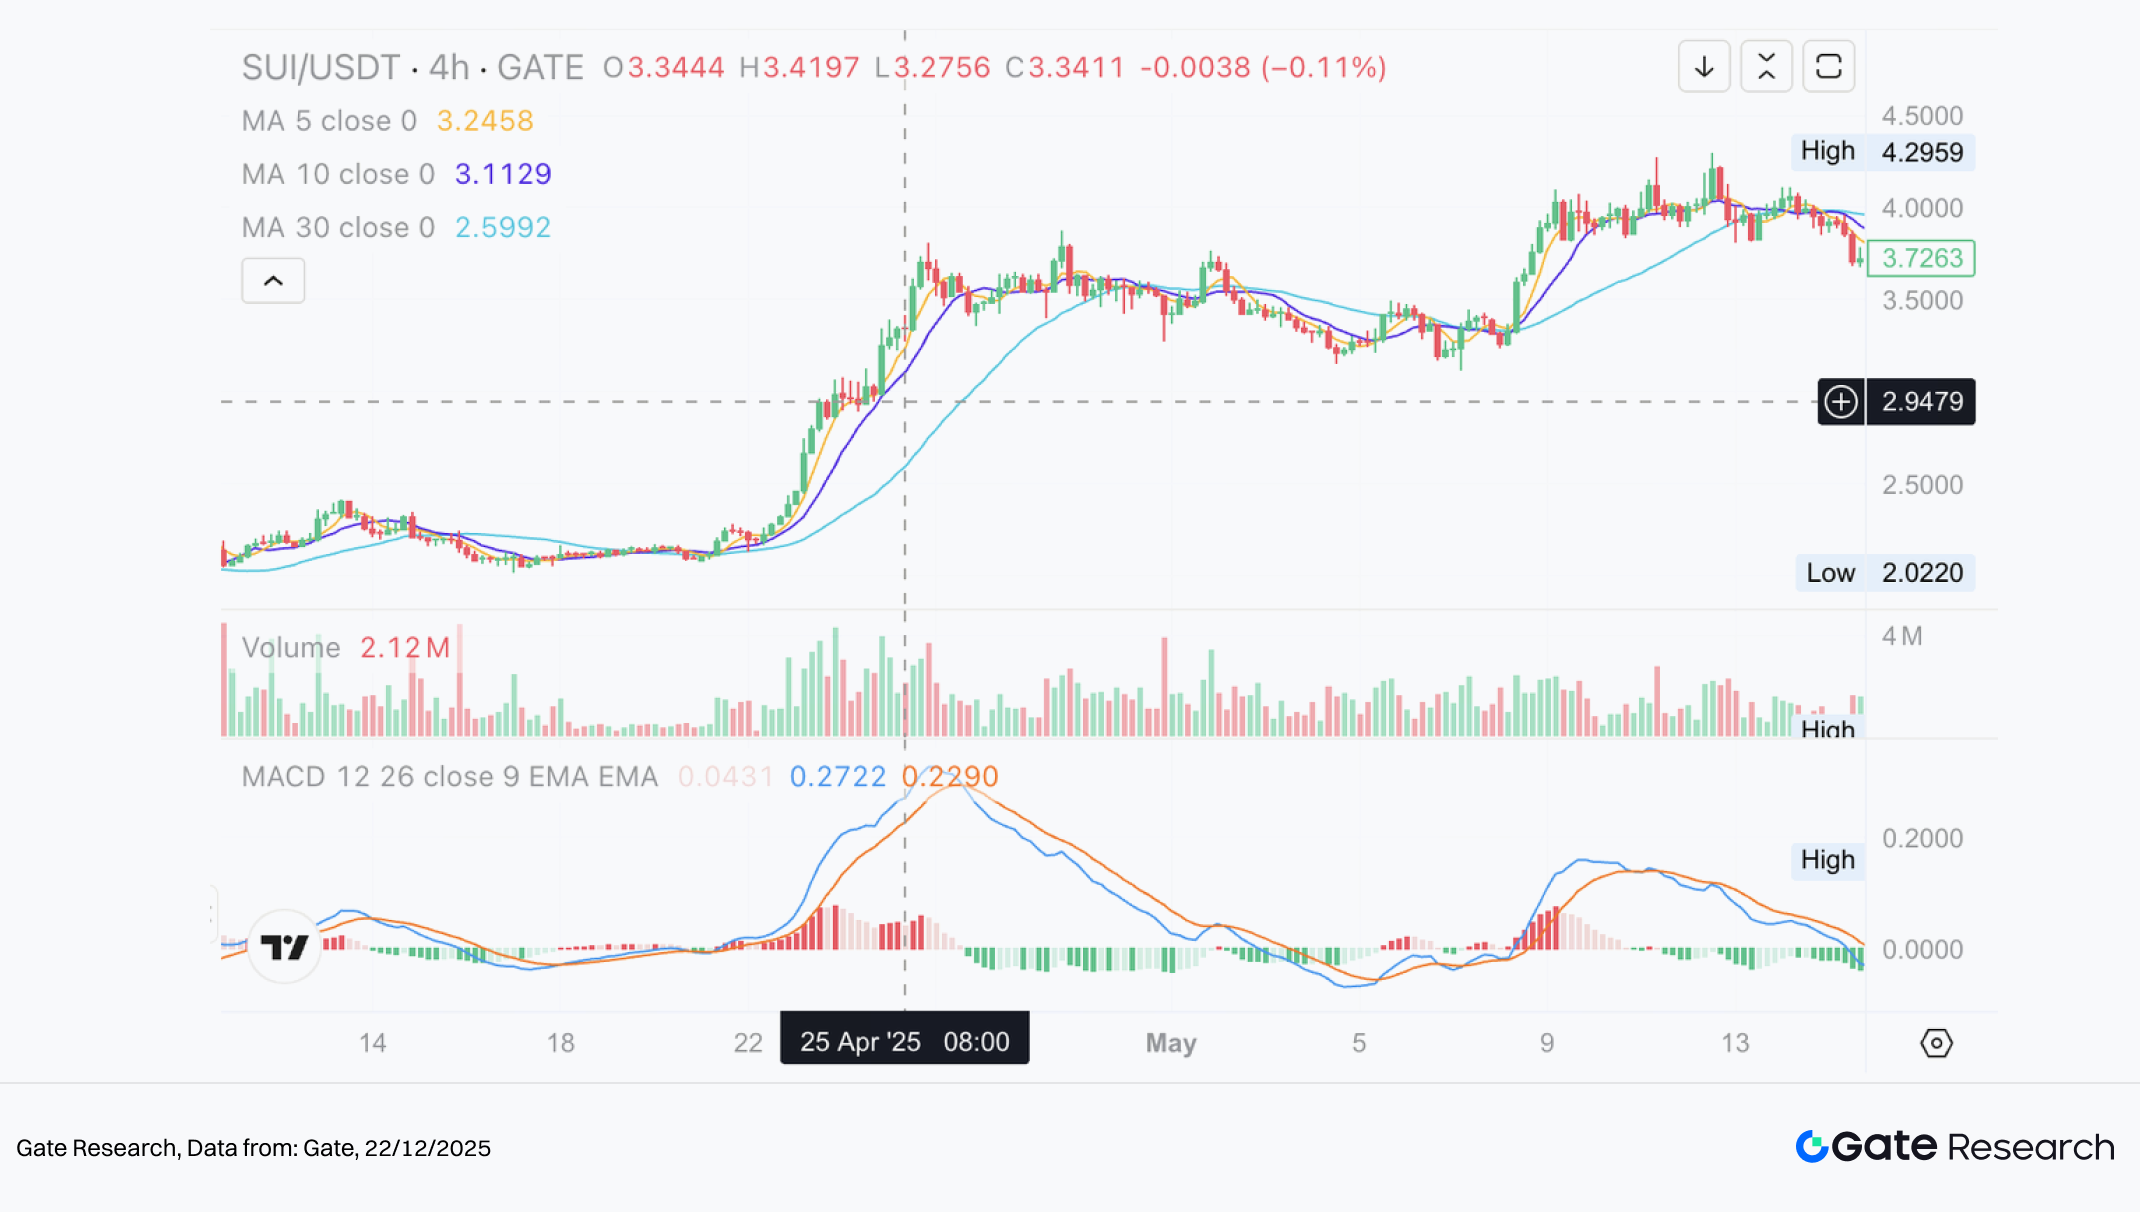
The chart below highlights a long setup triggered on April 22, 2025, on the SUI/USDT 4-hour chart. After a period of tightly clustered moving averages, price action confirmed a bullish breakout, prompting the system to enter a long position at the breakout point. This successfully captured the initial leg of the upward trend.
Figure 9: Example of entry execution for SUI/USDT when conditions were met (April 22, 2025)
- Trading Action and Outcome
Using the dynamic take-profit framework, the system exited the position upon reaching the predefined reward-to-risk threshold, securing the primary portion of the upward movement. While additional upside was left uncaptured, the trade followed strategic discipline, demonstrating stability and consistent risk management. Integrating trailing stops or a trend-following exit logic may further enhance performance by extending gains in stronger market trends.
Figure 10: Example of exit execution for SUI/USDT based on dynamic take-profit (April 25, 2025)
Through the practical example above, we illustrated how the strategy’s entry logic and dynamic take-profit mechanism are activated when both dense moving averages and breakout conditions are met. By leveraging the structural interplay between price action and the moving average cluster, the strategy pinpoints the onset of trend formation and exits automatically during subsequent volatility, securing major profit segments while maintaining controlled risk. This case verifies not only the strategy’s operational feasibility and execution discipline, but also its stability and risk management effectiveness in live market environments, forming a solid foundation for subsequent parameter optimization and performance evaluation.
4. Practical Backtesting Example
Backtesting Parameter Configuration
To identify the optimal parameter combination, we conducted a systematic grid search across the following ranges:
tp_sl_ratio: 3 to 14 (step = 1)threshold: 1 to 19.9 (step = 0.1)
Using DOGE/USDT on the 4-hour timeframe as an example, the system tested 23,826 parameter sets over the past year. The top five combinations, ranked by cumulative returns, were selected. Evaluation metrics included annualized return, Sharpe ratio, maximum drawdown, and ROMAD (Return Over Maximum Drawdown) to provide a comprehensive assessment of performance.
Figure 11: Performance comparison of the five best-performing parameter sets

Strategy Logic Description
For DOGE, when the system detects that the maximum range between the six moving averages contracts to within 2.2%, and price breaks upward through the upper boundary of the moving average cluster, a long entry signal is triggered. This configuration aims to capture the breakout point at the earliest phase of expansion. The highest moving average at the breakout moment serves as a dynamic reference for profit-taking, improving overall return capture and trade management.
The active configuration is as follows:
percentage_threshold= 2.2 (maximum MA range constraint)tp_sl_ratio= 6 (dynamic take-profit ratio)short_period= 6,long_period= 14 (MA observation periods)
Performance and Results Analysis
For the backtesting period from October 1, 2024 to December 17, 2025, this parameter set demonstrated outstanding results:
- Annualized Return: 93.04%
- Maximum Drawdown: under 10%
- ROMAD: 9.32
These results indicate strong capital compounding capability and effective downside containment. Parallel comparison of the top five configurations shows that this specific setup currently offers the best balance between return and stability, highlighting its high applicability for real-world deployment.
Looking ahead, performance may be further improved by incorporating dynamic threshold adjustments, or by adding filters based on volume confirmation and volatility regimes to enhance adaptability in sideways markets. The strategy also shows potential for expansion across multi-asset and multi-timeframe portfolios.
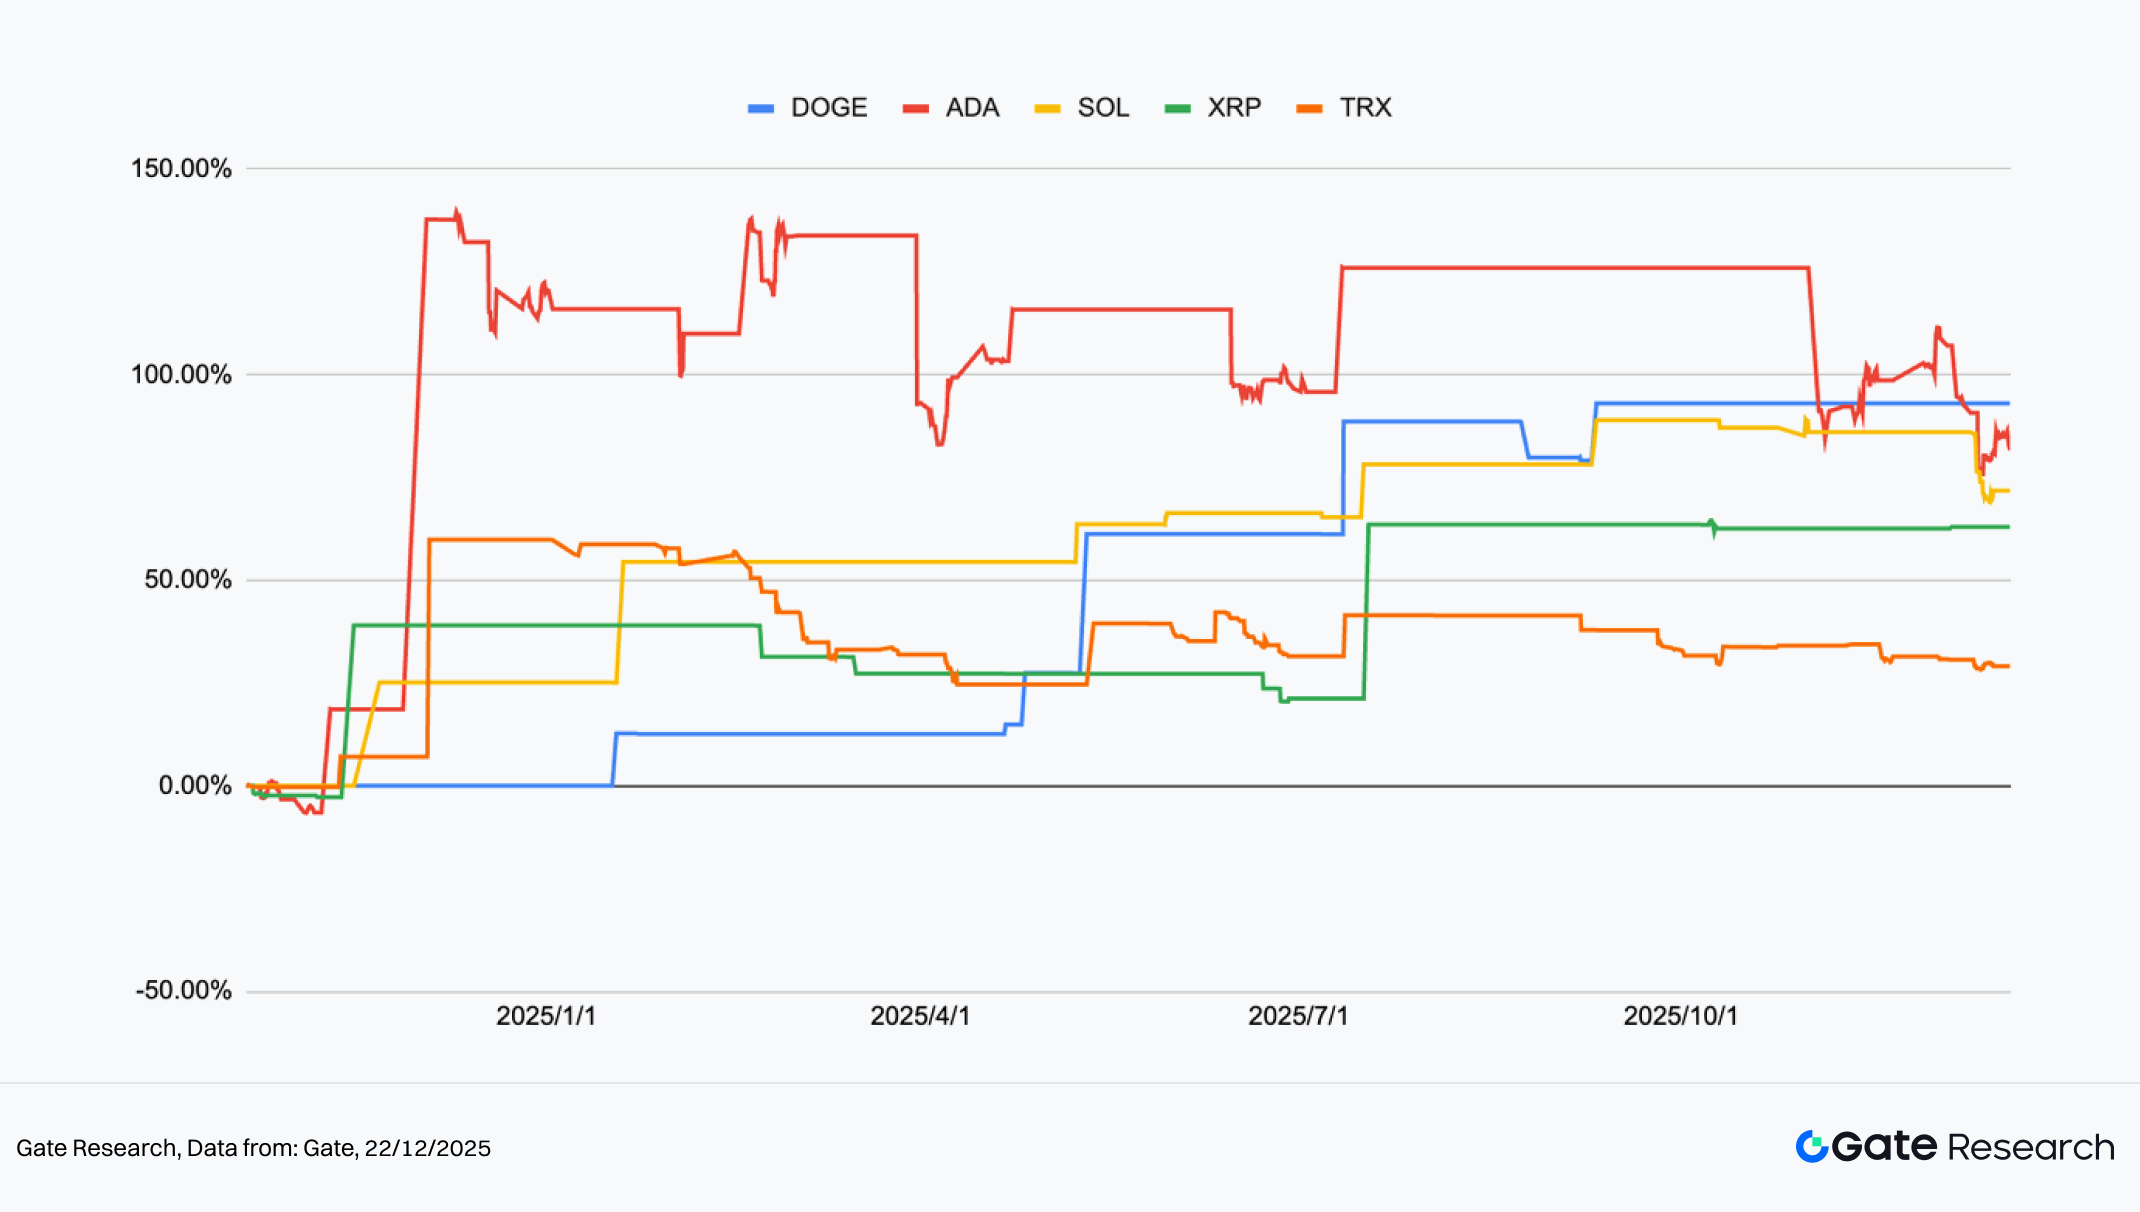
Figure 12: Cumulative returns comparison of the five best-performing configurations over the past year
5. Strategy Summary
The dense moving average trend strategy uses the post-convergence directional expansion of short- to mid-term moving averages as its core entry trigger, supplemented by staged position scaling and dynamic take-profit mechanisms to accumulate returns once trend confirmation is established. Based on backtesting results over the past year, assets such as DOGE, ADA, and SOL exhibited multiple trend initiations following dense moving average structures, with cumulative returns forming clear staircase-like upward patterns. Periodic rallies in ADA and DOGE exceeded 100% at various points, while SOL maintained steady appreciation, indicating robust trend-following capability in both high-volatility and moderate-trend environments. By contrast, XRP and TRX traded mostly within ranges; however, once trend conditions were established, they still delivered stable positive returns, contributing meaningfully to the broader portfolio and maintaining a diversified return profile.
From the structural behavior of the equity curves, the strategy performs particularly well during transitions from rotation or consolidation into trending phases. Dense moving averages act as an effective filter, reducing the risk of chasing momentum prematurely and helping preserve accumulated gains during pullbacks. As a result, cumulative returns move steadily upward rather than relying on recovery from deep drawdowns. However, in aggressive one-directional rallies, entries may lag due to the requirement for moving average confirmation, causing the strategy to miss early portions of the move and limiting upside elasticity compared to high-beta assets experiencing extreme upside acceleration.
From a long-term risk-return allocation perspective, this trend strategy is well suited as an offensive or return-enhancing module within a broader portfolio. However, it should be paired with low-volatility, drawdown-controlled strategies to maintain overall balance. For instance, Gate’s quantitative fund framework—built around market-neutral arbitrage, hedging, and capital efficiency—provides smoother equity curves across market cycles. By comparison, trend-based systems carry higher return potential but come with more frequent position adjustments and larger drawdown risk profiles. Using both in combination supports long-term compounding while managing portfolio-level volatility.
Conclusion
Between December 9 and December 22, 2025, the crypto market remained in a weak consolidation phase following earlier corrections, with both participation and risk appetite declining. After retreating from local highs, BTC and ETH continued to oscillate within ranges, with rebounds lacking follow-through and failing to establish meaningful trend recovery. Short-term volatility spiked repeatedly around key price levels, highlighting elevated sensitivity and unstable sentiment. The long/short ratio hovered around 1.0, suggesting a lack of directional conviction among active capital, while funding rates flipped frequently between positive and negative, reflecting short-term position adjustments and the absence of sustained bullish leverage.
In derivatives positioning, BTC and ETH open interest failed to meaningfully rebuild after prior deleveraging, remaining at subdued levels and indicating limited new leverage entering the market. On liquidation profiles, long positions were cleared more aggressively during pullbacks, while short liquidations remained modest, signaling that downside risks have not fully been resolved but are not yet cascading into a capitulation scenario. Overall, the market remains in the late stage of post-correction consolidation, defined by position rotation and sentiment instability. Without evidence of renewed capital inflows or volume-price confirmation, short-term price action remains vulnerable to further weakness or localized liquidation events.
In the current weak and range-bound environment, the moving average breakout trend strategy continues to demonstrate practical viability. Backtests show that DOGE, ADA, and SOL delivered staircase-like cumulative returns when moving averages transitioned from convergence to expansion; XRP and TRX, despite lower volatility, still provided steady positive performance once breakouts materialized, reflecting consistent trend-capture capability across different volatility regimes. The aggregated return structure is defined by gradual compounding rather than reliance on single exceptional trades.
That said, in rapid one-sided markets, confirmation requirements can delay entries or trigger protective stops during shallow retracements, resulting in partial under-exposure to initial impulse moves. Enhancements such as volatility filters, moving average slope validation, or volume confirmation could improve recognition of early trend phases and increase adaptability across market environments. Gate’s quantitative fund framework, centered on market-neutral and hedged strategies, emphasizes drawdown control and smooth return profiles, making it an effective foundational allocation that complements trend-based systems. Together, the two approaches balance offensive return generation with structural capital preservation and enhance the portfolio’s long-term compounding potential.
References:
- CoinGecko, https://www.coingecko.com/
- Gate, https://www.gate.com/trade/BTC_USDT
- Gate, https://www.gate.com/trade/ETH_USDT
- Sosovalue, https://sosovalue.com/assets/etf/us-btc-spot?from=moved
- Coinglass, https://www.coinglass.com/LongShortRatio
- Coinglass, https://www.coinglass.com/BitcoinOpenInterest?utm_source=chatgpt.com
- Gate, https://www.gate.com/futures_market_info/BTC_USD/capital_rate_history
- Gate, https://www.gate.com/futures/introduction/funding-rate-history?from=USDT-M&contract=ETH_USDT
- Coinglass, https://www.coinglass.com/pro/futures/Liquidations
- Gate, https://www.gate.com/institution/quant-fund
Gate Research is a comprehensive blockchain and cryptocurrency research platform that provides deep content for readers, including technical analysis, market insights, industry research, trend forecasting, and macroeconomic policy analysis.
Disclaimer
Investing in cryptocurrency markets involves high risk. Users are advised to conduct their own research and fully understand the nature of the assets and products before making any investment decisions. Gate is not responsible for any losses or damages arising from such decisions.
Share


Related Articles

Reflections on Ethereum Governance Following the 3074 Saga

Gate Research: 2024 Cryptocurrency Market Review and 2025 Trend Forecast

Perpetual Contract Funding Rate Arbitrage Strategy in 2025

Gate Research: BTC Breaks $100K Milestone, November Crypto Trading Volume Exceeds $10 Trillion For First Time

NFTs and Memecoins in Last vs Current Bull Markets
