Finding Long-term Investment Targets that Can Withstand Bull and Bear Markets
Forward the Original Title‘Sifting for Gold: Finding Long-term Investment Targets that Can Withstand Bull and Bear Markets (2025 Edition - Part 1)’
Introduction: The Altcoin Bear Market – Fundamentals-based Investing Still Works
Undoubtedly, this bull market cycle has been the worst-performing cycle for altcoins.
Unlike previous bull market cycles where altcoins showed strong price performance after the bull run began — causing BTC dominance to fall rapidly — this cycle has seen BTC dominance steadily rise from around 38% since the market bottomed out in November 2022 to now firmly standing above 61%. This has happened despite a rapid expansion in the number of altcoins during this cycle, underscoring the relative weakness of altcoin prices.

BTC Dominance Trend. Source: Tradingview
As the current market cycle has progressed to this point, it largely confirms the projections made by Mint Ventures in their March 2024 article titled “Preparing for the Main Bull Run: My Thoughts on the Stages of This Cycle.” In that article, the author suggested:
- Among the four key drivers of this bull market, three are present while one is missing:
- BTC’s halving (anticipation of supply and demand adjustment), √
- Loosening or expected loosening of monetary policy, √
- Loosening of regulatory policies,√
- Innovation in new asset models and business models, ×
As a result, the author advised lowering expectations for the prices of altcoins from the previous cycle — including smart contract platforms (L1/L2), gaming, DePIN, NFTs, and DeFi. Consequently, the recommended strategy for this bull cycle was:
- Allocate a higher proportion of funds to BTC and ETH (with a stronger preference for BTC, emphasizing BTC as the primary long-term investment).
- Maintain controlled exposure to altcoins such as DeFi, GameFi, DePIN, and NFTs.
- Seek alpha opportunities in emerging sectors and new projects, including Meme coins, AI, and the BTC ecosystem.
As of the publication of the article, the correctness of the above strategies has been basically verified (except for the unsatisfactory performance of the BTC ecosystem).
However, it’s worth noting that despite the poor performance of most altcoin projects during this cycle, a few standout altcoins have outperformed BTC and ETH over the past year. The most notable examples are Aave and Raydium, which were highlighted in Mint Ventures’ July 2024 report titled “Altcoins Keep Falling — Is It Time to Revisit DeFi?“, published at the market’s lowest point for altcoins.
Since early July last year, Aave achieved a peak gain of over 215% relative to BTC and 354% relative to ETH. Even after a significant price pullback, Aave remains up 77% against BTC and 251% against ETH.

Aave/BTC exchange rate trend, source: Tradingview
Since early July last year, Ray’s highest increase relative to BTC has exceeded 200%, and its highest increase to ETH has been 324%. At present, due to the overall decline of the Solana ecosystem and the major negative effects of Pump.fun’s self-developed Dex, Ray’s increase relative to BTC is still positive, and it also significantly outperforms ETH.
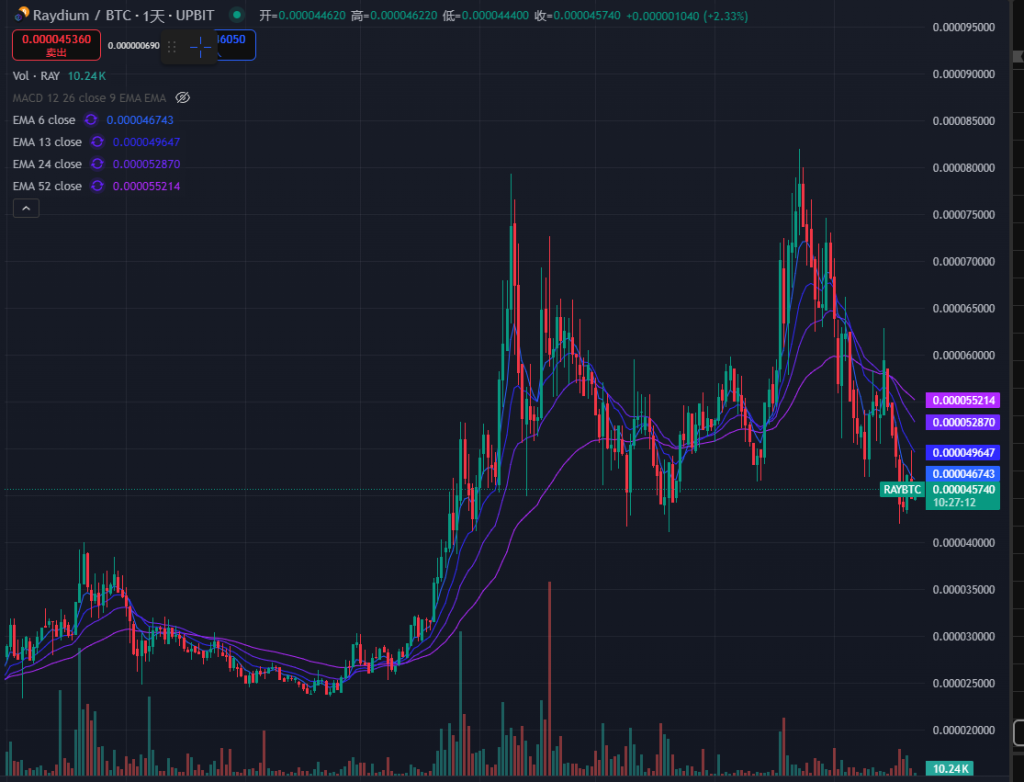
Ray/BTC exchange rate trend, source: Tradingview
Considering that BTC and ETH (especially BTC) have significantly outperformed most of the altcoin projects this cycle, the price performance of Aave and Ray is more outstanding among the many altcoin projects.
The reason for this is that compared to most altcoin projects, Aave and Raydium have better fundamentals, as reflected in the fact that their core business data have reached record highs in this cycle, and they have unique moats, with stable or rapid market share expansion.
Even in the “altcoin bear market”, betting on projects with outstanding fundamentals can yield alpha returns that exceed those of BTC and ETH. This is also the main purpose of our investment research work.
In this research report, Mint Ventures will identify high-quality projects with solid fundamentals from thousands of listed crypto projects, track their recent business performance and market share, analyze their competitive advantages, assess their challenges and potential risks, and provide certain reference for its valuation.
What needs to be emphasized is:
- The projects mentioned in this article have advantages and attractions in some aspects, but they also have various problems and challenges. Different people may have completely different judgments on the same project after reading this article.
- Similarly, projects that are not mentioned in this article do not mean that they have “poor fundamentals”, nor does it mean that “we are not optimistic about them”. You are welcome to recommend projects you are optimistic about and the reasons why.
- This article is the staged thinking of the two authors as of the time of publication. It may change in the future, and the views are highly subjective. There may also be errors in facts, data, and reasoning logic. All opinions expressed in this article are not investment advice. Criticisms and further discussions from peers and readers are welcome.
We will analyze the project’s business status, competition situation, main challenges and risks, and valuation status from several dimensions. The following is the main text.
1. Lending Sector: Aave, Morpho, Kamino, MakerDao
DeFi remains the sector with the most successfully realized Product-Market Fit (PMF) in the crypto industry. Within DeFi, lending is one of the most crucial sub-sectors, characterized by mature user demand and stable business revenue. This sector hosts numerous high-quality projects, both established and emerging, each with its own strengths and weaknesses.
For lending projects, the most critical indicators are loan size (Active loans) and protocol revenue (Revenue). In addition, the protocol’s expenditure indicator – Token Incentives – must also be evaluated.
1.1 Aave: The King of Lending
Aave is one of the few projects that has successfully navigated through three crypto cycles, maintaining stable business growth. It originally completed its funding via an ICO in 2017 (at the time, the project was called Lend, operating as a peer-to-peer lending platform). During the previous cycle, Aave surpassed the then-leading lending platform, Compound, and has since maintained its position as the top lending protocol by transaction volume.
Business status
Aave’s primary business model is operating a pool-to-peer lending platform, generating revenue through interest income from loans and liquidation penalties during collateral liquidations. Additionally, Aave’s stablecoin business, GHO, is now in its second year of operation and is expected to generate direct interest income for Aave.
Loan size (Active loans)
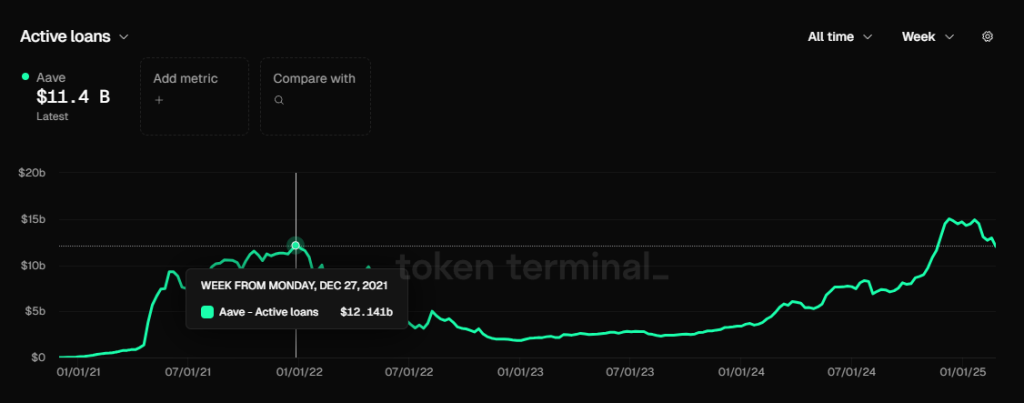
Aave’s loan size, data source: Tokenterminal
Aave’s loan size has exceeded the peak of 12.14 billion in the previous round (November 2021) since November last year. The current peak is at the end of January 25, when the loan volume was 15.02 billion U.S. dollars. Recently, as the enthusiasm for market transactions has cooled, the loan size has also declined, and is currently about 11.4 billion U.S. dollars.
Protocol Revenue (Revenue)

Aave’s protocol revenue, data source: Tokenterminal
Like the loan size, Aave’s protocol revenue has steadily exceeded the highest level in October 2021 since November last year. In the past three months, Aave’s weekly protocol revenue has been above US$3 million for most of the past three months (excluding GHO’s interest income). However, in the past two weeks, as the market heat has declined and market interest rates have fallen, the weekly protocol revenue has fallen back to the level of US$2 million+.
Token Incentives

Aave token incentive spending, data source: Aave Analytics
Aave currently maintains a substantial token incentive program, with 822 Aave tokens distributed daily. At an Aave market price of $245, this equates to approximately $200,000 in daily incentives. This relatively high incentive value is largely due to the significant increase in Aave’s token price over the past six months.
However, it’s important to note that unlike most projects that directly incentivize core user activities like deposits and loans, Aave’s token incentives are not directly tied to these actions. Instead, the incentives are allocated to the Deposit Safety Module (DSM). Consequently, Aave’s lending and borrowing activity data are still driven by organic demand.
In the author’s view, the incentive scale for Aave’s safety module remains excessive and could be reduced by at least 50%. However, with the upcoming implementation of Aave’s new economic model, particularly the introduction of the new Umbrella Insurance Module, Aave tokens will no longer be used as incentives for this purpose.
For further insights on Aave’s new economic model, you can refer to Mint Ventures’ report published last year titled: “Initiating Buybacks and Dividends, Upgrading the Safety Module: An In-depth Analysis of Aave’s New Economic Model.”
Competition
From the perspective of lending scale (EVM chain), Aave’s market share has been relatively stable, and it has always occupied the first place in the market since June 2021. In the second half of 2023, its market share once fell below 50%, but it has resumed its upward trend since 2024 and is currently basically stable at around 65%.

Data source: Tokenterminal
Aave’s competitive advantage
As of the author’s analysis of Aave in July last year, Aave’s core competitive advantages have not changed much, mainly coming from four aspects:
Continuous accumulation of security credit: Most new lending protocols will have security incidents within one year of being launched. So far, Aave has not had a security incident at the smart contract level. The safe credit accumulated through the risk-free and smooth operation of a platform is often the top priority for Defi users when choosing a lending platform, especially whale users with larger funds. For example, Justin Sun is a long-term user of Aave.
Bilateral network effect: Like many Internet platforms, Defi lending is a typical two-sided market. Deposit and borrowing users are the supply and demand ends of each other. The growth of the unilateral scale of deposits and loans will stimulate the growth of business volume on the other side, making it more difficult for subsequent competitors to catch up. In addition, the more abundant the overall liquidity of the platform, the smoother the liquidity in and out of deposits and loans, and the more likely it is to be favored by large-capital users, which in turn stimulates the growth of the platform’s business.
Excellent DAO management level: Aave protocol has fully implemented DAO-based management. Compared with the team-centralized management model, DAO-based management has more complete information disclosure and more complete community discussion on important decisions. In addition, the Aave DAO community is active in a group of professional institutions with high governance levels, including leading VCs, university blockchain clubs, market makers, risk management service providers, third-party development teams, financial consulting teams, etc., with diverse sources and active governance participation. Judging from the operational results of the project, Aave, as a latecomer in peer-to-peer lending services, has better balanced growth and security in product development and asset expansion, surpassing its big brother Compound. In this process, the governance of DAO played a key role.
Multi-chain ecological occupancy: Aave is deployed on almost all EVM L1\L2, and TVL is basically at the head of each chain. In the V4 version under development by Aave, multi-chain liquidity will be connected in series, and the advantages of cross-chain liquidity will be more obvious. In the future, Aave will expand to Aptos (the first non-EVM chain), Linea, and return to Sonic (formerly Fantom).
Main challenges and risks
Although Aave’s market share has remained steadily increasing over the past year, the rapid growth of its emerging competitor Morpho cannot be overlooked.
Unlike Aave, where asset categories, risk parameters, and oracle management are centrally controlled by the Aave DAO, Morpho adopts a more open model: it provides an open lending base protocol that allows permissionless creation of independent lending markets. Users can freely choose collateral assets, risk parameters, and oracles. In addition, Morpho has introduced Vaults, which are managed by specialized third-party institutions such as Gauntlet. Users can deposit funds directly into these Vaults, and the managing institutions assess the risks and decide which lending markets to allocate the funds to for generating returns.
This open and modular approach enables the Morpho ecosystem to quickly penetrate newer or niche lending markets. For instance, innovative stablecoin projects like Usual and Resolv have already built lending markets on Morpho, allowing users to engage in looping strategies to earn project rewards or points.
For more information about Morpho, I will analyze it in detail later.
In addition to competition from projects within the Ethereum ecosystem, Aave also faces challenges from other high-performance Layer 1 chains. If ecosystems like Solana continue to encroach on Ethereum’s dominance, Aave — which is heavily focused on Ethereum — will undoubtedly face growth limitations.
Moreover, the highly cyclical nature of the crypto market directly affects Aave’s user demand. During bear market cycles, speculative opportunities and arbitrage space shrink rapidly, causing Aave’s loan volume and protocol revenue to decline significantly. This is a common challenge for all lending protocols and will not be discussed further.
Valuation reference
From a valuation perspective, Aave’s current Price-to-Sales (PS) ratio — calculated as its fully diluted market cap divided by protocol revenue — stands at 28.23, positioning it within the median range for the past year. This is still far from the PS values exceeding 100 seen during the peak periods between 2021 and 2023.

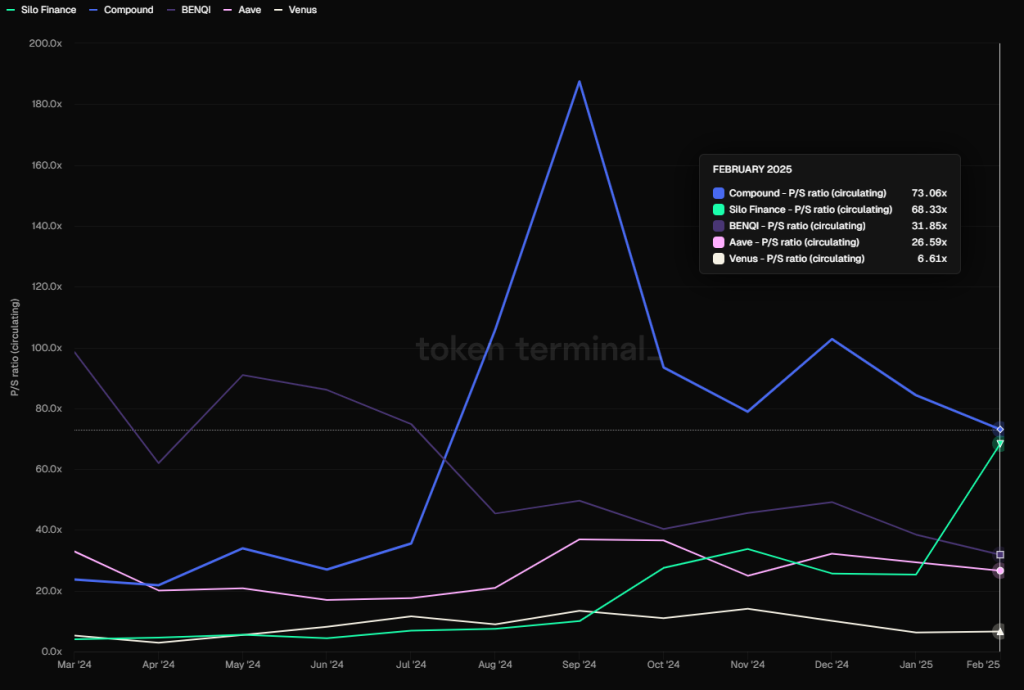
PS of mainstream lending protocols (based on FDV), data source: Tokenterminal
From a horizontal comparison, Aave’s PS indicator is much lower than Compound, Silo, benqi and other protocols, and higher than Venus.
However, what needs to be considered is that Defi is similar to traditional financial companies in that its revenue multiples are extremely cyclical. PS often declines rapidly in bull markets and rises in bear markets.
1.2 Morpho: The rising star
Morpho started as a revenue optimization protocol based on Compound and Aave. It was originally a parasitic project on the first two, but in 2024 it officially launched the permissionless lending basic protocol Morpho Blue, which became a direct competitor of leading lending projects such as Aave. Morpho Blue’s business has grown rapidly since its launch, and it has been favored by new projects and new assets. Morpho currently provides services on Ethereum and Base.
Business status
Morpho has multiple products, specifically including:
1.Morpho Optimizers
Morpho’s initial product is designed to improve the capital efficiency of existing DeFi lending protocols such as Aave and Compound. By storing user funds on these platforms and earning basic income, peer-to-peer fund matching is performed based on lending needs to optimize the efficiency of fund use.
As Morpho’s first-generation product, Morpho Optimizers has accumulated a large number of users and funds, allowing it to avoid a cold start after launching Morpho Blue. However, although Morpho Optimizers still has a lot of funds, the interest rate optimization brought by its matching function has been so low that it can basically be ignored. This product is no longer the focus of Morpho’s development, and it has banned the deposit and lending of funds since December last year.

Due to the extremely low matching rate, the current optimization of interest rates by Optimizers is only 0.07%. Source: https://optimizers.morpho.org/
2.Morpho Blue (or simply Morpho)
Morpho Blue is a permissionless lending base layer that allows users to create customized lending markets. Users can freely choose parameters such as collateral assets, loan assets, liquidation ratios (LLTV), oracles, and interest rate models to build independent markets. The protocol’s design ensures that no external governance intervention is required, allowing market creators to manage risks and returns based on their own assessments to meet different market needs.
Following the launch of Morpho Blue, its rapid business growth quickly put pressure on the leading lending platform, Aave. In response, Aave introduced the Merit Incentive Program, where users adhering to Aave’s incentive rules are rewarded. Conversely, addresses that also use Morpho face reduced incentives.
Before Morpho Blue’s introduction, most isolated lending market projects focused on niche or innovative assets had limited success. Examples include Euler and Silo, where most capital activity still centered around centralized lending platforms like Aave, Compound, and Spark, which use mainstream blue-chip assets as collateral.
However, Morpho Blue has now successfully navigated this path, and its success stems from several factors:
- A proven track record of security. Before the launch of Morpho Blue, Morpho Optimizers also carried a large amount of funds for a long time without any problems, which gave Defi users good brand trust in Morpho.
- This serves as the foundational lending market protocol, managing supported assets, asset parameters, oracle selection, and fund management authority. The key benefits are:
- The protocol enhances lending market freedom and enables faster responses to market demands. New protocol asset issuers naturally gravitate to Morpho to establish markets and offer leverage services for their assets. Professional risk management firms like Gaunlet can create and manage their own financial vaults, earning directly through performance fees rather than paying service fees to major lending protocols (Aave, Compound, Venus).
- The system enables specialized division of labor in lending services. Each participant focuses on their core competencies while competing freely within the Morpho Blue ecosystem, leading to a broader range of products. Additionally, through this outsourcing model, the team avoids costs associated with self-operated services—including frequent protocol upgrades, code audits, and specialized risk service provider fees.
3.MetaMorpho Vaults
MetaMorpho Vaults are asset management tools that simplify lending by providing liquidity and income opportunities. Users earn returns by depositing assets into professionally managed vaults, each optimized for specific risk profiles and strategies. These vaults primarily direct funds to lending markets built on Morpho Blue.

Morpho’s product structure chart
After understanding Morpho’s product situation, let’s take a look at Morpho’s main business data.
Loan size (Active loans)
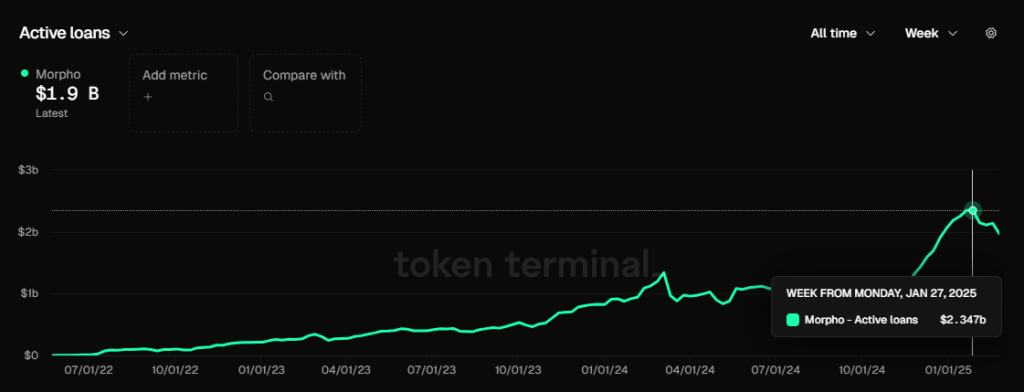
Morpho’s loan size, data source: Tokenterminal
Morphp’s highest total loan size was similar to Aave, reaching $2.35 billion at the end of January, and currently stands at $1.9 billion.
Morpho has not yet officially started protocol fees, so it has not yet generated protocol revenue. However, we can observe the amount of its Fee (the total revenue earned by depositors from the protocol) and use this to calculate the protocol revenue Morpho can obtain if it turns on the protocol fee switch in the future.

Comparison of fees between Morpho and Aave, data source: Tokenterminal
In February 2025, Aave generated a total of US$67.12 million in fees, while Morpho generated US$15.59 million.
In the same period in February 2025, Aave generated protocol revenue of US$8.57 million from the US$67.12 million in fees generated, which means that its approximate fee retention rate is 857/6712=12.8% (just a rough calculation).
Considering that Aave is a lending protocol operated by Aave Dao itself, while it bears the operating expenses of the protocol, all the income from its lending market can go into the project treasury.
Morpho is a basic protocol that serves the lending market. On this basis, there are also many third-party participants active, such as market creators, Vault operators, etc. Therefore, even if Morpho turns on the protocol fee switch in the future, the ratio of protocol revenue it can extract from the fees generated will definitely be significantly lower than Aave (because it needs to be shared with other service providers). I predict that the actual fee retention rate of Morpho should be 30-50% off that of Aave, that is, 12.812.80.3% (30%~50%) = 3.84%~6.4%.
We divide (3.84% ~ 6.4%) * 1559, and we can conclude that assuming Morpho starts protocol charging, the protocol revenue it can obtain from the total fee generated in February is 15.59 million US dollars, which is roughly between 598,700 and 997,800 US dollars, which is 7% to 11.6% of Aave’s protocol revenue.
Token Incentives
Morpho is currently also using its own token Morpho for incentives, but unlike Aave, Morpho directly incentivizes users’ deposit and borrowing behavior, while Aave incentivizes deposit insurance. Therefore, Morpho’s core business data is not as organic as Aave’s.

Morpho’s token incentive board, source: https://rewards.morpho.org/
According to Morpho’s Token Incentive Dashboard, in the Ethereum market, Morpho currently offers an approximate 0.2% comprehensive subsidy rate for borrowing activities and an approximate 2% comprehensive subsidy rate for deposit activities. In the Base market, Morpho’s current comprehensive subsidy rate is approximately 0.29% for borrowing and approximately 3% for deposits.
However, Morpho has consistently made frequent micro-adjustments to its token incentives. Since December last year, the Morpho community has initiated three proposals to gradually reduce Morpho token subsidies for user deposit and borrowing activities.
The most recent adjustment occurred on February 21, where Morpho reduced token rewards on Ethereum and Base by 25%. After this adjustment, Morpho’s annual incentive expenditure is now projected to be:
Ethereum: 11,730,934.98 MORPHO/year
Base: 3,185,016.06 MORPHO/year
Total: 14,915,951.04 MORPHO/year
Based on today’s Morpho market price (March 3, 2024), this corresponds to an annual incentive budget of $31.92 million. Given Morpho’s current protocol size and fee generation, this incentive expenditure appears quite substantial.
However, it is expected that Morpho will continue to reduce its incentive spending in the future, with the ultimate goal of completely discontinuing subsidies.
competition

Data source: Tokenterminal
In terms of market share of total loan amount, Morpho accounts for 10.55%, slightly higher than Spark, but still far behind Aave. We are in the second echelon of the lending market.
Morpho’s competitive advantage
Morpho’s moat mainly comes from the following two aspects:
Good safety history. The birth of the Morpho protocol is not too late. It has been operating for almost three years since it launched revenue optimization products. So far, no major protocol security incidents have occurred, and it has accumulated a good reputation for security. Its increasingly large amount of fund-absorbing data also confirms users’ trust in it.
Focus on basic lending protocols. The benefits of this approach have been analyzed above. It is conducive to attracting more participants into the ecosystem to provide richer and faster loan market options, improve the professionalization of the division of labor, and reduce the operating costs of the protocol.
Main challenges and risks
In addition to facing competition from other lending protocols and the ecological impact of L1 competition between Ethereum and Solana, Morpho’s main challenge is that its token will face relatively large unlocking selling pressure in the next year.
According to tokenomist data, the amount of new tokens Morpho will unlock in the next year is equivalent to 98.43% of the total number of tokens currently in circulation, which means that the token inflation rate in the next year will be close to 100%. Most of the tokens belong to early strategic investors, early contributors and Morpho Dao. The cash out of this huge portion of tokens may put greater pressure on token prices.
Valuation reference
Although Morpho has not yet turned on the protocol fee switch, we have already calculated its revenue after it starts charging based on the protocol fees it creates. Based on its February protocol fee, it speculates that the protocol revenue may be between 598,700 and 997,800 US dollars.
Based on today’s (3.3) Fully Diluted Value (FDV) of $2,138,047,873 (Coingecko data) and the above income data, its Price-to-Sales ratio ranges from 178 to 297. This valuation is notably higher compared to other mainstream lending protocols.
PS of mainstream lending protocols (based on FDV), data source: Tokenterminal
However, if calculated based on the circulating market value, Morpho’s circulating market value today (3.3) is 481,361,461 US dollars (Coingecko data), and its PS is: 40.2~67. Compared with the indicators of other lending protocols, it is not too expensive.
PS of mainstream lending protocols (based on MC), data source: Tokenterminal
Of course, using FDV as a market cap reference is a more conservative valuation comparison method.
1.3 Kamino: The Leading Player on Solana
Kamino Finance is a comprehensive DeFi protocol based on Solana. It was founded in 2022. The initial product launched was an automated management tool for centralized liquidity. It currently integrates lending, liquidity, leverage and trading functions. However, lending is its core business, and most of the protocol’s revenue is also contributed by the lending business. Kamino has a wide range of fees. The fees for the lending business include: commission on interest income, a one-time initial fee charged when borrowing, and liquidation fees. The fees for the liquidity management business include: deposit fees, withdrawal fees, and performance fees.
Business status
Loan size (Active loans)

Kamino’s main data indicators, data source: https://risk.kamino.finance/
Kamino’s current lending size is US$1.27 billion, and its highest lending volume reached US$1.538 billion, which also occurred in late January this year.

Trends in Kamino’s loan size, data source: https://allez.xyz/kamino
Protocol Revenue (Revenue)

Kamino protocol total revenue, source: DefiLlama
January was the highest month for Kamino protocol revenue, reaching $3.99 million. However, February revenue was also good, at $3.43 million.

The Kamino protocol generates income from lending, source: DefiLlama
The lending part accounts for the majority of Kamino’s protocol revenue. Taking January as an example, the proportion of protocol revenue from lending accounted for 89.5%.
Token Incentives
Unlike other lending protocols that directly incentivize users with tokens, Kamino adopts a new incentive model introduced in this cycle — the “Seasonal Points System.” Users earn project points by completing specified incentive actions set by the protocol. At the end of each season, the total allocated token rewards are distributed based on each user’s share of the total points earned.
Kamino’s first season points campaign lasted for three months and distributed 7.5% of the total token supply as a genesis airdrop. The second season campaign also lasted three months and distributed 3.5% of the total token supply.
Based on Kamino’s current token price, the total 11% KMNO tokens distributed across these two seasons are valued at approximately $105 million USD. This significant token reward has been a key driver behind Kamino’s rapid business growth over the past year.
Currently, Kamino’s third points season is still ongoing. Unlike the previous two, the third season began on August 1, 2023, and has been running for over six months without ending yet. Despite its extended duration, Kamino’s protocol growth has continued unaffected. If the third season’s airdrop follows a similar scale to the second season, its incentive value is expected to range between $30 million to $40 million USD.
Notably, one of KMNO’s primary functions is that staking KMNO accelerates users’ points accumulation during the season, enhancing user engagement both with the product and the token itself.
Competition
On the Solana blockchain, the key lending protocols are Kamino, Solend, and MarginFi.
- Kamino: Currently holds 70%–75% of the market share (based on loan volume), a dominance that surpasses Aave’s position on Ethereum.
- Solend: Once the leading protocol in 2022–2023, its growth slowed in 2024, and its market share dropped to under 20%.
- MarginFi: Faced a management crisis in April 2024, resulting in significant user withdrawals, causing its market share to fall to single digits.
Kamino’s Total Value Locked (TVL) has secured a Top 2 position on Solana, second only to the staking-focused platform Jito. Kamino’s lending TVL has also significantly outpaced competitors like Solend and MarginFi.
Kamino’s competitive advantage
Rapid product iteration and good delivery capabilities: Founded by members of the Hubble team in 2022, Kamino was initially designed as Solana’s first concentrated liquidity market optimizer. This early product effectively addressed user needs for automated and optimized liquidity vault solutions. Building on this foundation, Kamino expanded into lending, leverage, and trading, creating a full-stack DeFi product suite. Such integrated DeFi projects covering multiple financial scenarios are relatively rare. Kamino continues to explore new business opportunities, maintaining strong momentum in product innovation.
Positive ecosystem integration capabilities: Kamino has been actively building a cooperation network within and outside the Solana ecosystem. One notable example is the integration with PayPal’s stablecoin – Kamino was the first Solana protocol to come online and support PYUSD lending, and has played a major role in the asset’s expansion. Another example is the cooperation with Solana staking project Jito to launch JitoSOL-related leverage products, attracting a large number of SOL staking users to enter the Kamino ecosystem. When Kamino Lend announces its subsequent upgrade to V2 in 2024, it also plans to introduce new features such as order book lending, support for real-world assets (RWA), and open modular interfaces for other protocols to access. These initiatives will further embed Kamino into the underlying financial infrastructure of the Solana ecosystem. The more other projects are built based on Kamino, the more new capital will prefer to flow into Kamino, making it harder for competitors to shake its position.
Economies of scale and network effects: The DeFi lending sector exhibits a clear “winner-takes-all” dynamic, and Kamino’s rapid growth in 2024 reflects this network effect. Higher TVL and liquidity levels make borrowing on Kamino safer and reduce slippage, further boosting investor confidence in deploying larger funds. Greater capital flow reinforces Kamino’s competitive edge by attracting liquidity, creating a powerful positive feedback loop.
Strong Risk Management Track Record: Kamino has maintained an excellent security record, with no major security incidents or large-scale liquidation losses reported to date. In contrast, competitors like MarginFi have faced disruptions, driving many ecosystem users to migrate to Kamino.
Main challenges and risks
In addition to common risks faced by newer lending protocols such as contract security and asset parameter design, potential problems with Kamino include:
Tokenomics, Inflationary Pressure and Benefit Distribution
The points season model adopted by Kamino is slightly Ponzi, similar to Ethena. If the value of subsequent airdrop tokens is not as expected, it may lead to the loss of some users (of course, at the current scale, the purpose of the project has been achieved). In addition, according to tokenomist data, the amount of KMNO unlocked in the next year will also be quite large. Based on the current circulating tokens, the inflation rate is as high as 170%. Finally, it appears that all of Kamino’s protocol revenue currently goes into the team’s pockets and is not distributed to token holders, nor even into the treasury. There is no sign of the project’s decentralized governance starting in the short term. In the early stages of the project, this is a normal phenomenon. However, if the protocol revenue is not included in the treasury controlled by the project DAO, and there is no transparent governance and financial planning, all of which are exclusive to the core team, then the expected value of the protocol tokens may fall further.
Solana’s ecosystem development
Although the development of Solana ecology in this cycle is obviously better than that of Ethereum, Solana currently has no track type that obviously has PMF except Meme. Defi is still the strength of the Ethereum series. Whether Solana can continue to expand asset classes and capacity and introduce more funds in the future is very important to Kamino’s ceiling.
Valuation reference

Kamino’s 30-day protocol revenue, data source: https://allez.xyz/kamino/revenue
We use Kamino’s protocol revenue in the past 30 days and its FDV as the benchmark, and perform PS calculation on its FDV and MC (based on Coingeko market value data), and we get:
FDV PS=34, MC PS=4.7, these revenue multiples are not high compared to other mainstream lending protocols.
1.4.MakerDAO: An Old Tree Blooming with New Flowers?
MakerDAO is the oldest DeFi protocol on the Ethereum blockchain, founded in 2015, marking its 10th anniversary this year. Thanks to its first-mover advantage, MakerDAO’s stablecoin DAI (including its upgraded version, USDS) has long been the largest decentralized stablecoin in the market.
In terms of business model, MakerDAO’s main income comes from the difference between the stability fee paid by generating DAI and DAI. This model is also very similar to the interest rate difference of the lending protocol: borrowing DAI from the protocol requires payment of fees; providing excess liquidity (via sUSDS and sDAI) to the protocol can earn interest.
From an operational standpoint, the process of obtaining DAI via a Collateralized Debt Position (CDP) — by depositing ETH to mint DAI — is quite similar to depositing ETH in Aave to borrow USDC. For this reason, in early DeFi analyses, many considered CDP protocols like MakerDAO to be a type of lending protocol. Following its recent rebranding to Sky, MakerDAO also launched a separate lending protocol called Spark, further solidifying its presence in the lending sector. Therefore, MakerDAO can now be considered part of the lending ecosystem, which is why it is included in this section for analysis.
Business status
Loan size (Active loans)
For a stablecoin protocol, the most important metric is its stablecoin size, a concept that also corresponds to the loan size of a lending protocol.

Source:Sky official website
MakerDAO’s lending scale is currently close to US$8 billion, which is still far from the high of US$10.3 billion in the last cycle.
Spark’s loan size is about US$1.6 billion, which is higher than the old lending protocol Compound and slightly lower than Mophro mentioned above.
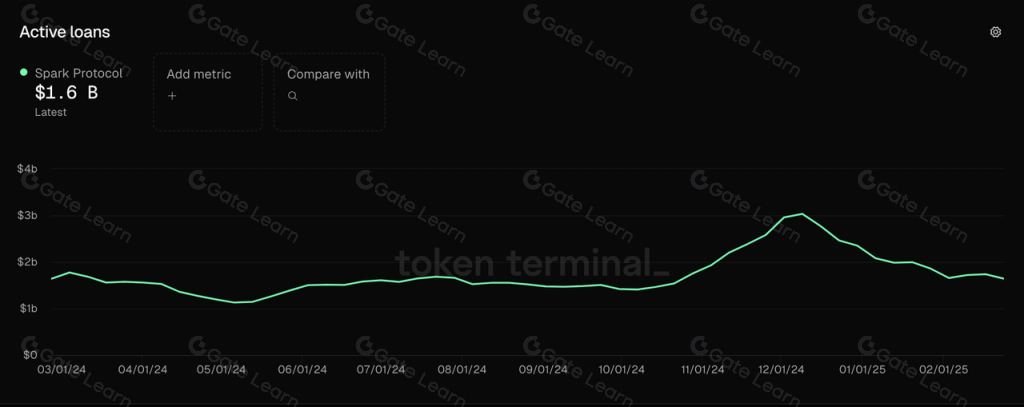
Data source: Tokenterminal
Protocol revenue (Revenue)
The concept of MakerDAO corresponding to the protocol income of the lending protocol should be the sum of the income of the protocol, minus the interest costs paid to sDAI and sUSDS. From the figure below, we can see that among MakerDAO’s current protocol revenue, stability fee revenue is US$421 million, accounting for the vast majority of its revenue. Others, such as clearing fees and price stability module fees, contribute very little to revenue.

MakerDAO’s historical income Source: sky official website
Among the stability fees, the DAI released by the protocol through Spark is expected to generate an annual stability fee of US$140 million. The DAI generated directly by USDC can also obtain a stability fee of US$125 million. These two parts account for 2/3 of the stability fee. The remaining stability fees come from DAI generated by RWA (US$71.83 million) and DAI generated by crypto asset mortgages (US$78.61 million).

MakerDAO’s liability composition and annual income Source: sky official website
In order to incentivize the generation of stability fees on this scale, MakerDAO is expected to pay a deposit cost (Saving Expense) of US$246 million a year. Subtracting the two, MakerDAO’s annual protocol revenue is approximately US$175 million, with an average weekly protocol revenue of US$3.36 million.
Of course, MakerDAO also announced their protocol operating expenses, which are as high as $96.6 million for one year of the protocol. After deducting operating expenses from the protocol revenue, a “net profit” of approximately US$78.4 million can be obtained, which is also the main source of repurchase funds for MKR and SKY.
Token Incentives
One of the reasons for MakerDAO’s previous brand upgrade was that it no longer had excess MKR reserves to incentivize new business additions. Currently, MakerDAO’s token incentives are mainly used to encourage USDS deposits. In the five months since the incentive plan was launched at the end of September 2024, a total of 274 million SKY incentives have been released, equivalent to approximately US$17.4 million, and the annualized incentive amount is approximately US$42 million.

source:Sky official website
competition
Currently, MakerDAO’s stablecoin market share accounts for 4.57%. Stablecoins are one of the clearest tracks for cryptocurrency demand. As an established stablecoin, MakerDAO has formed a certain moat, including brand effect and first-mover advantage. This was very obvious in the Curve liquidity battle in the last cycle. DAI, as one of the 3CRVs, can obtain a large amount of incentives released by other stablecoin projects in order to build popularity without any operation.
However, in the competition on the stablecoin track, the situation of MakerDAO is not optimistic. We can also see from the market share in the figure below that MakerDAO’s market share (pink block) did not increase but decreased during this cycle.

Market share of the top ten stablecoins Source: Tokenterminal
The author believes that the core factor causing this phenomenon is that DAI, as the third largest stable currency, has lost (or never really had) its function as a settlement tool. Currently, users hold USDT and hold DAI for completely different purposes: holding USDT mainly uses it as a settlement tool, while the purpose of holding DAI is to increase leverage and obtain income. From this aspect, apart from the fact that both are anchored to the US dollar, they do not seem to have much in common.
Stablecoins with settlement functions have very good network effects. Unfortunately, DAI basically does not have the settlement function, making it difficult to form a network effect.
Reflected in the issuance scale, DAI’s market share is gradually declining. DAI has not yet returned to the issuance scale at its highest point in 2021, while the issuance scale of USDT continues to rise and has now doubled compared to the end of 21.
The ceiling of stablecoins that are only used as income tools is limited, and scale growth depends on the continued stimulation of income, and relies on many external conditions (such as relatively high U.S. Treasury bond interest rates). How to form long-term organic growth is the key to whether MakerDAO can sprout new flowers from the old tree in the stable currency market.
Main challenges and risks
In addition to the challenges we analyzed above, MakerDAO faces competition from newcomers.
The emerging stablecoin player Ethena has experienced rapid growth, reaching 60% of MakerDAO’s market size in less than one year since its launch. Like MakerDAO, Ethena’s core product is also a yield-generating stablecoin, but Ethena has a significant advantage — its revenue base, derived from crypto perpetual contract arbitrage, offers substantially higher returns than MakerDAO’s U.S. Treasury RWA (Real World Asset) yields. In the medium to long term, if U.S. Treasury rates continue to decline, USDE (Ethena’s stablecoin) is likely to demonstrate a stronger competitive advantage over DAI.
Additionally, MakerDAO’s governance capabilities have raised concerns. Despite MakerDAO’s team spending $97 million annually, its governance has proven to be inefficient and non-transparent. The most notable example of this inefficiency is the decision to rebrand MakerDAO as Sky, only to later reconsider reverting back to the Maker brand — a process that appeared disorganized and inconsistent, almost like child’s play.
Valuation reference
Based on a protocol revenue of US$175 million, MKR’s current PS is about 7.54, which is still relatively cheap compared to its main competitor Ethena (22). Historically, MKR’s PS has also been lower.

PS of stablecoin projects other than MakerDAO. Source: Tokenterminal
2: Liquid Staking Sector - Lido and Jito
Liquid staking is one of the native sectors in the crypto space. Compared to traditional staking, liquid staking offers better liquidity and composability, which ensures strong demand. It also plays a crucial role in the ecosystems of Proof-of-Stake (PoS) chains. Currently, on the two most important PoS chains — Ethereum and Solana — the largest TVL protocols are both liquid staking protocols. These two protocols, Lido and Jito, are the focus of the following analysis.
The most critical metric for assessing liquid staking projects is the assets staked. For liquid staking projects, this value is equivalent to their TVL (Total Value Locked). Since liquid staking protocols involve an additional third party — node operators — besides the end users, a portion of the protocol’s revenue is distributed to these node operators. Therefore, compared to evaluating total protocol revenue, assessing the protocol’s gross profit may be a more suitable metric for liquid staking protocols. Additionally, it’s essential to assess the protocol’s expenditure metrics, particularly its token incentives.
2.1 Lido: Navigating Ethereum with Caution
Business status
Lido’s business launched in late 2020 following the opening of ETH staking. Within six months, Lido successfully established itself as the leading liquid staking provider on the Ethereum network. Previously, Lido was also the largest liquid staking provider on the Luna network and the second-largest on the Solana network. Lido had expanded its services across nearly all major PoS networks. However, starting in 2023, Lido began a strategic contraction, and currently, ETH liquid staking remains Lido’s only active service. Lido’s business model is relatively straightforward: users’ staked ETH is allocated to various node operators, and Lido collects 10% of the staking rewards as protocol revenue.
Assets staked
Currently, over 9.4 million ETH is staked via Lido, representing approximately 8% of the circulating ETH supply. This makes Lido’s staked asset value (TVL) exceed $20 billion, positioning it as the largest protocol by TVL in the entire DeFi ecosystem. At its peak, Lido’s TVL approached $40 billion.

Data source: Tokenterminal
The fluctuations in the scale of staked assets calculated in ETH are much smaller. Since entering 2024, the overall scale of ETH staked by Lido has not changed much. The fluctuations in the scale of Lido’s staked assets come more from the fluctuations in the price of ETH.

Lido staked asset size calculated in ETH Source:DeFillama
Lido’s staked assets continue to grow, mainly due to the gradual increase in the pledge rate of the Ethereum network (from 0 to 27%). As a leading liquidity pledge service provider, Lido has enjoyed the dividends of the overall market size growth.
Gross Profit
Lido extracts 10% of the pledge revenue as protocol revenue. Currently, 50% of the protocol revenue is allocated to node operators, and 50% belongs to the DAO, that is, 5% is gross profit. From the figure below, we can see that the gross profit of the Lido protocol has generally increased steadily. In the past more than a year, the weekly gross profit of the Lido protocol has fluctuated between US$750,000 and US$1.5 million.

Data source: Tokenterminal
It can be seen that Lido’s protocol income is strongly related to the scale of staked assets, which is determined by their fee structure. The changes in Lido’s weekly protocol revenue are also mainly due to the fluctuations in the price of ETH.
Token Incentives
In the first two years of the protocol’s launch (2021-2022), Lido spent a huge amount of LDO token incentives to stimulate the liquidity of its stETH and ETH. In two years, it spent more than 200 million U.S. dollars in token incentives, which also made Lido in 2 In the face of severe market liquidity crises such as China’s ban on BTC mining in May 2021, the collapse of LUNA in May 2022, and the collapse of FTX in November 2022, it still ensured the liquidity of ETH and gained the current leading position in liquidity staking on the Ethereum network.
After that, Lido’s spending on token incentives dropped significantly, with less than $10 million spent on token incentives in the past year. And the main direction of token incentives is in the direction of the ecosystem. Lido requires almost no token incentives to maintain its current market share.

Data source: Tokenterminal
Competition
Among liquid staking projects on the Ethereum network, few competitors can rival Lido. Currently, the second-largest liquid staking project, Rocket Pool, holds a staked asset volume that is less than 10% of Lido’s.
Among newer projects, the one posing some competitive pressure on Lido is the Liquid Restaking project ether.fi. However, ether.fi’s staked asset volume is currently only about 20% of Lido’s. Moreover, with the launch of EigenLayer’s token, ether.fi’s staked asset growth has slowed significantly, reducing the likelihood that ether.fi will pose a serious challenge to Lido’s dominance in Ethereum staking.


Source Dune
Over its long-term development, Lido has established a significant moat based on the following factors:
- The network effect brought about by stETH (wstETH)’s good liquidity and composability. In addition to the strong liquidity advantage mentioned earlier, stETH is accepted as collateral by all major lending and stablecoin protocols, giving it an unparalleled advantage in composability among LSTs (Liquid Staking Tokens). This composability factor significantly influences new stakers’ choices.
- Security credit accumulation and brand recognition: Since its launch, Lido has maintained a strong security record with no major incidents. Combined with its long-standing market leadership, this reputation has made Lido a preferred choice for whale investors and institutions when selecting staking services. For example, Justin Sun and Mantle (before developing their own mETH) are notable examples of major users who have utilized Lido’s services.
Main challenges and risks
Lido’s main challenge comes from the decentralization demands within the Ethereum network.
In PoS chains, stakers play a crucial role in consensus formation. The Ethereum ecosystem is particularly dedicated to decentralization, making it more stringent about Lido’s dominance. As Lido’s staked asset volume reached 30% of Ethereum’s total staked ETH, concerns have repeatedly emerged regarding the need to limit Lido’s growth. The Ethereum Foundation has also been actively adjusting its staking mechanisms to prevent the emergence of overly dominant staking entities.
For dapps, the biggest challenge for mid- to long-term Lido is that the only public chain they use to develop their business does not support or even restrict their business development. While Lido identified this risk early and began focusing exclusively on Ethereum by discontinuing support for all other chains in 2023, the results have been limited so far.
On the other hand, while Ethereum’s staking rate is currently just under 30% (28%), this remains significantly lower than other leading PoS chains such as Solana (65%), Cardano (60%), and Sui (77%). However, the Ethereum team has historically opposed excessive ETH staking and has suggested capping the staking rate at 30%. This policy further limits Lido’s potential growth in the staking market.
Lastly, Ethereum’s underwhelming performance during this market cycle has also weighed heavily on Lido. As a protocol whose concept and business metrics are closely tied to ETH’s price performance, Lido has faced considerable struggles in this cycle as well.
Valuation reference
In the past year, LDO’s PS has been at a historically low range, especially in the past six months, its PS has been below 20.

It is also worth pointing out that within this year, there is a possibility that the protocol income will be converted into $LDO income. Starting in 2024, there have been many proposals in the community to distribute the protocol revenue (5% of the portion allocated to the DAO) to $LDO holders. However, the core team clearly opposed it from a prudential perspective and failed to pass multiple governance process votes. Nevertheless, with a significantly relaxed regulatory environment and the protocol achieving accounting profit starting in 2024 (where protocol revenue exceeds all expenses, including team salaries), the core team has officially included the discussion of linking protocol revenue directly to $LDO in its 2025 objectives. This development suggests that by 2025, we may see $LDO holders begin to receive a share of the protocol’s staking revenue.

Lido protocol economy (the blue-purple line in the picture is the “net profit” of the protocol) Source: Dune
2.2 Jito: Making a fortune silently in Solana
Business status
Jito is the leading liquid staking provider on the Solana network and also serves as Solana’s MEV (Maximal Extractable Value) infrastructure. In 2024, Jito expanded its services to include restaking, although the current restaking scale is still relatively small, with a TVL (Total Value Locked) just exceeding $100 million. Additionally, the revenue sources for the restaking segment remain somewhat unclear. For now, Jito’s core business continues to focus on its liquid staking services and MEV services.
The liquidity staking service provided by Jito on Solana is similar to Lido’s on the Ethereum network. The SOL deposited by users is involved in Solana’s pledge through node operators, and 10% of the user income is extracted as protocol income.
Previously, the Jito Labs team collected 5% of all MEV revenue. However, following the launch of NCN (Node Consensus Networks) and the implementation of the JIP-8 proposal at the end of January 2024, Jito’s MEV revenue distribution was adjusted. The revised revenue distribution is as follows: Jito DAO will receive 2.7%, staking JTO Vault will receive 0.15%, and jitoSOL and other LST pledgers will receive 0.15%.
When users conduct transactions in Solana, the gas fees they pay can be divided into three categories: basic fees, priority fees and mev tips. Among them, the basic fee must be paid, and the priority fee and mev tip are optional payments. The main purpose is to increase the priority of the transaction. The difference is that the purpose of the priority fee is to increase the priority of the transaction on-chain phase. It is a unified setting of the Solana protocol layer and belongs to the verifier ( That is, the pledger); and MEV tipping is a separate protocol between the user and the MEV service provider. The purpose is to obtain a higher transaction priority at the MEV service provider so that its transaction can be constructed first (and then be uploaded to the chain). The specific allocation is determined by the MEV service provider.
Currently, Jito’s MEV service returns 94% of the fees collected to the verifiers, 3% is extracted by Jito labs, and 3% is allocated to the Jito protocol. In the previous gas fees of the Solana network, the proportion of basic fees was relatively small and could be ignored, and the priority fee was equivalent to the MEV tip.

Solana network’s REV (i.e. the total amount paid by users) Source:Blockworks
Compared to Lido’s position on Ethereum, Jito holds near-monopoly dominance in MEV services within the Solana ecosystem, allowing it to capture greater value from MEV revenue (similar to how Flashbots dominates MEV services in the Ethereum ecosystem).
Next, let’s look at Jito’s specific data:
Assets staked
Currently, Jito’s staked asset volume (via liquid staking) exceeds $2.5 billion USD.

Data source: Tokenterminal
Calculated in terms of SOL, Jito’s staked SOL amount is 15.82 million, accounting for approximately 3% of the total SOL circulation. In the past year, staked SOL has shown a steady linear increase.

Source: Jito official website
In the field of MEV, Jito has a near-monopoly in Solana. More than 94% of the 394 million SOL currently staked use Jito’s MEV service.

Source:Jito official website
Gross Profit
Jito’s current protocol revenue has two parts. They charge 10% of the revenue generated from liquidity staking and 3% of the MEV revenue. Currently, Jito distributes 4% of its liquidity staking income to node operators, so the gross profit of its liquidity staking part is 60% of its revenue. Since the author has not found a separate data source for Jito’s gross profit, we use Jito’s income for analysis, as shown in the figure below:

Data source: Tokenterminal
It can be seen that Jito’s income is completely related to the popularity of the Solana network. Its income has increased by an order of magnitude since October 24, with weekly income exceeding 1 million US dollars. There are two significant high points in this part of income: on November 20 and January 20, Jito’s protocol income in that week was as high as 4 million US dollars and 5.4 million US dollars respectively, which corresponded to two major speculation booms on the chain. However, Solana’s revenue has also dropped rapidly after the recent cold on the Solana chain.
Regarding the MEV part, it may be because mev revenue sharing has just been launched. The author has not found statistics on this part in the current mainstream statistics websites and Dune, but we can make a calculation based on JitoMEV’s total revenue. The picture below shows Jito’s total MEV income:

Jito’s total MEV revenue Source:Jito official website
Jito’s total MEV income is consistent with the income trend of Jito’s liquidity staking part. At its peak on January 20 this year, the total MEV income was 100,000 SOL. After October 2024, the average daily MEV income will be around 30,000 SOL, with the lowest value being 10,000 SOL.
We measured the income during this period based on the agreed income rate of 3%. The highest single-day income was 3,000 SOLs, which was about 840,000 US dollars at the price at that time. The highest weekly income was 14,400 SOLs, about 3.7 million U.JIP-8 proposalThere have been predictions in , interested readers can read it by themselves).
Overall, in addition to the current liquidity staking income, income from MEV can roughly increase Jito’s income scale by another 50%;
From the perspective of gross profit scale, the gross profit of liquidity staking income is about US$600,000 per week on average, while the gross profit of MEV income is as high as 95% (only the 0.15% allocated to jitoSOL is not considered gross profit, and the part entered into DAO and JTO Vault can be counted as gross profit). The corresponding gross profit is about US$1 million per week, which can increase Jito’s gross profit by about 150%, and the annualized gross profit is about US$85 million.
It should be pointed out that Jito’s revenue and gross profit are closely related to the popularity of Solana network. After the recent meme trading boom on Solana network subsided, its single-day revenue dropped to about 10% of its peak, and the data fluctuated greatly.
Token Incentives
Whether it is liquidity staking or MEV, Jito does not provide token incentives for its business. What counts as token incentives is only the one-time airdrop of 10% of the tokens when it goes online.
competition
Restaking has not yet produced a real PMF, so we will mainly analyze Jito’s competition in terms of liquidity staking and MEV.
In Solana’s liquidity staking market, the business was only officially launched in 2023, but it was the first to arrive and is now in the leading position. The previous leaders Marinade and Lido once occupied more than 90% of the entire Solana liquidity staking market, but they were surpassed by Jito due to their own reasons.


Solana Liquidity Staking Market Share Source:Dune
Since late 2023, Solana’s liquid staking market has welcomed more players, with Blazestake, Jupiter, and others successively joining the battlefield, though Jito’s market share remained unaffected. However, starting in October 2024, exchange-based SOL liquid staking products (primarily Binance’s bnSOL and including Bybit’s bbSOL) led to a decline in Jito’s market share, mainly because centralized exchanges have natural advantages in asset custody. They converted their SOL financial products from native staking to liquid staking, providing users with an enhanced experience, thus rapidly increasing their market share. As we can see from Figure 1 above, the incremental portions from bnSOL and bbSOL are relatively “independent” and have not encroached upon the market share of certain LST protocols.
Currently, over 90% of Solana’s staking is still native staking, with less than 10% being liquid staking, showing significant room for growth compared to Ethereum’s approximately 38%. Of course, for ordinary users, participating in Solana native staking is much easier than participating in Ethereum native staking, so Solana’s liquid staking proportion may not ultimately reach Ethereum’s levels. However, liquid staking still brings relatively better liquidity and composability. In the future, Jito will continue to benefit from the overall growth in Solana’s liquid staking scale.

Solana’s staking market share Source:Dune
In the MEV field, Jito, which occupies more than 90% of the market share, has almost no competitors. This part of the market space mainly depends on Solana’s future activity on the chain.
Overall, Jito has a relatively solid lead in the Solana network’s liquidity staking and MEV fields. Previously, when the SEC’s ETP working group consulted on ETF staking issues, it invited Jito, which also showed this.
Main challenges and risks
Jito’s current business and income are highly dependent on the popularity of the Solana network, so the main risks Jito faces also come from this. After TRUMP and LIBRA, the market’s enthusiasm for Meme quickly cooled down, the price of SOL also fell rapidly, and Jito’s business income also decreased rapidly. Whether Jito’s business can regain its momentum in the future mainly depends on the popularity of the Solana network.
In the field of liquidity staking, competition from centralized exchanges may affect Jito’s market share.
From an investment perspective, another possible risk is that the circulation ratio of JTO tokens is less than 40%. In December last year, a large proportion of 15% was unlocked, and it will continue to be linearly unlocked in the next two years. The inflation rate will reach 62% in the next year. Selling pressure from early investors is also a potential risk factor.

source:from tokennom
Valuation reference
With the recent popularity of Solana, JTO’s full-circulation PS valuation has dropped rapidly and has now dropped to around 33. This valuation has not yet taken into account the MEV income that has started recently. If MEV income is considered, JTO’s full-circulation valuation will be reduced to around 22.

Data source: Tokenterminal
Furthermore, JTO is expected to accelerate its revenue dividend process. Currently, 0.15% of the protocol’s MEV revenue is allocated to JTO stakers, and in the future, as revenue continues to grow, JTO stakers may receive a higher proportion of revenue distribution.
Disclaimer:
- This article is reprinted from [MintVentures]. Forward the Original Title‘Gold Rush in the Sand: Finding Long-term Investment Targets Through Bulls and Bears (2025 Edition Part 1)’, the copyright belongs to the original author [Alex Xu, Lawrence Lee], if you have any objection to the reprint, please contact Gate Learn team, the team will handle it as soon as possible according to relevant procedures.
- Disclaimer: The views and opinions expressed in this article represent only the author’s personal views and do not constitute any investment advice.
- Other language versions of the article are translated by the Gate Learn team and are not mentioned in Gate.com, the translated article may not be reproduced, distributed or plagiarized.
Share
Content


Related Articles

In-depth Explanation of Yala: Building a Modular DeFi Yield Aggregator with $YU Stablecoin as a Medium

The Future of Cross-Chain Bridges: Full-Chain Interoperability Becomes Inevitable, Liquidity Bridges Will Decline

Solana Need L2s And Appchains?

Sui: How are users leveraging its speed, security, & scalability?

Navigating the Zero Knowledge Landscape