1. What Is the Similar Candlestick Feature?
The Similar Candlestick (also called Pattern Forecasting) is an intelligent market analysis and decision-support tool designed specifically for trading.
It uses built-in smart algorithms to automatically analyze the current market candlestick patterns and quickly compare them with historical data to find the most similar K-line charts in history.
This helps provide an objective and intuitive reference for market trend analysis, enabling traders to better understand market dynamics and optimize their trading decisions.
By using the Similar Candlestick tool, traders can quickly discover historical charts with high similarity and predict potential market trends or identify recurring patterns based on similarity scores and rise probability.
2. Technical Principles of Similar Candlestick
The Similar Candlestick function is based on an automatic pattern-matching search algorithm for K-line charts.
It intelligently compares the real-time market trends of the selected symbol with historical K-line data, identifying the most similar segments dynamically and comprehensively.
Unlike traditional fixed indicators or pattern templates, this algorithm focuses on the intrinsic shape and dynamics of the market movement, allowing for flexible, real-time pattern recognition that can assist in technical analysis and trading decisions.
3. How to Use the Similar Candlestick Feature
3.1 How to Access
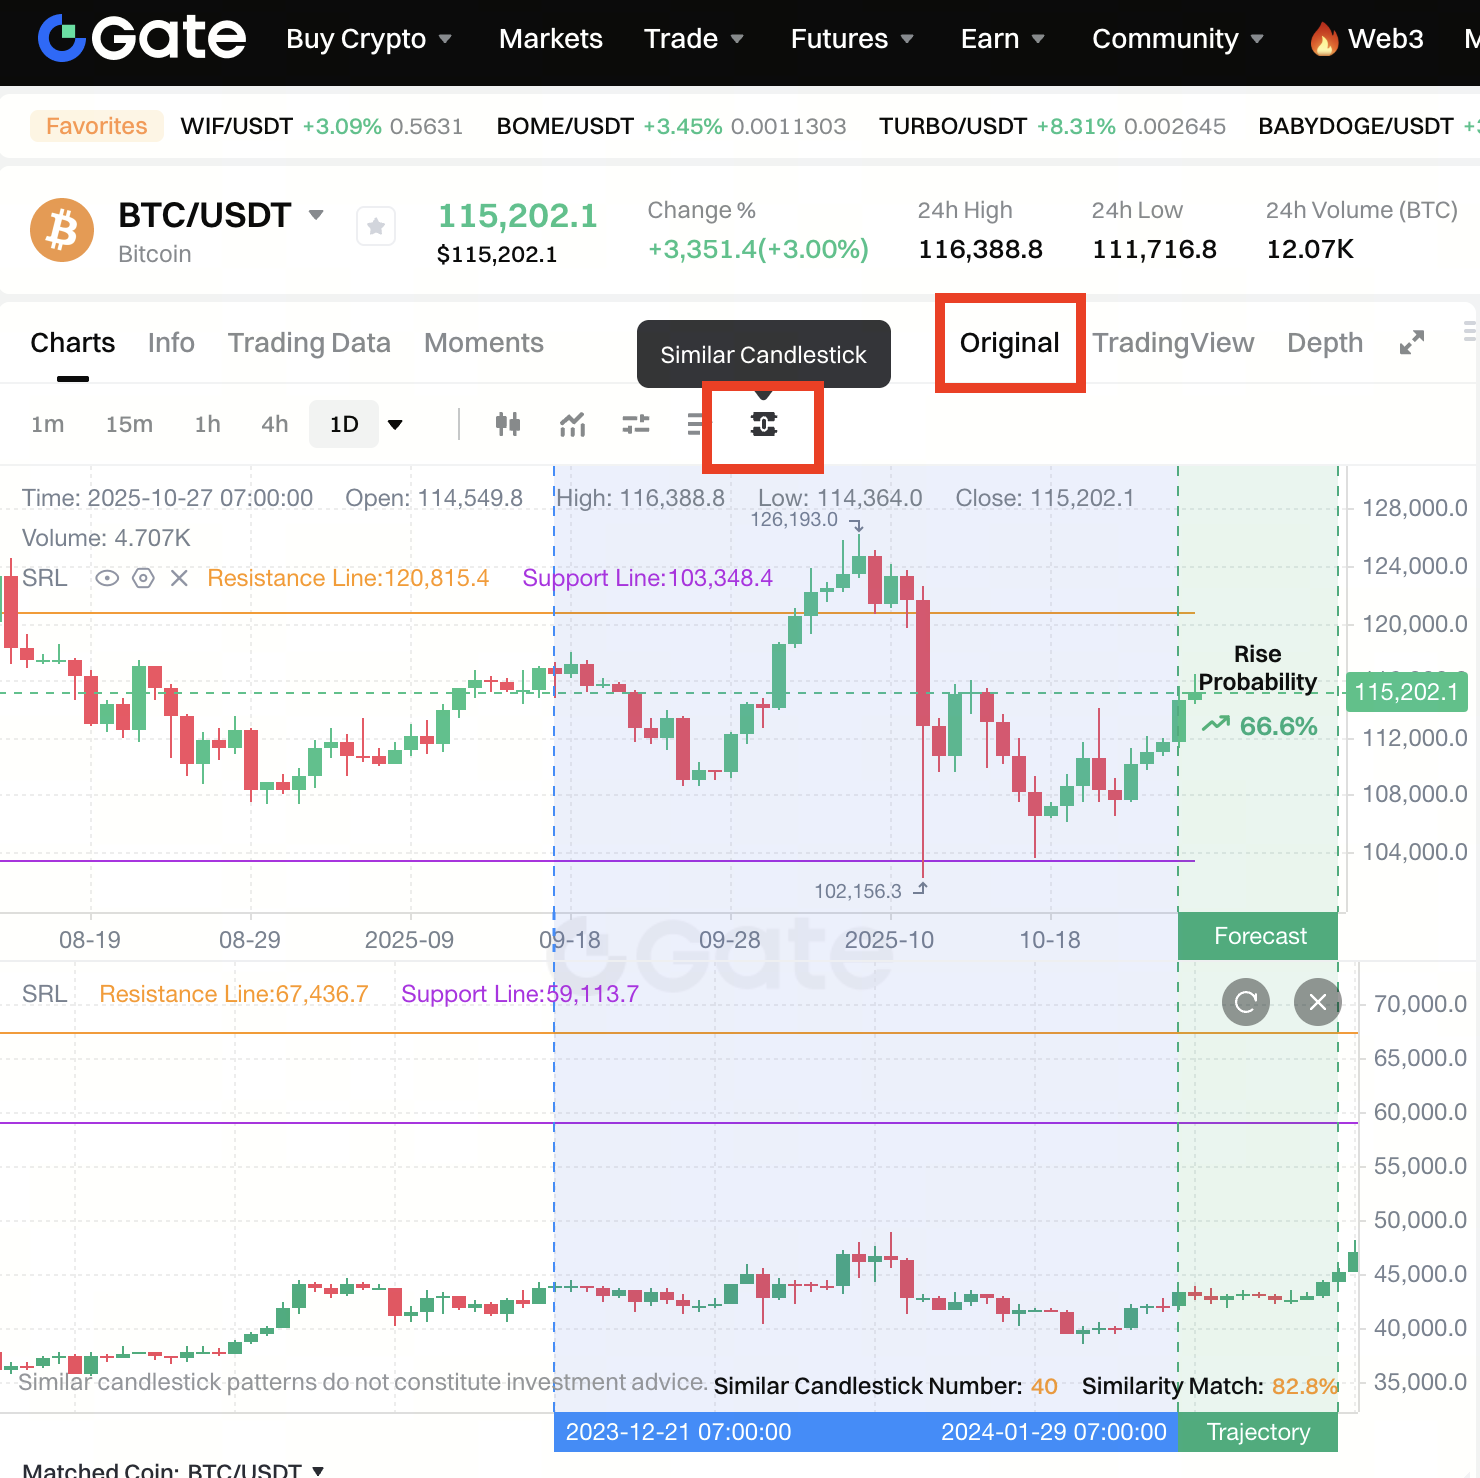
On the web version of the K-line chart page, switch to [Basic Version], then click [Similar Candlestick] to enable the feature.
Click [Similar Candlestick] again to disable it and return to the standard K-line chart.
3.2 Interface Overview
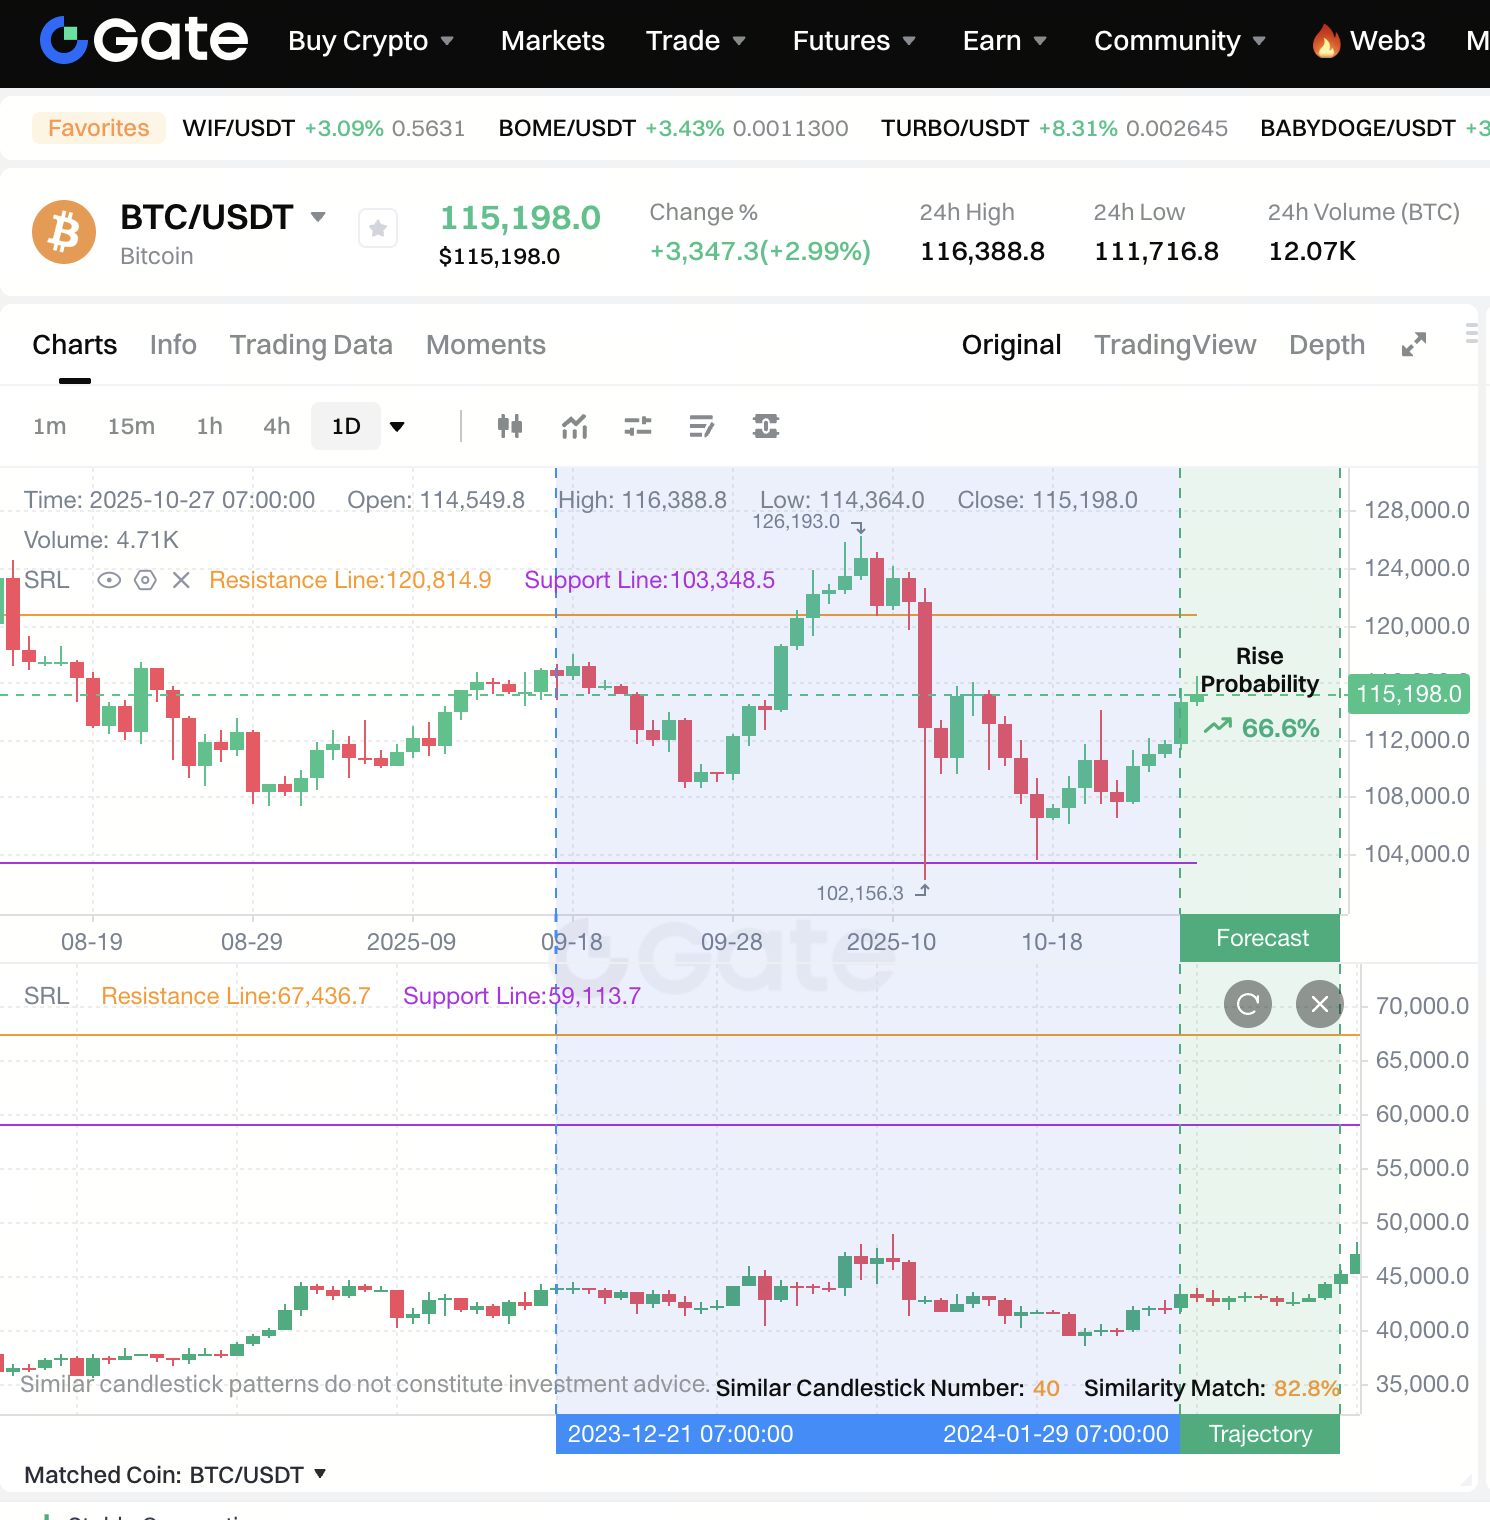
The Similar Candlestick interface consists of the following areas:
Top Candlestick Chart Area:
- Displays the latest candlestick movements and indicators of the selected symbol.
- Shows the most recent 40 periods of candlestick data, various indicator buttons, and the [Similar Candlestick] toggle button on the right.
Bottom Similar Pattern Area:
- Displays the matched historical K-line pattern that most closely resembles the current trend.
- Shows the matched historical range and subsequent trend trajectory.
- Provides data on Similarity Match, Number of Similar Candles, and the computed Rise Probability.
Function Buttons:
- Refresh: Located at the top-right of the Similar Candlestick interface. Refreshes and recalculates the matching results to ensure real-time accuracy.
- Exit (Delete): Exits the Similar Candlestick mode and returns to the standard K-line chart view.
3.3 Cross-Currency Similar Candlestick Matching
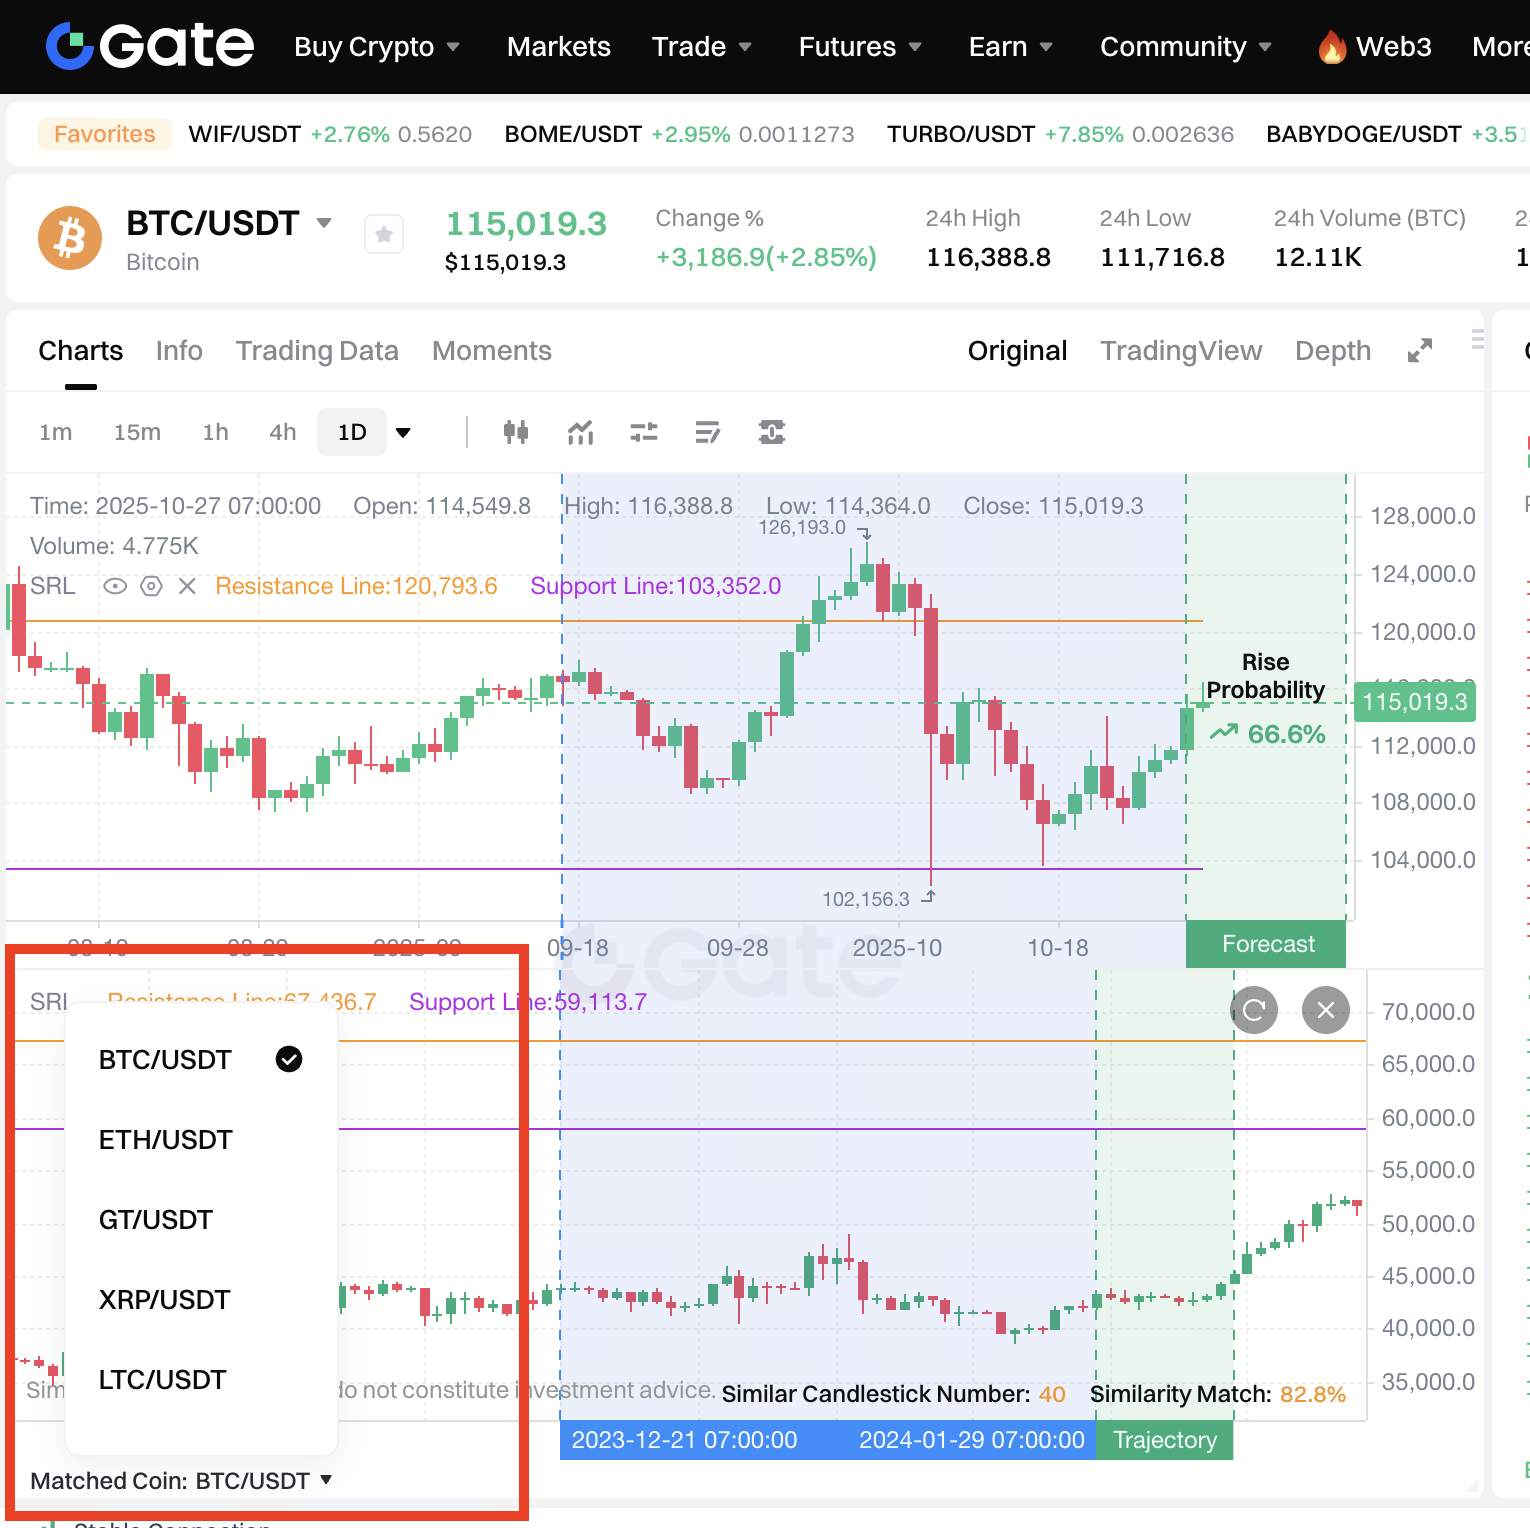
By default, the tool matches historical K-lines of the same trading pair.
However, users can manually switch to cross-currency matching in the bottom-left corner to compare similar trends between other major base currencies and the current symbol.
For non-mainstream pairs, BTC/USDT will be displayed as the default comparison.
When switching pairs, the interface automatically refreshes and updates the similarity metrics.
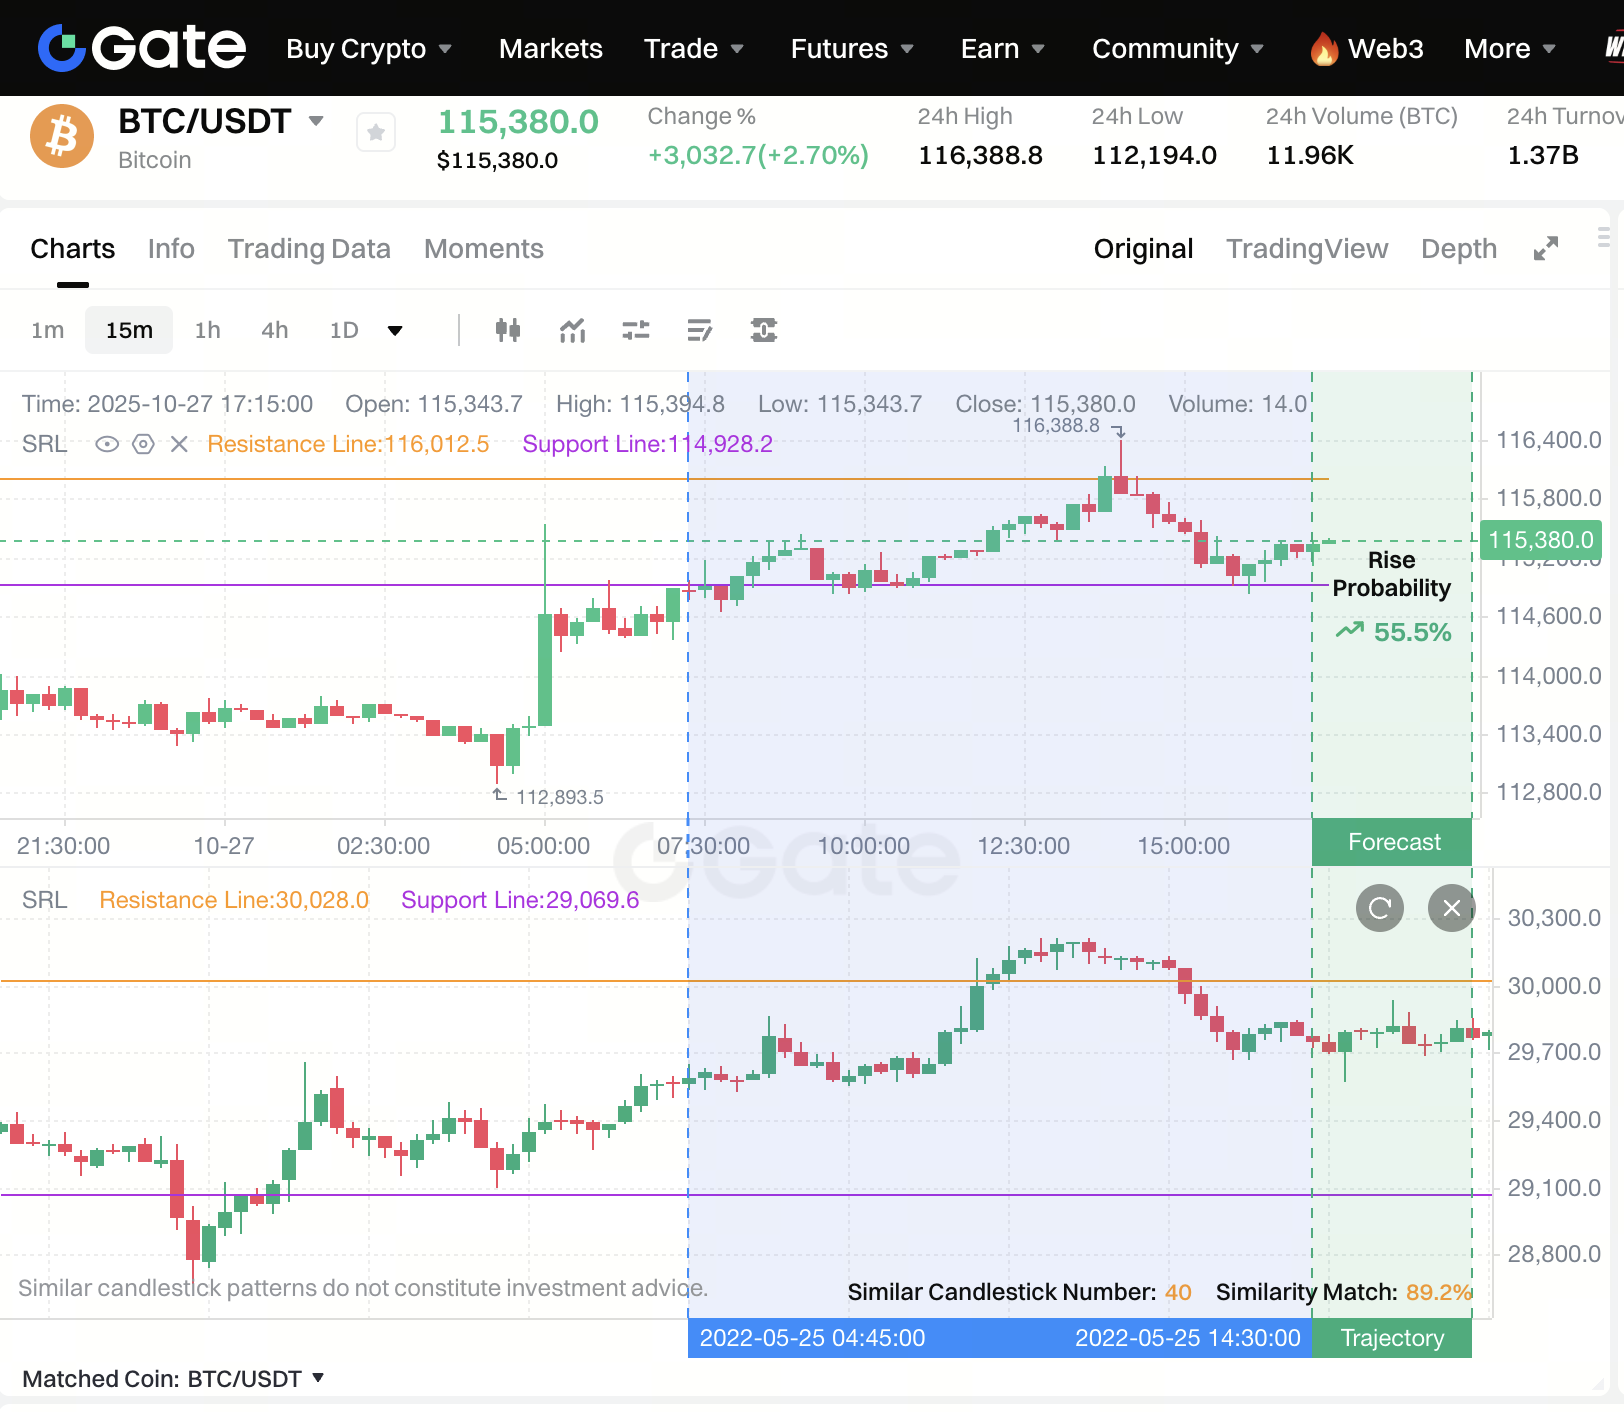
3.4 Similar K-Line Rise Probability Forecast
Based on the Similar K-Line Matching results, the system performs intelligent data analysis on historical rising trends to forecast the probability of an upcoming price increase.
It aggregates all highly similar K-line patterns and calculates a Rise Probability value.
The Rise Probability is shown in clear yellow text to provide users with an intuitive trend indicator.
The highest displayed value is 99.0% , and the lowest is 1.0% .
With the matched similar K-line pattern , the similarity match percentage , and the rise probability forecast , users can analyze the data and make bullish or bearish trading decisions.
For example, when trading BTC/USDT and viewing the 1-minute K-line chart, the system automatically captures the latest 40 one-minute candlesticks and searches for historical charts with similar patterns.
It then identifies and displays the most similar one-minute K-line pattern in the lower section for comparison, showing the Similar Candlestick Number , Similarity Match , and the Rise Probability Forecast .
- When the Similarity Match is high (e.g., 90%) and the Rise Probability is also high (e.g., 80%), it suggests a bullish signal.
- When the Similarity Match is high but the Rise Probability is low (e.g., 20%), it indicates a bearish signal.
3.5 Supported Scope
Supported Market Types:
- Spot Market
- USDT-M Perpetual Futures Market
Supported Symbols and Timeframes:
- The tool currently supports major market-cap coins only.
- Available intervals: 5m, 15m, 30m, 1h, 2h, 4h, 6h, 8h, 12h, and 1D.
- BTC and ETH additionally support 1m and 3m intervals.
Restrictions:
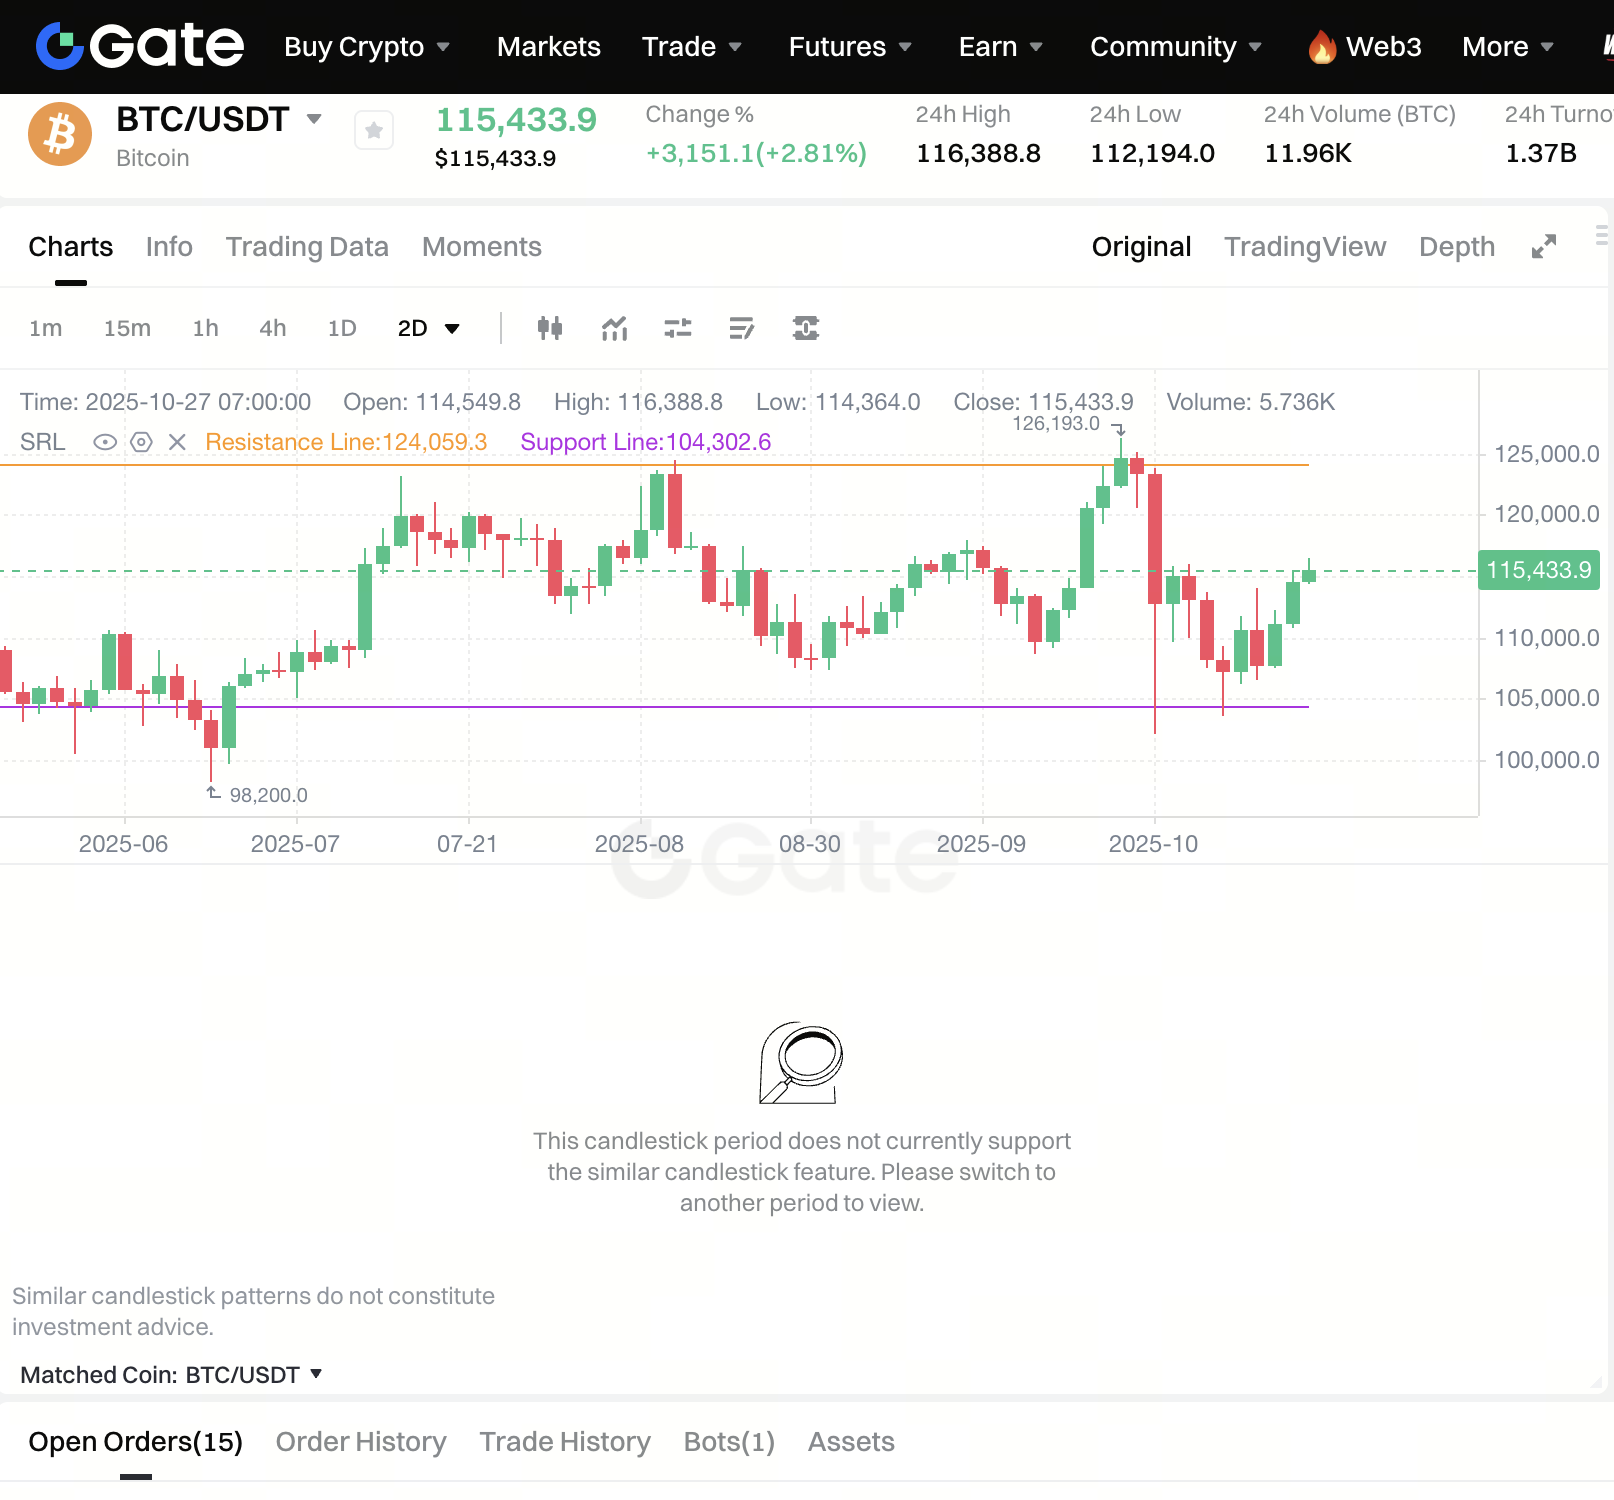
If the selected symbol or timeframe is not supported, the lower chart area will remain blank and display a notification message.
3.6 Risk Disclaimer
The Similar Candlestick tool provides historical chart analysis for reference only and does not guarantee future results.
Market conditions can change rapidly due to factors such as liquidity, sentiment, and policies.
Please avoid using this feature as the sole basis for trading decisions. Always combine it with multiple indicators and fundamental analysis for a more comprehensive view.
Trading involves risks. The Similar Candlestick tool is a technical analysis aid, not a prediction guarantee.
4. Tips and Best Practices
4.1 Focus on High-Similarity Matches
Prioritize results with similarity scores above 80%, as they often reveal clearer and more meaningful patterns.
4.2 Confirm Trends with Volume
When identifying similar trends, observe recent trading volume.
A breakout with strong volume confirms a higher chance of trend continuation, while low volume may suggest weakness or reversal risk.
4.3 Combine with Traditional Indicators
Enhance accuracy by combining with MACD, KDJ, RSI, etc.
For example:
- If Similar Candlestick shows an uptrend and MACD forms a golden cross while RSI turns upward, multiple confirmations increase reliability.
- If it suggests a pullback and KDJ shows a death cross while RSI is overbought, proceed cautiously.
4.4 Analyze Across Multiple Timeframes
- Short-term (1–15m): Best for quick trades.
- Mid/long-term (1h+): Best for trend tracking.
Combine both to align overall trend with precise entry/exit points.
4.5 Consider Market Context
Historical similarities may not reflect current conditions.
Always account for present market sentiment, news, and macro factors before making trading decisions.
5. Example Case
Suppose you are viewing the BTC/USDT 5-minute chart and enable the Similar Candlestick feature:
- The system analyzes the latest 40 candlesticks and finds historical segments with >90% similarity.
- The computed Rise Probability is 80%.
Based on this, you might open a short-term long position.
Suggested Exit Strategy:
- Standard exit: Close within 3–10 periods after entry (e.g., 15–50 minutes later for 5m candles).
- Take-profit / Stop-loss: Close early if price hits your profit target or stop level.
In summary, this tool is best for short-term trading (around 10 candle periods) and should be used alongside proper risk management.
6. FAQ
6.1 Why can’t I see Similar Candlestick for some pairs or timeframes?
The feature currently supports only major symbols and specific time intervals. Unsupported ones will show a blank area with a notice.
6.2 Why do results change after refreshing?
The algorithm recalculates matches based on the latest market data each time you refresh, ensuring updated and accurate similarity results.
6.3 Can I use this feature as a direct buy/sell signal?
No. The tool provides analytical reference only.
Actual market movement depends on multiple factors such as liquidity, sentiment, and macro conditions.
Always combine it with other analysis tools before making a decision.
6.4 Why can’t I find Similar Candlestick on the App?
Currently, this feature is available only on the web version.
The App version is under active development and will be released soon — please stay tuned for updates.
Disclaimer
The content provided herein is for reference and educational purposes only and does not constitute any financial, investment, trading, or legal advice, nor does it constitute an offer or solicitation to buy or sell any digital assets. Gate makes no express or implied representations or warranties regarding the accuracy, completeness, or timeliness of the information contained herein. Product features, interfaces, rules, and fee structures may be updated or adjusted at any time. Please refer to the latest announcements and the actual information displayed on the Gate platform for the most accurate details.
Digital asset investments involve significant risk, and prices may fluctuate substantially. You may lose the entire amount of your investment. Please make decisions cautiously based on your own financial situation and risk tolerance after fully understanding the associated risks. If necessary, you are advised to consult an independent professional financial or legal advisor.
For more information about potential risks, please refer to Gate's Risk Disclosure and User Agreement.
