Highlights
①. Gate's "Basic Futures Contracts" course introduces various methods of technical analysis that are commonly employed in futures trading. The aim of these courses is to help traders establish a comprehensive framework for technical analysis. Covered topics include the basics of Candlestick charts, technical patterns, moving averages, trend lines, and the application of technical indicators.
②. This article, as Course XI of the series "Master Technical Analysis", introduces candlestick pattern-V-shaped Reversal, and covers the concept of the pattern, its characteristics, technical meaning, as well as its application in trading.
1. What is V-shaped Reversal?
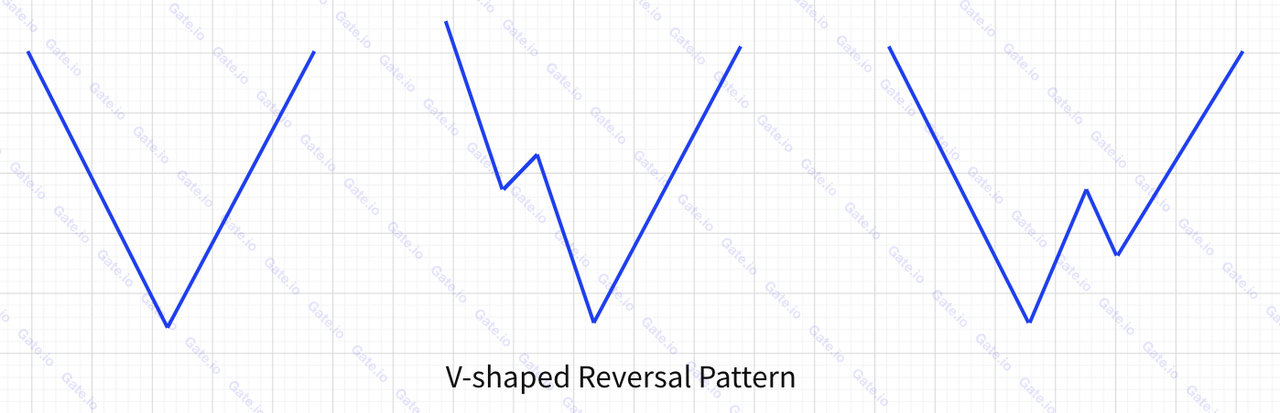
A V-shaped reversal depicts the trajectory of a price that initially declines sharply and then suddenly pivots to rise steeply, often accompanied by an uptick in trading volume. This pattern signifies a rapid market shift occurring within a short span of time. The term "V-shaped reversal" is derived from its graphic resemblance to the English letter "V."
It's worth noting that not all V-shaped reversals manifest in a standardized manner. In some instances, the price might undergo brief consolidations on either the bullish or bearish side, as illustrated below:
2. How to identify V-shaped Reversal?
①. It appears in a bearish market, and the price declines along a sharply angled slope.
②. A pronounced point forms at the bottom, indicating a market shift from bearish to bullish in a very short span of time.
③. The reversal is accompanied by a significant increase in trading volume, which persists as the price maintains its bullish trajectory.
④. Some V-shaped reversal patterns may feature brief consolidations on either their rising or declining slopes.
3. Technical meaning of v-shaped reversal
The turning point of the pattern marks that the market turns from bearish to bullish and signals a buy signal.
V-shaped reversals are generally common in the late stage of the declining trend, or when the market is encouraged by sudden positive changes.
4. Application
A V-shaped reversal indicates a buy-at-the-bottom signal. The specific timing of buying occurs when :
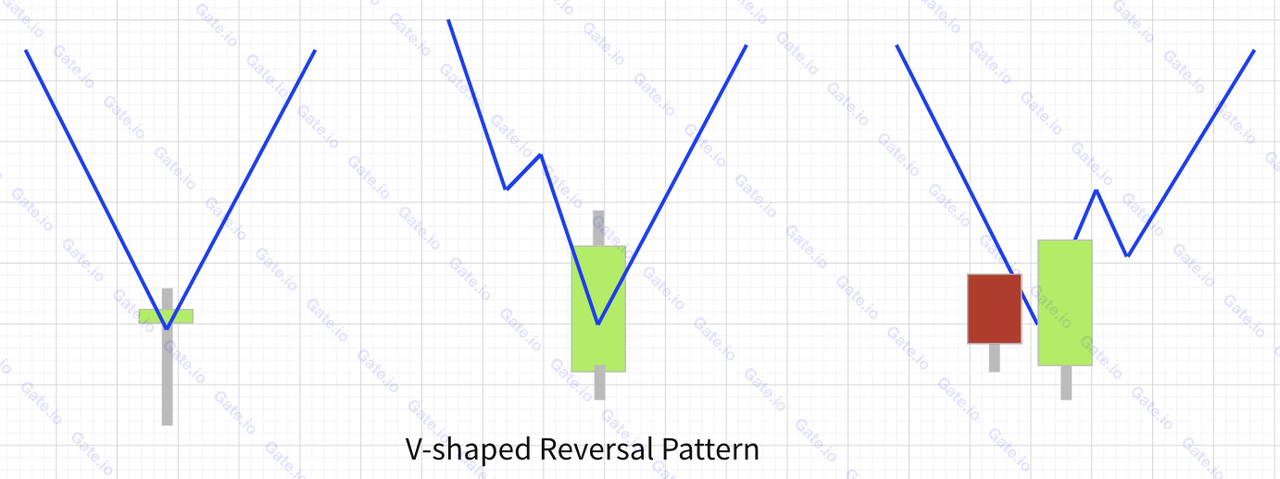
①. The time when the bearish trend reverses to go bullish provides an opportunity to buy. Traders should reconfirm the bullish signal by checking candlestick color, and other technical indicators.
5. Use Case
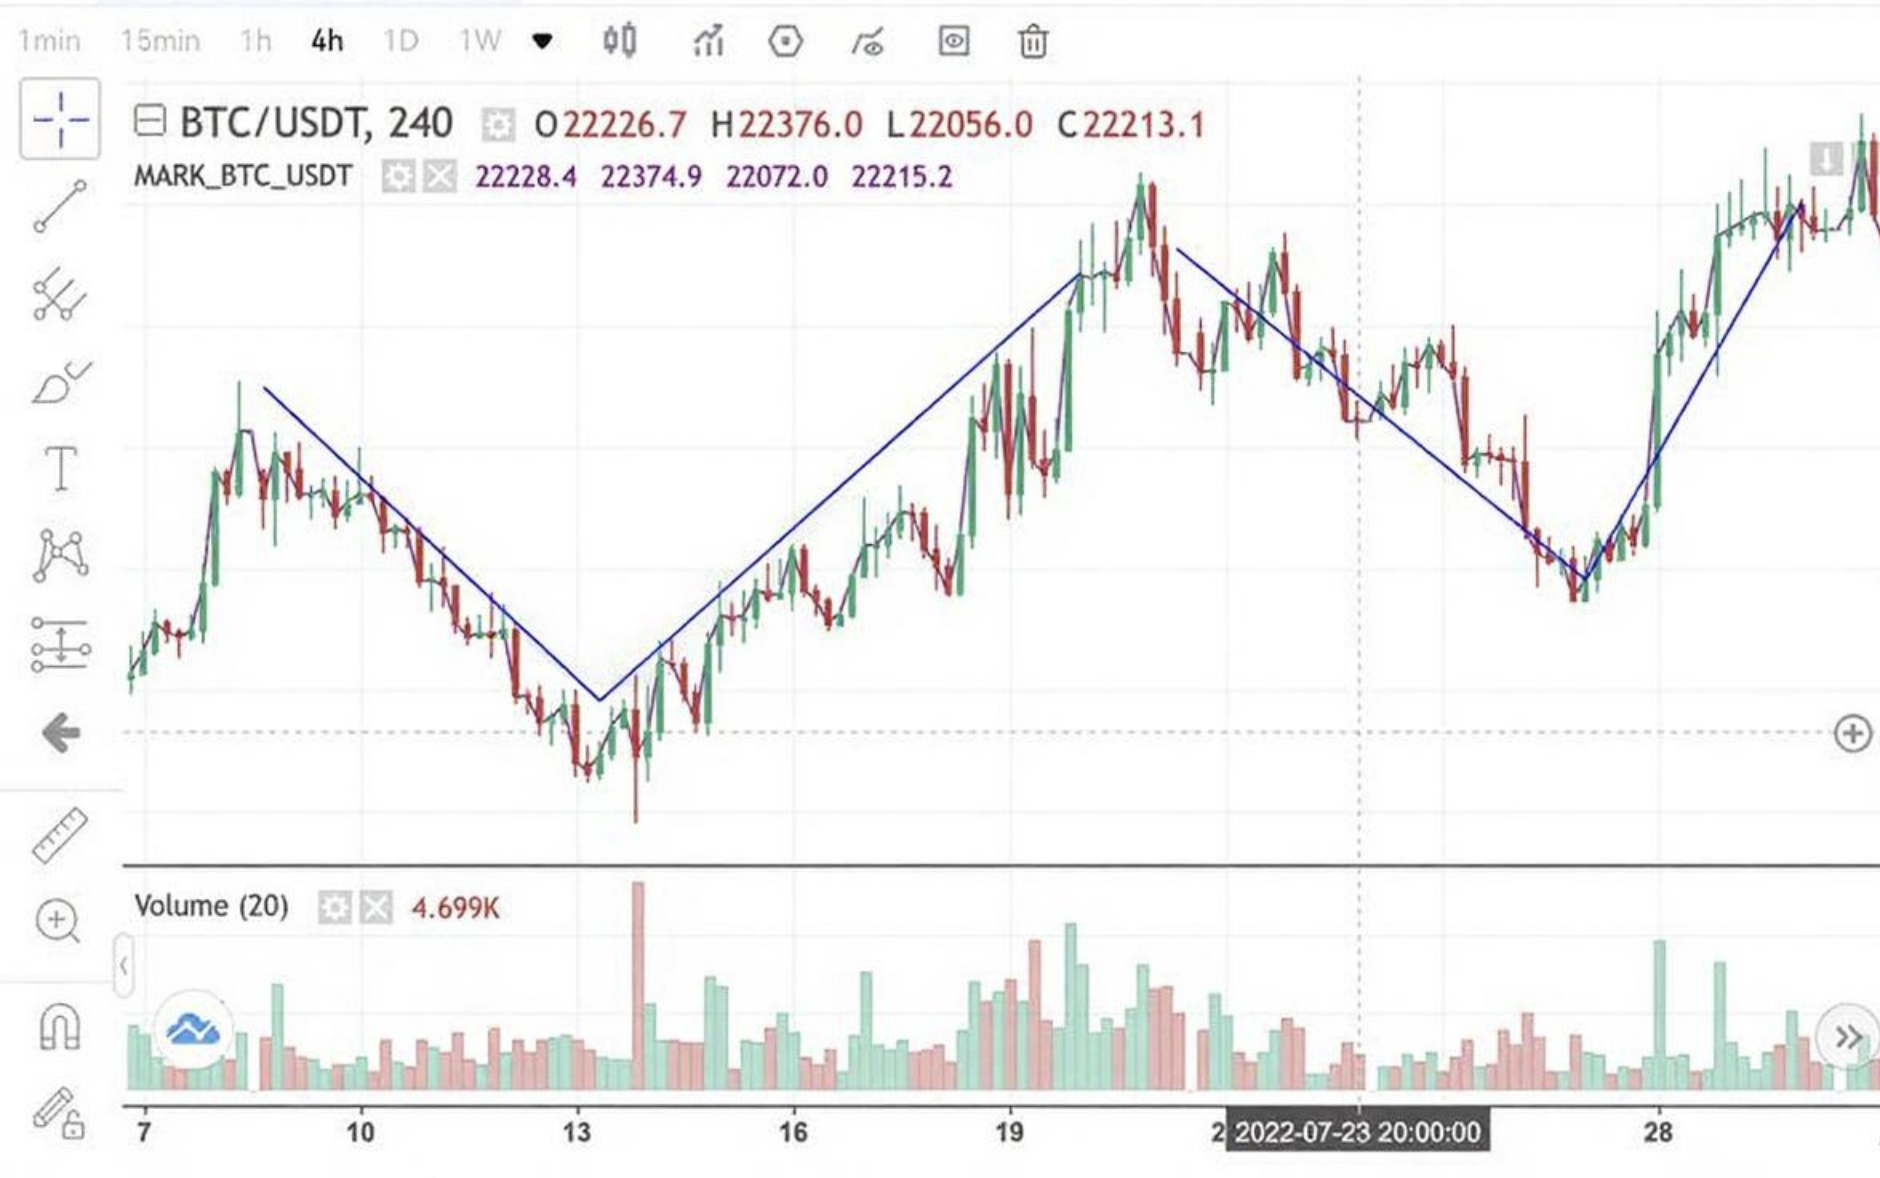
The above is the 4-hour candlestick chart of the Gate futures. It can be seen that between July 28 and July 30, BTC experienced two rounds of V-shaped reversals. According to the first V-shaped pattern, the price first fell from US$23,000 to a US$19,000 low, and then reversed to start a strong bullish run, finally hitting a US$24,000 high, up by more than 25% in total.
6. Derivative pattern
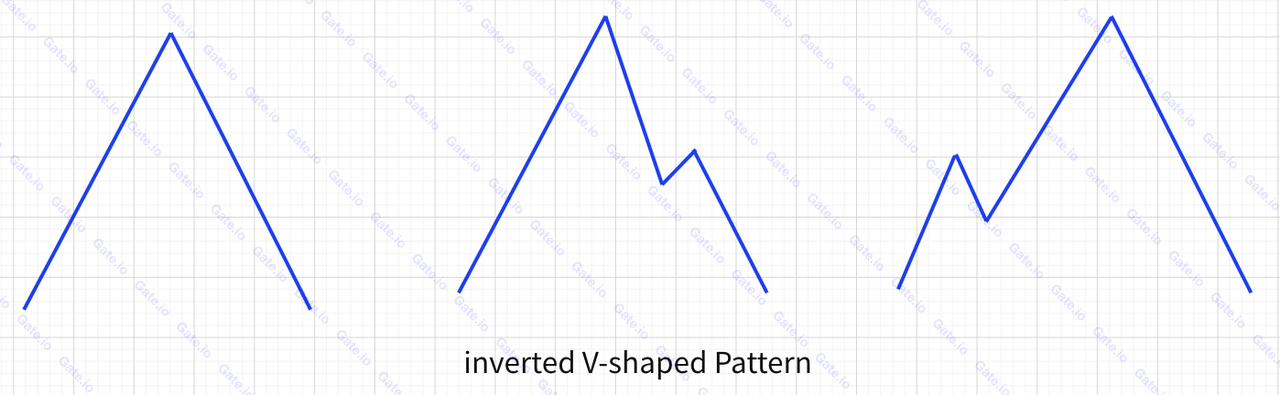
When the V-shaped reversal is flipped upside down, it becomes an inverted V-shaped pattern. This pattern carries the opposite technical significance of the V-shaped pattern, but it too can signal crucial trading indicators. Below are examples of inverted V-shaped patterns:
Summary
In real-world trading, V-shaped reversals are relatively rare, typically emerging amidst a strong bullish market. When this pattern surfaces, it usually indicates that the market's sharp decline is temporary, soon to be succeeded by a vigorous reversal propelling the market to new heights. Nevertheless, in practical trading scenarios, we recommend a flexible approach to this pattern. It's advisable to integrate other technical patterns to corroborate the bullish signal, thereby enhancing the likelihood of success.
Start trading futures by registering on Gate Futures.

Disclaimer
This article is for informational purposes only and does not constitute investment advice. Gate is not responsible for any investment decisions you make. Content related to technical analysis, market assessments, trading skills, and traders' insights should not be considered a basis for investment. Investing carries potential risks and uncertainties. This article offers no guarantees or assurances of returns on any type of investment.
Disclaimer
The content provided herein is for reference and educational purposes only and does not constitute any financial, investment, trading, or legal advice, nor does it constitute an offer or solicitation to buy or sell any digital assets. Gate makes no express or implied representations or warranties regarding the accuracy, completeness, or timeliness of the information contained herein. Product features, interfaces, rules, and fee structures may be updated or adjusted at any time. Please refer to the latest announcements and the actual information displayed on the Gate platform for the most accurate details.
Digital asset investments involve significant risk, and prices may fluctuate substantially. You may lose the entire amount of your investment. Please make decisions cautiously based on your own financial situation and risk tolerance after fully understanding the associated risks. If necessary, you are advised to consult an independent professional financial or legal advisor.
For more information about potential risks, please refer to Gate's Risk Disclosure and User Agreement.
