Highlights
①. Gate's "Basic Futures Contracts" course introduces various methods of technical analysis that are commonly employed in futures trading. The aim of these courses is to help traders establish a comprehensive framework for technical analysis. Covered topics include the basics of Candlestick charts, technical patterns, moving averages, trend lines, and the application of technical indicators.
②. This article, as Course IX of the series "Master Technical Analysis", will introduce one key candlestick pattern-Head & Shoulders Top, and will cover the concept of the pattern, its characteristics, technical meaning, as well as its application in trading.
1. What is Head & Shoulders Top?
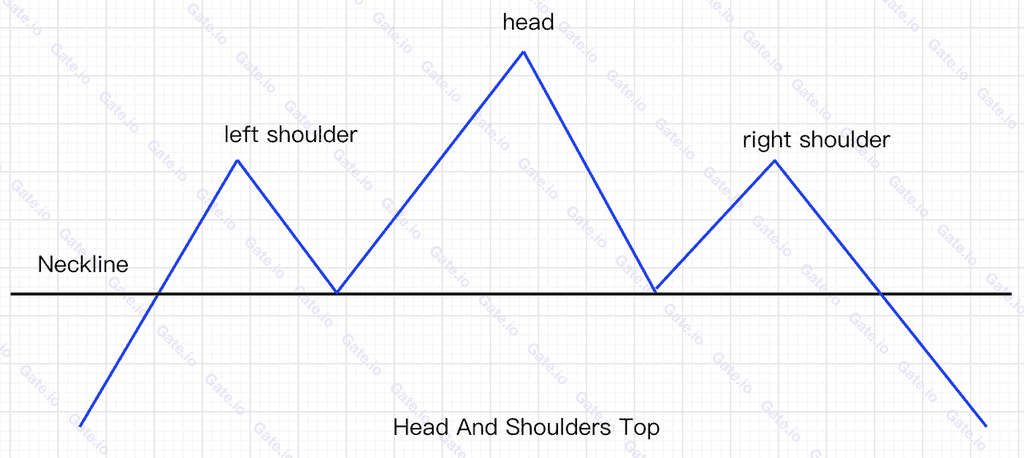
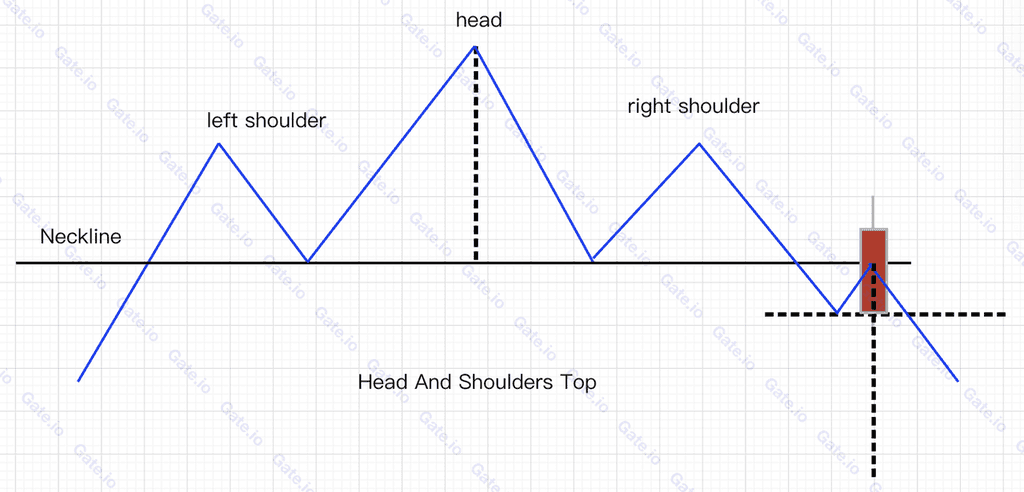
The "head & shoulders" top outlines the trajectory of a pronounced bullish wave in the market, leading the price to achieve three successive peaks. These three peaks are aligned in such a way that the central peak stands slightly taller than the two flanking it. Moving from left to right, they are termed the left shoulder, head, and right shoulder. As the price navigates past these three peaks, there's a corresponding and gradual decrease in trading volume. The pattern is illustrated below:
2. Features of Head & Shoulders Top
①. The pattern emerges within a pronounced bullish trend characterized by a notable increase in both price and trading volume.
②. It often manifests in the final stages of a market's ascent, during which the price undergoes significant fluctuations to form three distinct peaks. Notably, the left and right peaks are approximately at the same level, termed the left and right shoulders, respectively. The central peak, the tallest of the trio, is identified as the head.
③. Integral to the pattern are two troughs roughly at the same level. A horizontal line connecting these troughs is termed the neckline. The "Head & Shoulders" Top solidifies once the price descends, breaching the neckline.
④. While volume may oscillate in tandem with the price's ebb and flow, its overarching trajectory tends to decrease as the price moves from left to right, shaping the pattern.
3. Technical Meaning of Head & Shoulders Top
The "head & shoulders" top is commonly viewed as a reversal signal, suggesting an impending conclusion to a bull market or its appearance at the peak of a mid-term upward trend. When the neckline is decisively breached, it's seen as a clear bearish indicator, presenting an opportunity to sell assets.
4. Application
As previously noted, the "head & shoulders" top acts as a reversal signal, advising traders to liquidate positions in anticipation of an impending bearish trend. Upon pattern confirmation, traders can leverage the following three selling opportunities to enhance their gains:
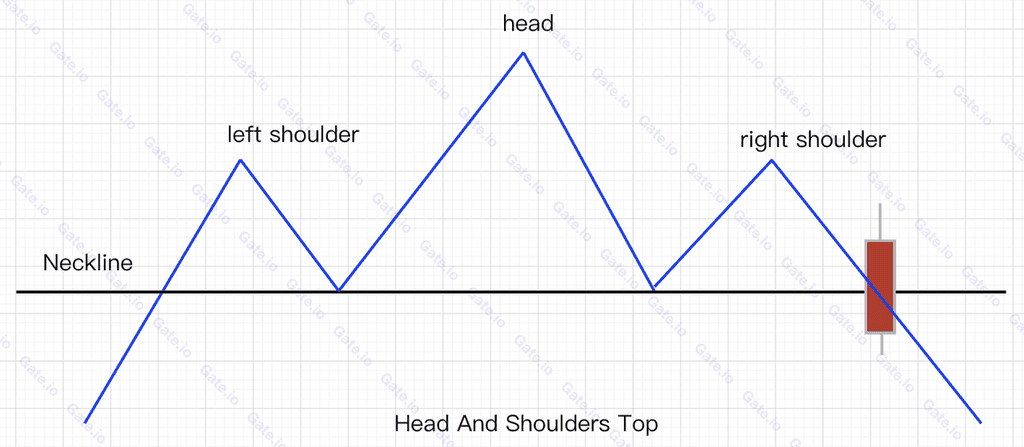
①. First Selling Opportunity: This arises post the formation of the "head & shoulders" top. The initial selling trigger is when the price breaks and falls below the neckline, marked by the close of a red candlestick on that day. Such a neckline breach alerts traders to a probable market trend reversal, with a subsequent bearish phase likely on the horizon. The illustration below pinpoints this first selling juncture:
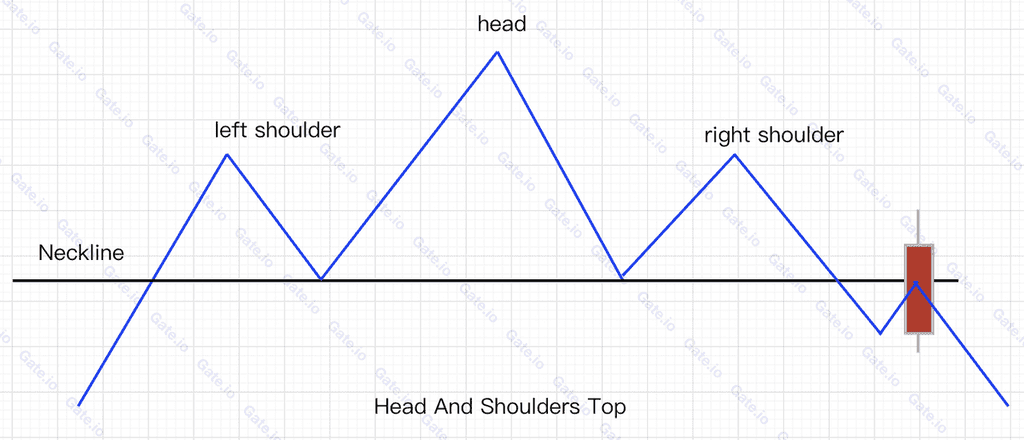
②. Second Selling Opportunity: Following the neckline breach, the price frequently experiences a brief bullish resurgence. If, during this ascent, it reverses and starts to decline before reaching the neckline again, it presents traders with another exit opportunity. This downturn underscores robust bearish momentum and is thus regarded as a dependable indicator of a looming bearish market phase. The illustration below highlights this second selling juncture:
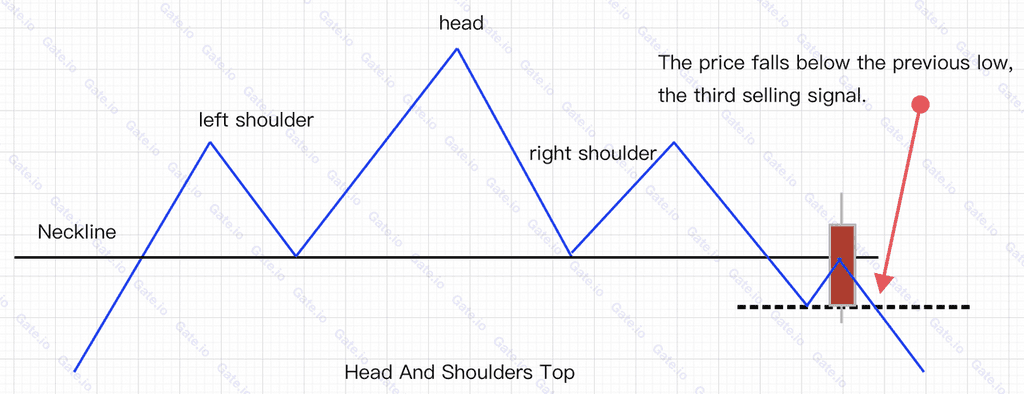
③. Third Selling Opportunity: Once the price descends below the neckline, it typically continues on a downward trajectory for a period before attempting a rally. Should it reverse direction again without touching the neckline, the third selling opportunity emerges when the price drops to surpass its previous low. The illustration below delineates this third selling point:
Here's a streamlined recap of the "head & shoulders" top's characteristics and its practical application:
To begin, it's crucial to identify the three key peaks of the pattern: the left shoulder, the head, and the right shoulder. Next, establish the position of the neckline, a critical demarcation between buy and sell zones in the market.
The price's relative positioning in relation to the pattern can guide us to three principal selling junctures:
A. First Selling Opportunity: When the price drops below the neckline.
B. Second Selling Opportunity: After a rebound, if the price turns downward again before reaching the neckline.
C. Third Selling Opportunity: After another rally, if the price descends once more before touching the neckline, and continues to plummet beyond the preceding low.
The pattern serves a dual purpose: not only does it assist in predicting a bearish trend, but it also provides insights into the potential depth of the market's decline. Once the price dips below the neckline, begin by drawing a vertical line from the head down to the neckline. Subtracting the height of this line from the neckline value offers the most conservative estimate of the market's potential drop.
5. Application
①. Case study
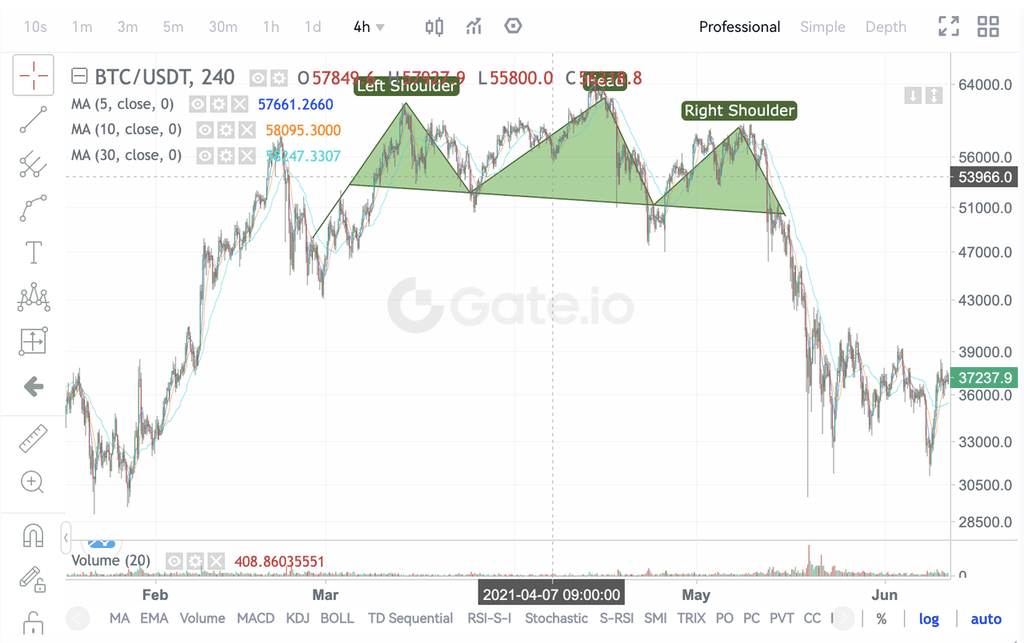
The described pattern corresponds to the 4H candlestick for BTC. Observing its behavior from the end of 2020 through May 2021, BTC underwent a robust bullish wave, soaring from US$10,000 to an impressive US$64,000—an increase of over 600%. However, as the bullish momentum started to wane, the price began oscillating at this peak, eventually shaping into a head-and-shoulders top pattern. Subsequently, a pronounced bearish trend set in, pulling the price beneath the neckline to register a low of $47,000, ushering in a year-long market downturn.
②. Invalid head & shoulders top
Head & shoulders top will be an invalid one if :
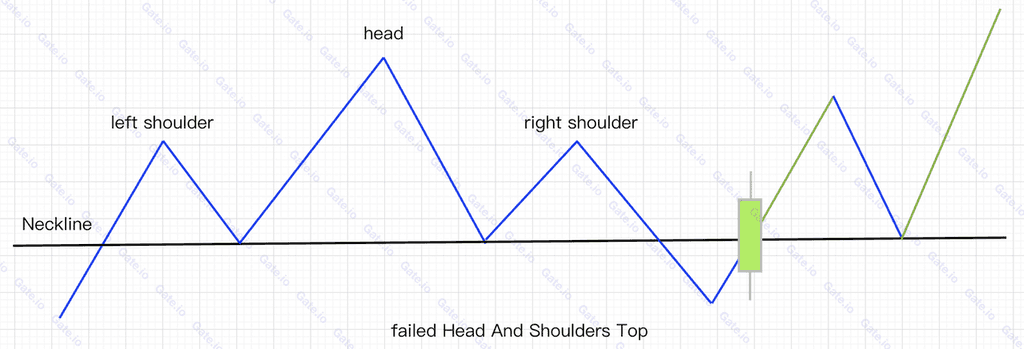
After the price falls below the neckline, it gains strong upward momentum to rise quickly to surpass the neckline again with a green candlestick that day. In such a case, the bullish trend may still continue, so no rush trading actions should be taken.
6. Summary
The "head & shoulders" top serves as a trend reversal signal, whether manifesting at the pinnacle of a long-term trend or atop an intermediate-term trajectory. The breach of the neckline typically signifies a robust indicator of an impending bearish trend and is often viewed as a prime selling opportunity. Even if the optimal selling point is missed, one can still secure a portion of the profit by heeding the cues from the "head & shoulders" top and acting promptly. Remember, any decline observed before the pattern's formation is often just a precursor to more significant downturns to follow.
Start trading futures by registering on Gate Futures.

Disclaimer
This article is for informational purposes only and does not constitute investment advice. Gate is not responsible for any investment decisions you make. Content related to technical analysis, market assessments, trading skills, and traders' insights should not be considered a basis for investment. Investing carries potential risks and uncertainties. This article offers no guarantees or assurances of returns on any type of investment.
Disclaimer
The content provided herein is for reference and educational purposes only and does not constitute any financial, investment, trading, or legal advice, nor does it constitute an offer or solicitation to buy or sell any digital assets. Gate makes no express or implied representations or warranties regarding the accuracy, completeness, or timeliness of the information contained herein. Product features, interfaces, rules, and fee structures may be updated or adjusted at any time. Please refer to the latest announcements and the actual information displayed on the Gate platform for the most accurate details.
Digital asset investments involve significant risk, and prices may fluctuate substantially. You may lose the entire amount of your investment. Please make decisions cautiously based on your own financial situation and risk tolerance after fully understanding the associated risks. If necessary, you are advised to consult an independent professional financial or legal advisor.
For more information about potential risks, please refer to Gate's Risk Disclosure and User Agreement.
