INVESTERCLUB
RIZE 以征服
INVESTERCLUB
$ETH #Gate13thAnniversaryLive
ETH/USDT,这是一份完整的深度K线技术分析。
1. 趋势与市场结构
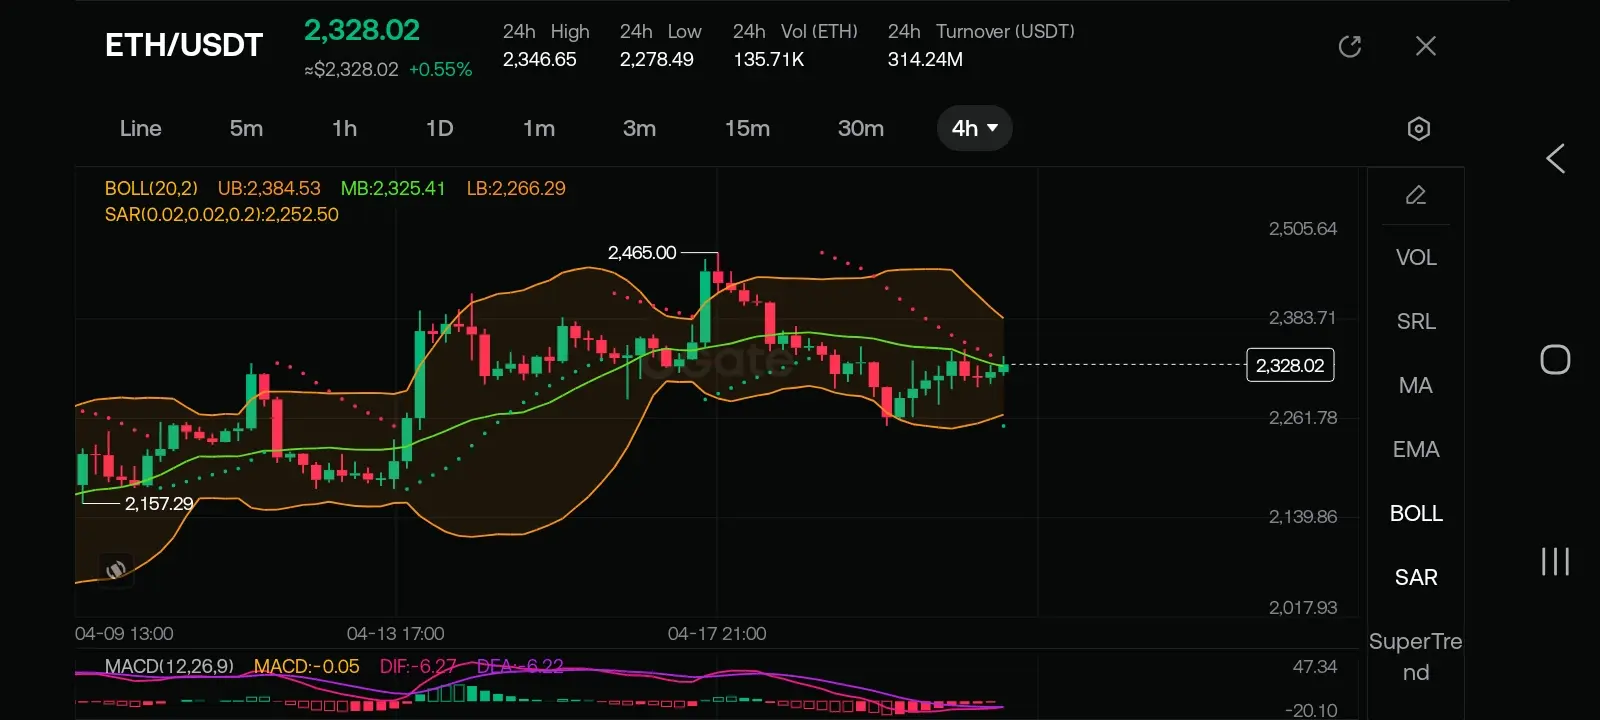
· 当前价格:约2,328 USDT
· 整体趋势:短期内中性偏温和看涨,但仍在较大盘整区间内交易。
· 关键观察:价格在下跌至2,278.49 (24小时低点)后已稳定在2,300支撑区上方。然而,尚未 decisively 打破2,346–2,352的阻力区域。
2. 布林带 (20,2)
图表 UB (上轨) MB (中轨) LB (下轨) 含义
第一组 2,384.53 2,325.41 2,266.29 价格接近中轨;带宽宽 → 潜在波动
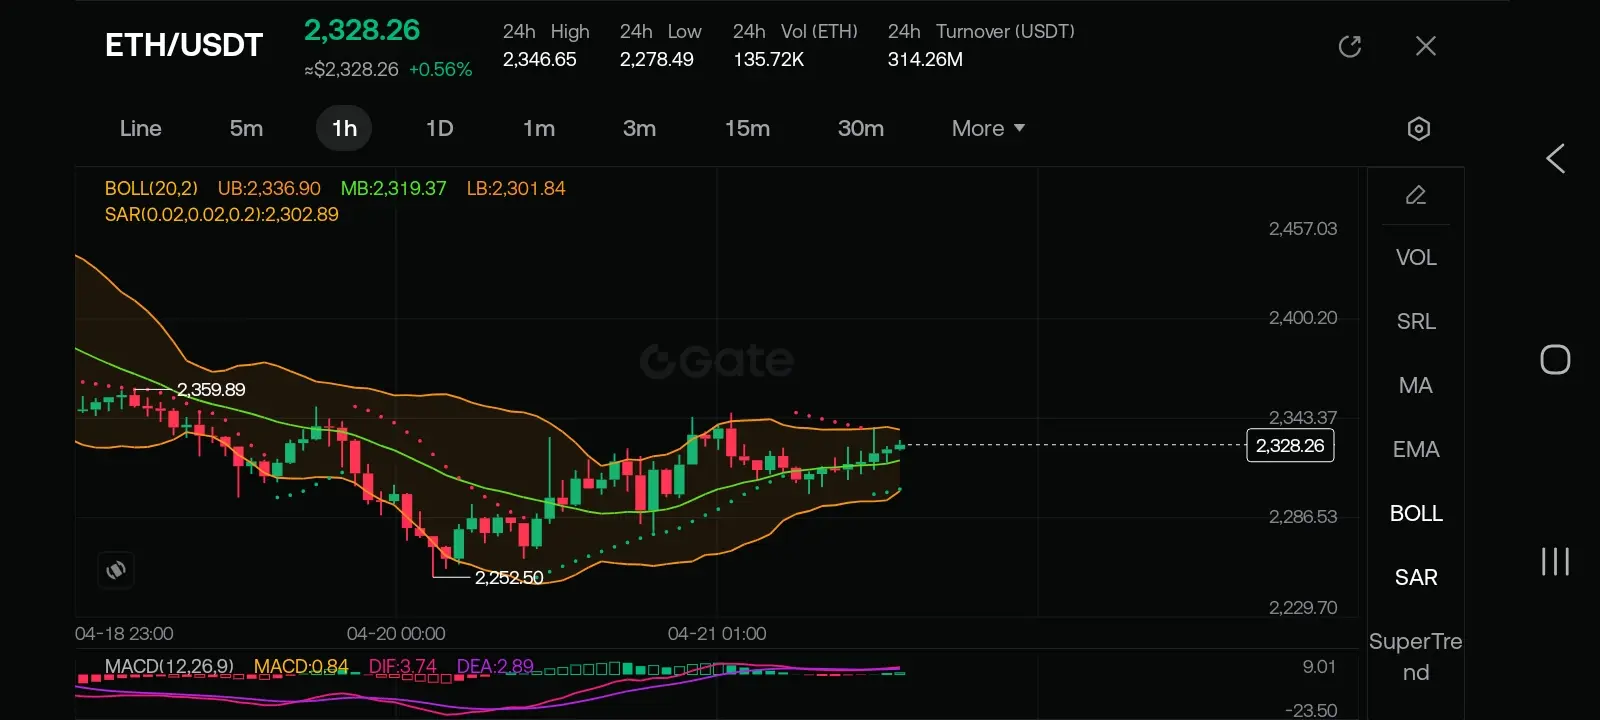
第二组 2,336.90 2,319.37 2,301.84 价格在中轨上方 → 温和看涨
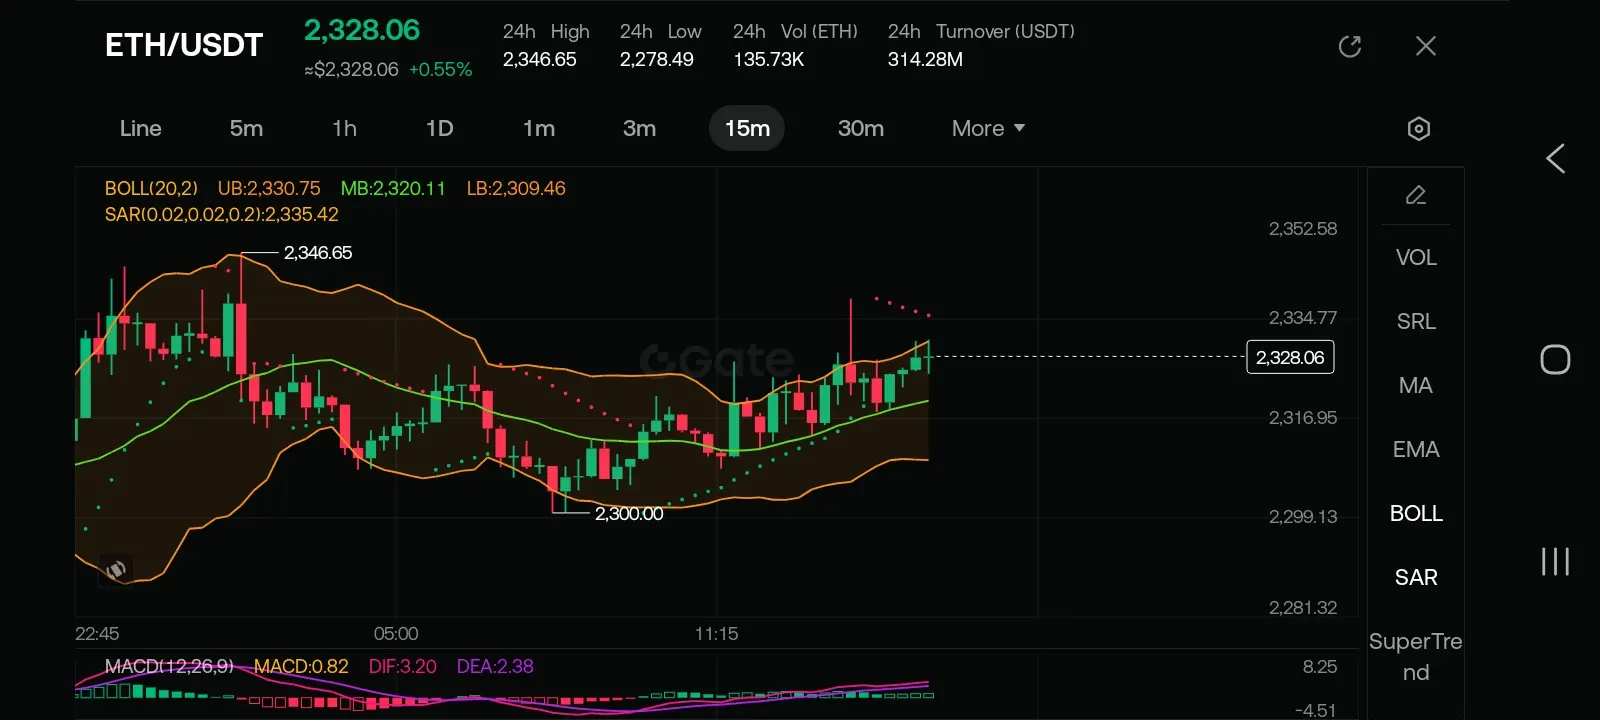
第三组 2,330.75 2,320.11 2,309.46 紧缩收敛 → 突破即将到来
结论:布林带正处于收缩状态 (尤其是在第三张图)。这表明波动性较低,突破可能即将发生。
3. SAR (抛物线转向指标,0.02/0.02/0.2)
· 图表1 SAR:2,252.50 (在价格下方→上升趋势)
· 图表2 SAR:2,302.89 (在价格下方→上升趋势)
· 图表3 SAR:2,335.42 (在价格上方→潜在下跌警示)
⚠️ 矛盾:最新数据 (第三张图)显示SAR从下方翻转到上方,发出看空警告——暗示
ETH/USDT,这是一份完整的深度K线技术分析。
1. 趋势与市场结构
· 当前价格:约2,328 USDT
· 整体趋势:短期内中性偏温和看涨,但仍在较大盘整区间内交易。
· 关键观察:价格在下跌至2,278.49 (24小时低点)后已稳定在2,300支撑区上方。然而,尚未 decisively 打破2,346–2,352的阻力区域。
2. 布林带 (20,2)
图表 UB (上轨) MB (中轨) LB (下轨) 含义
第一组 2,384.53 2,325.41 2,266.29 价格接近中轨;带宽宽 → 潜在波动
第二组 2,336.90 2,319.37 2,301.84 价格在中轨上方 → 温和看涨
第三组 2,330.75 2,320.11 2,309.46 紧缩收敛 → 突破即将到来
结论:布林带正处于收缩状态 (尤其是在第三张图)。这表明波动性较低,突破可能即将发生。
3. SAR (抛物线转向指标,0.02/0.02/0.2)
· 图表1 SAR:2,252.50 (在价格下方→上升趋势)
· 图表2 SAR:2,302.89 (在价格下方→上升趋势)
· 图表3 SAR:2,335.42 (在价格上方→潜在下跌警示)
⚠️ 矛盾:最新数据 (第三张图)显示SAR从下方翻转到上方,发出看空警告——暗示
ETH3.07%
- 赞赏
- 4
- 4
- 转发
- 分享
Falcon_Official:
确实查看更多
#CryptoMarketsDipSlightly $ADA
这里是深入的技术分析。
1. 概览与市场背景
· 当前价格:约0.2462 (当天下跌0.44%)。
· 趋势 (多时间框架):数据显示在较长周期内表现出明显疲软 (-60.72% 180天内,-60.01% 1年内)。30天变化也为负 (-6.81%),表明尽管短期盘整,整体仍偏空。
· 交易量与换手:24小时ADA交易量为1.1136亿,USDT换手为2731万——相对适中,暗示此水平没有重大机构资金流入。
2. 布林带 (BOLL 20,2)
· 上轨 (UB): 0.2628
· 中轨 (MB / MA): 0.2510
· 下轨 (LB): 0.2392
· 当前价格位置:0.2462低于中轨 (0.2510),但高于下轨。
· 解读:
· 价格位于布林带下半区,偏空倾向。
· 布林带宽度既不极端宽 (高波动性),也不极端窄 (低波动性)。
· 若价格能持续上破0.2510 (MB),则短期动能可能转为中性偏多。
· 若价格跌破0.2392 (LB),可能加速向下,接近近期低点 (~0.2375,图表上可见)。
3. SAR (抛物线转向指标:0.02, 0.02, 0.2)
· SAR值:0.2410
· 当前价格与SAR:价格 (0.2462)高于SAR点。
· 解读:
· 抛物线SA
ADA2.12%
- 赞赏
- 3
- 2
- 转发
- 分享
Falcon_Official:
密切关注查看更多
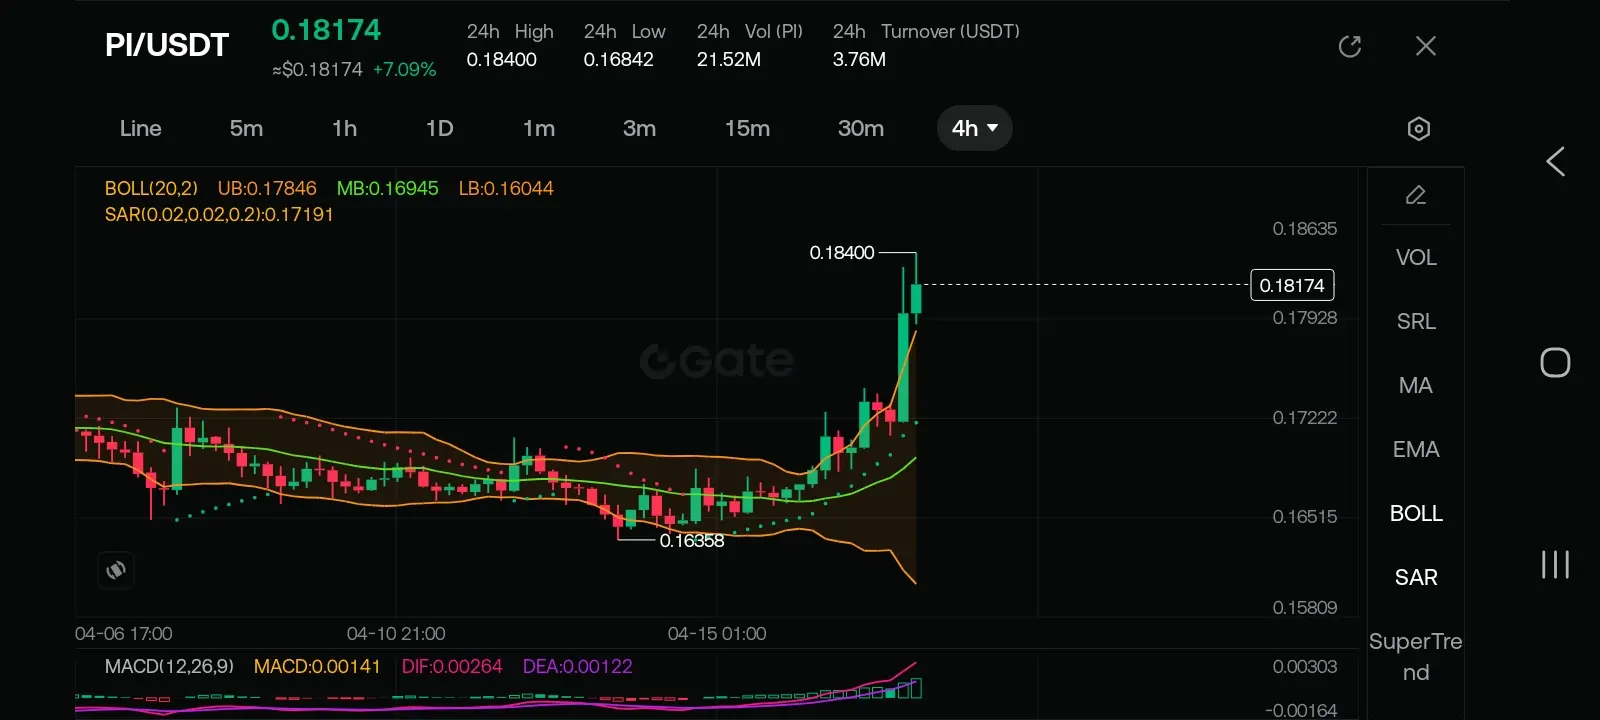
#AltcoinsRallyStrong $PI
这里是完整的深度K线(蜡烛图)分析。
1. 整体市场结构与趋势
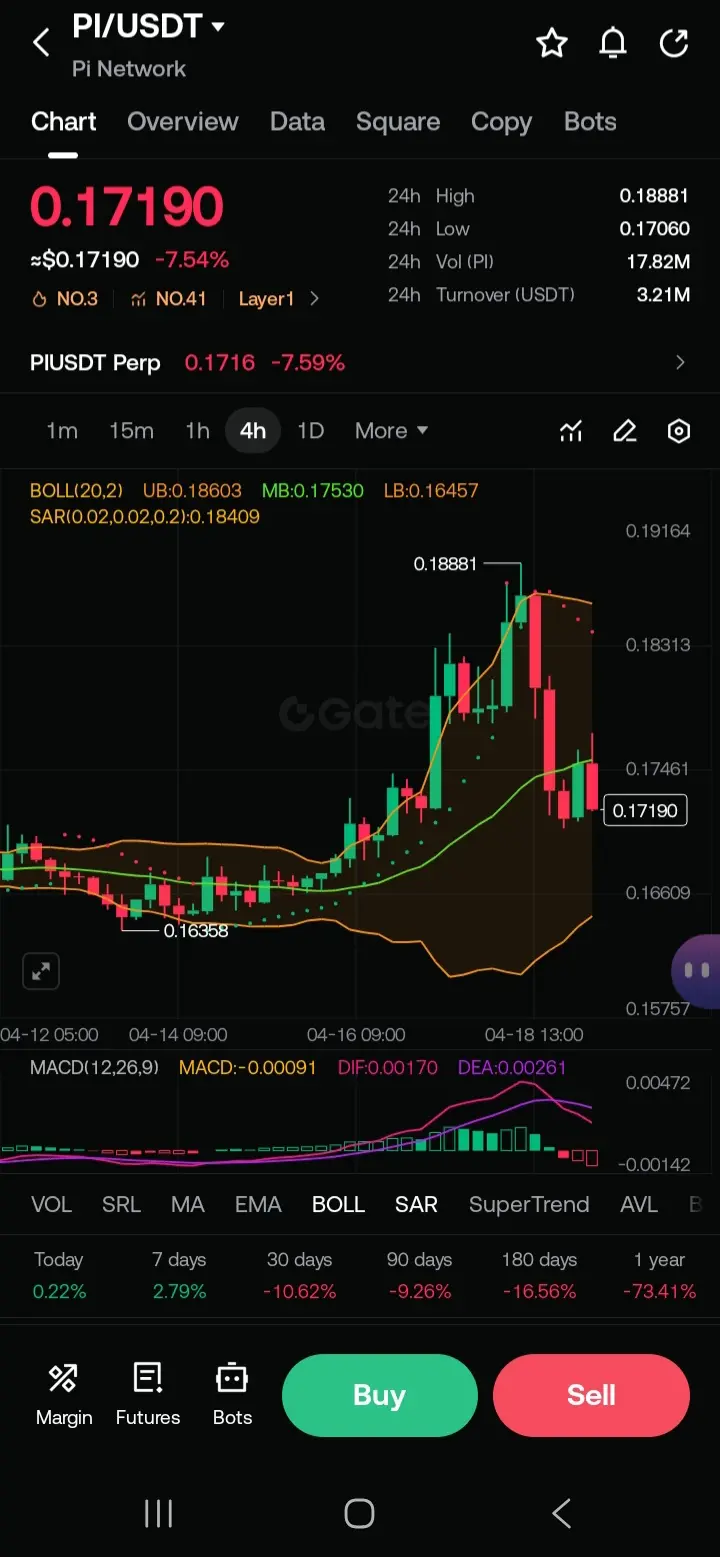
· 主要趋势(长期): 看空。1年表现为-73.41%,180天回报为-16.56%。价格明显低于一年前的高位。
· 次要趋势(中期): 看空。30天回报为-10.62%,显示过去一个月持续卖压。
· 短期趋势:看空,但接近潜在支撑位。当前价格为0.17190,日内下跌-7.54%,并且低于布林带中轨(MB: 0.17530)。
2. 关键技术指标分析
指标 数值 解释
布林带(20,2) 上轨:0.18603 中轨:0.17530 下轨:0.16457 价格位于中轨以下(看空)。下轨0.16457为直接关键支撑。带宽不极端,暗示尚未出现恐慌性抛售,但持续的下行压力存在。
SAR(抛物线) 0.18409 价格在SAR点以下交易。这是经典的卖出信号,确认下行趋势。
MACD(12,26,9) DIF:0.00170 DEA:0.00261 MACD:-0.00091 DIF低于DEA(空头交叉发生)。MACD柱状图为负(-0.00091),确认空头动能,尽管数值较小,表明动能尚不极强。
成交量(24小时PI) 1782万 中等成交量。-7.54%的跌幅伴随此成交量,表明卖压活跃但尚未出现大规模抛售。
3. 价格行为与关键水平
· 当前价格:0.1719
这里是完整的深度K线(蜡烛图)分析。
1. 整体市场结构与趋势
· 主要趋势(长期): 看空。1年表现为-73.41%,180天回报为-16.56%。价格明显低于一年前的高位。
· 次要趋势(中期): 看空。30天回报为-10.62%,显示过去一个月持续卖压。
· 短期趋势:看空,但接近潜在支撑位。当前价格为0.17190,日内下跌-7.54%,并且低于布林带中轨(MB: 0.17530)。
2. 关键技术指标分析
指标 数值 解释
布林带(20,2) 上轨:0.18603 中轨:0.17530 下轨:0.16457 价格位于中轨以下(看空)。下轨0.16457为直接关键支撑。带宽不极端,暗示尚未出现恐慌性抛售,但持续的下行压力存在。
SAR(抛物线) 0.18409 价格在SAR点以下交易。这是经典的卖出信号,确认下行趋势。
MACD(12,26,9) DIF:0.00170 DEA:0.00261 MACD:-0.00091 DIF低于DEA(空头交叉发生)。MACD柱状图为负(-0.00091),确认空头动能,尽管数值较小,表明动能尚不极强。
成交量(24小时PI) 1782万 中等成交量。-7.54%的跌幅伴随此成交量,表明卖压活跃但尚未出现大规模抛售。
3. 价格行为与关键水平
· 当前价格:0.1719
PI0.09%

- 赞赏
- 6
- 3
- 转发
- 分享
Falcon_Official:
到月球 🌕查看更多
#AltcoinsRallyStrong
🧠 交易者真正的“隐形杀手”是什么?不是市场。是这个。👇
你在追逐每一个已知的指标。
跟随47位加密货币影响者。
像跳TikTok舞一样跳来跳去,从一种策略跳到另一种策略。💃
熟悉吗?
那就仔细听 👂
大多数交易者失败不是因为他们笨。
他们失败是因为把交易变成了一个科学实验。🧪
与此同时,专业人士?
他们一边喝咖啡 ☕,一边看干净的图表,微笑着。
不是因为他们知道得少…
而是因为他们专注于真正有效的东西。
🎯 真正的优势 = 清晰。纪律。执行力。不是更多的工具。
① 简单 = 超人决策能力 🦸♂️
图表看起来像一碗意大利面? 🍝
RSI显示一件事。MACD显示另一件事。Twitter上的随机人说“即将涨天” 🌙
结果? 🧠💥 瘫痪。
现在想象一下:
➡️ 干净的价格行为
➡️ 关键支撑/阻力
➡️ 一个确认工具
轰。快速。清晰。自信。✅
噪音少 = 执行更好。每一次。
② 过度复杂化 = 情绪灾难 😭
复杂的设置会导致:
❌ 混乱
❌ 迟到的入场
❌ 猜测反复
这会导致:
📈 FOMO买入
🏃♂️ 迟到的退出
🔥 复仇交易
简单的系统?它们建立信任。
你知道你的计划。价格波动?谁在乎。你保持冷静。😌
简单即纪律。纪律即资本保护。🛡️
③ 顶级交易者很无聊…但很富有 💰
他们不交易所有波动的东西。
他
查看原文🧠 交易者真正的“隐形杀手”是什么?不是市场。是这个。👇
你在追逐每一个已知的指标。
跟随47位加密货币影响者。
像跳TikTok舞一样跳来跳去,从一种策略跳到另一种策略。💃
熟悉吗?
那就仔细听 👂
大多数交易者失败不是因为他们笨。
他们失败是因为把交易变成了一个科学实验。🧪
与此同时,专业人士?
他们一边喝咖啡 ☕,一边看干净的图表,微笑着。
不是因为他们知道得少…
而是因为他们专注于真正有效的东西。
🎯 真正的优势 = 清晰。纪律。执行力。不是更多的工具。
① 简单 = 超人决策能力 🦸♂️
图表看起来像一碗意大利面? 🍝
RSI显示一件事。MACD显示另一件事。Twitter上的随机人说“即将涨天” 🌙
结果? 🧠💥 瘫痪。
现在想象一下:
➡️ 干净的价格行为
➡️ 关键支撑/阻力
➡️ 一个确认工具
轰。快速。清晰。自信。✅
噪音少 = 执行更好。每一次。
② 过度复杂化 = 情绪灾难 😭
复杂的设置会导致:
❌ 混乱
❌ 迟到的入场
❌ 猜测反复
这会导致:
📈 FOMO买入
🏃♂️ 迟到的退出
🔥 复仇交易
简单的系统?它们建立信任。
你知道你的计划。价格波动?谁在乎。你保持冷静。😌
简单即纪律。纪律即资本保护。🛡️
③ 顶级交易者很无聊…但很富有 💰
他们不交易所有波动的东西。
他

- 赞赏
- 2
- 评论
- 转发
- 分享
$DOGE #Gate13thAnniversaryLive
基于多时间框架的DOGE/USDT,以下是结构化的市场情景分析和$500 交易计划。
1. 市场情景分析
蜡烛图形态与市场情绪
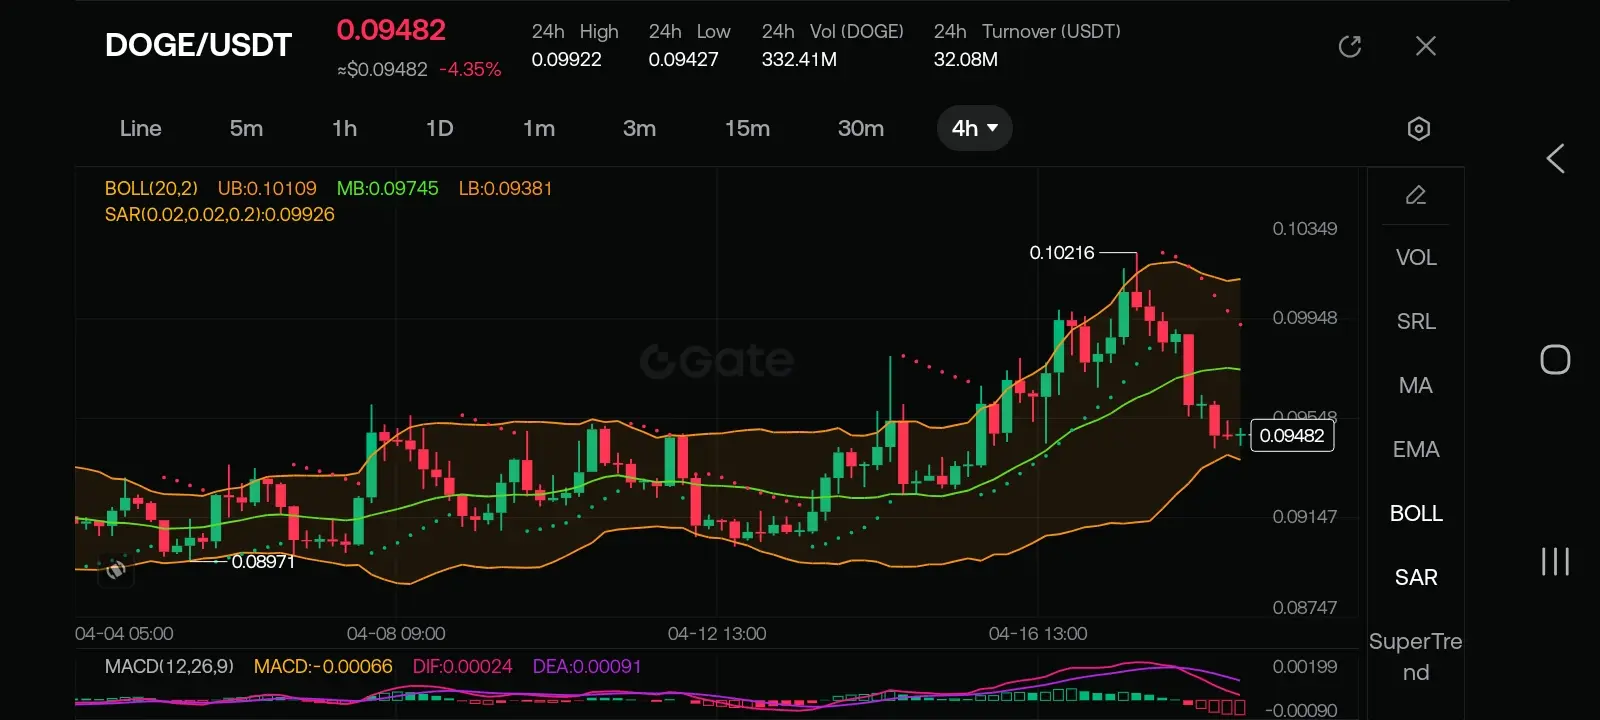
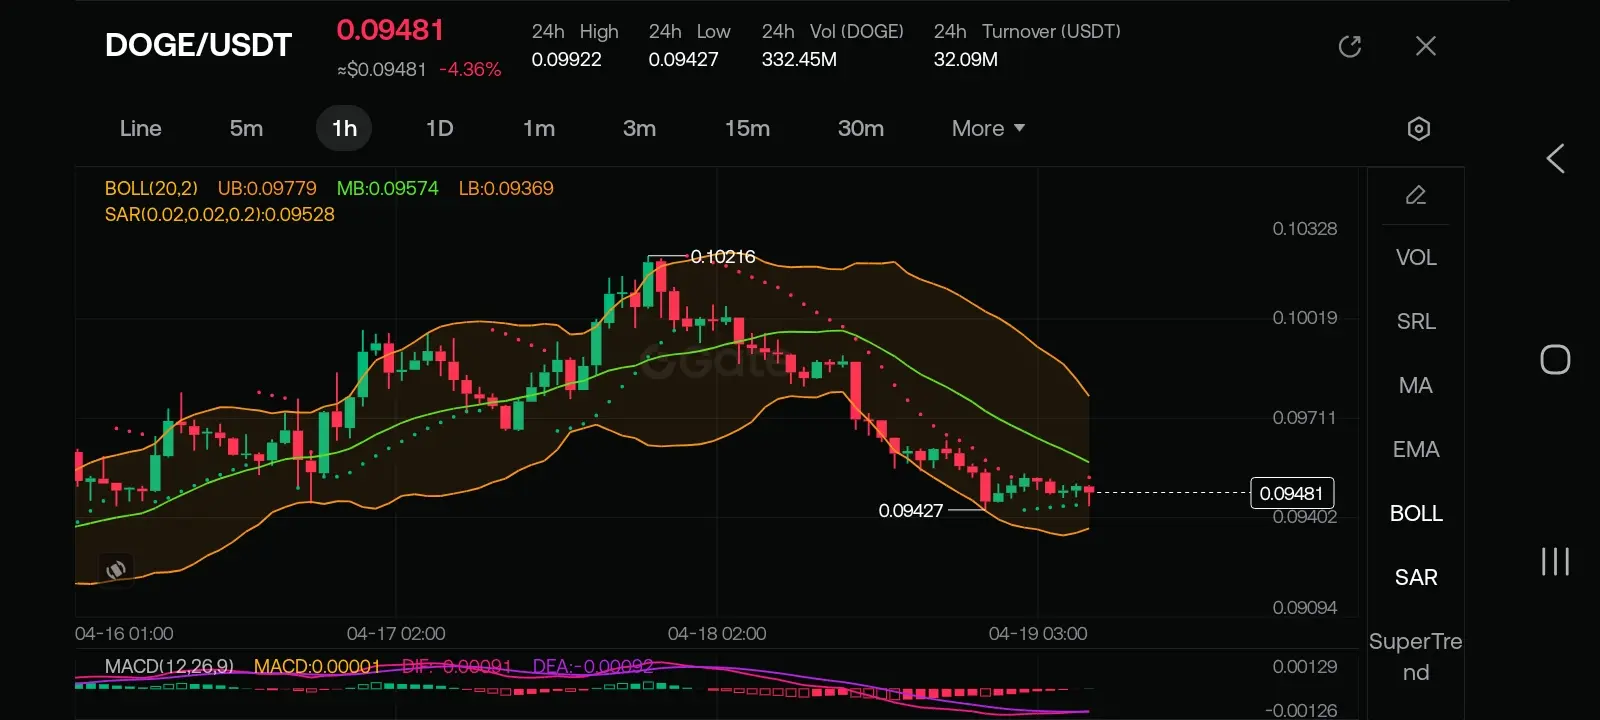
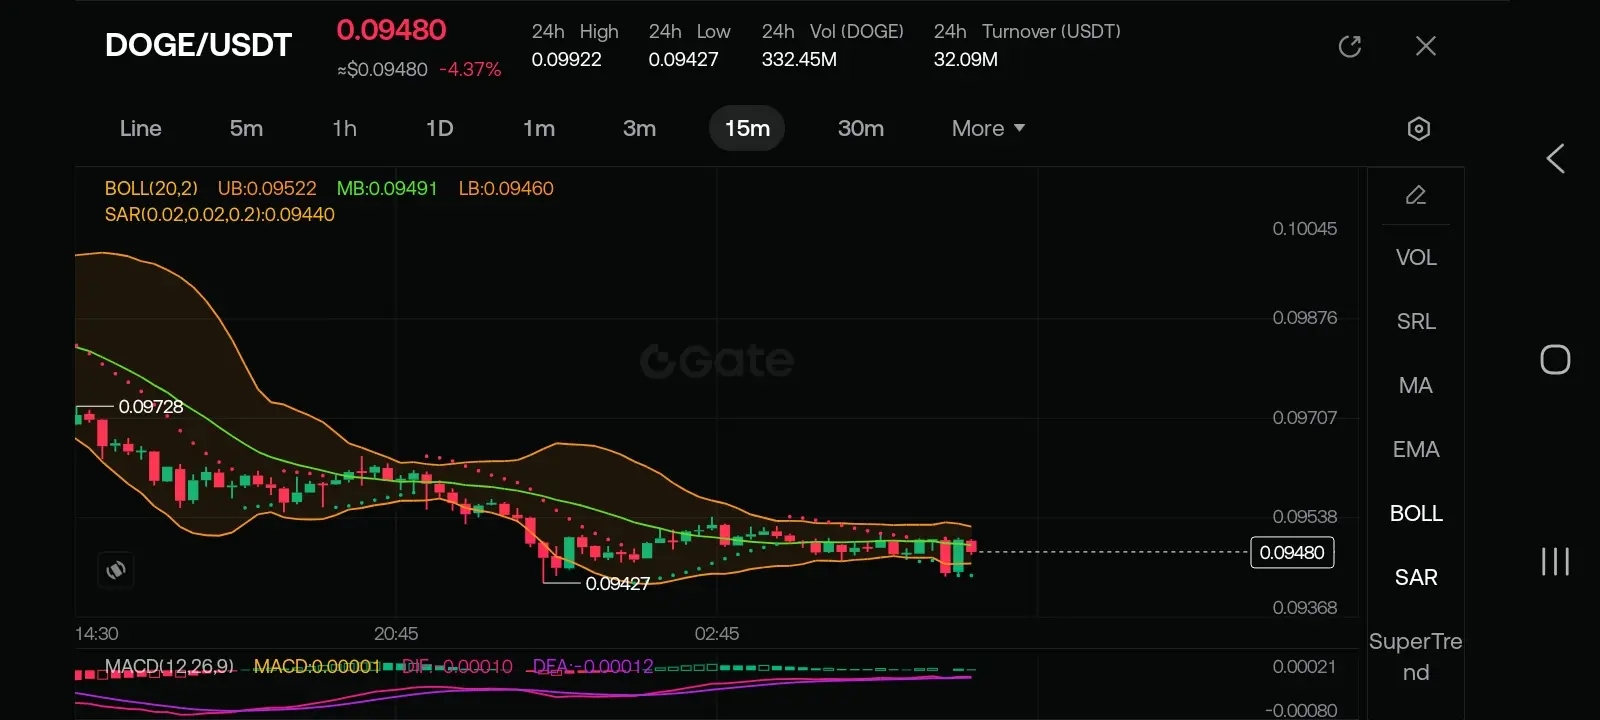
· 趋势:短期看空。价格从约0.09922下跌至约0.09480 (–4.37%)。
· 情绪:恐惧/分配。15分钟至1小时图上形成更低的高点和更低的低点。
· 交易量:3.32亿DOGE,属于中等水平,还未恐慌,但卖方占据控制。
市场结构
· 结构破碎——价格跌破之前的盘整区 (0.097–0.099)。
· 当前阶段:在上轨布林带反弹后,继续下行趋势。
支撑与阻力区域
区域 级别 (USDT) 强度
主要阻力 0.0990 – 0.1011 强 (UB, SAR)
即时阻力 0.0952 – 0.0957 中等 (BOLL MB, SAR)
当前价格 ~0.09480 –
即时支撑 0.09427 (24小时低点) 弱
主要支撑区 0.0936 – 0.0938 强 (BOLL LB, 历史)
供需区域
· 供应区:0.0975 – 0.0995 (多次拒绝)
· 需求区:0.0936 – 0.0943 (买家曾介入的区域)
买卖力量对比
· 卖方占优——MACD为负/中性,DIF低于DEA。
· 买方缺席——尚未形成更高低点。
· SuperTrend显示卖出信号 (0.00199 →
基于多时间框架的DOGE/USDT,以下是结构化的市场情景分析和$500 交易计划。
1. 市场情景分析
蜡烛图形态与市场情绪
· 趋势:短期看空。价格从约0.09922下跌至约0.09480 (–4.37%)。
· 情绪:恐惧/分配。15分钟至1小时图上形成更低的高点和更低的低点。
· 交易量:3.32亿DOGE,属于中等水平,还未恐慌,但卖方占据控制。
市场结构
· 结构破碎——价格跌破之前的盘整区 (0.097–0.099)。
· 当前阶段:在上轨布林带反弹后,继续下行趋势。
支撑与阻力区域
区域 级别 (USDT) 强度
主要阻力 0.0990 – 0.1011 强 (UB, SAR)
即时阻力 0.0952 – 0.0957 中等 (BOLL MB, SAR)
当前价格 ~0.09480 –
即时支撑 0.09427 (24小时低点) 弱
主要支撑区 0.0936 – 0.0938 强 (BOLL LB, 历史)
供需区域
· 供应区:0.0975 – 0.0995 (多次拒绝)
· 需求区:0.0936 – 0.0943 (买家曾介入的区域)
买卖力量对比
· 卖方占优——MACD为负/中性,DIF低于DEA。
· 买方缺席——尚未形成更高低点。
· SuperTrend显示卖出信号 (0.00199 →
DOGE2.21%
- 赞赏
- 2
- 评论
- 转发
- 分享
$SOL #Gate13thAnniversaryLive
📖 “暴涨前的平静”
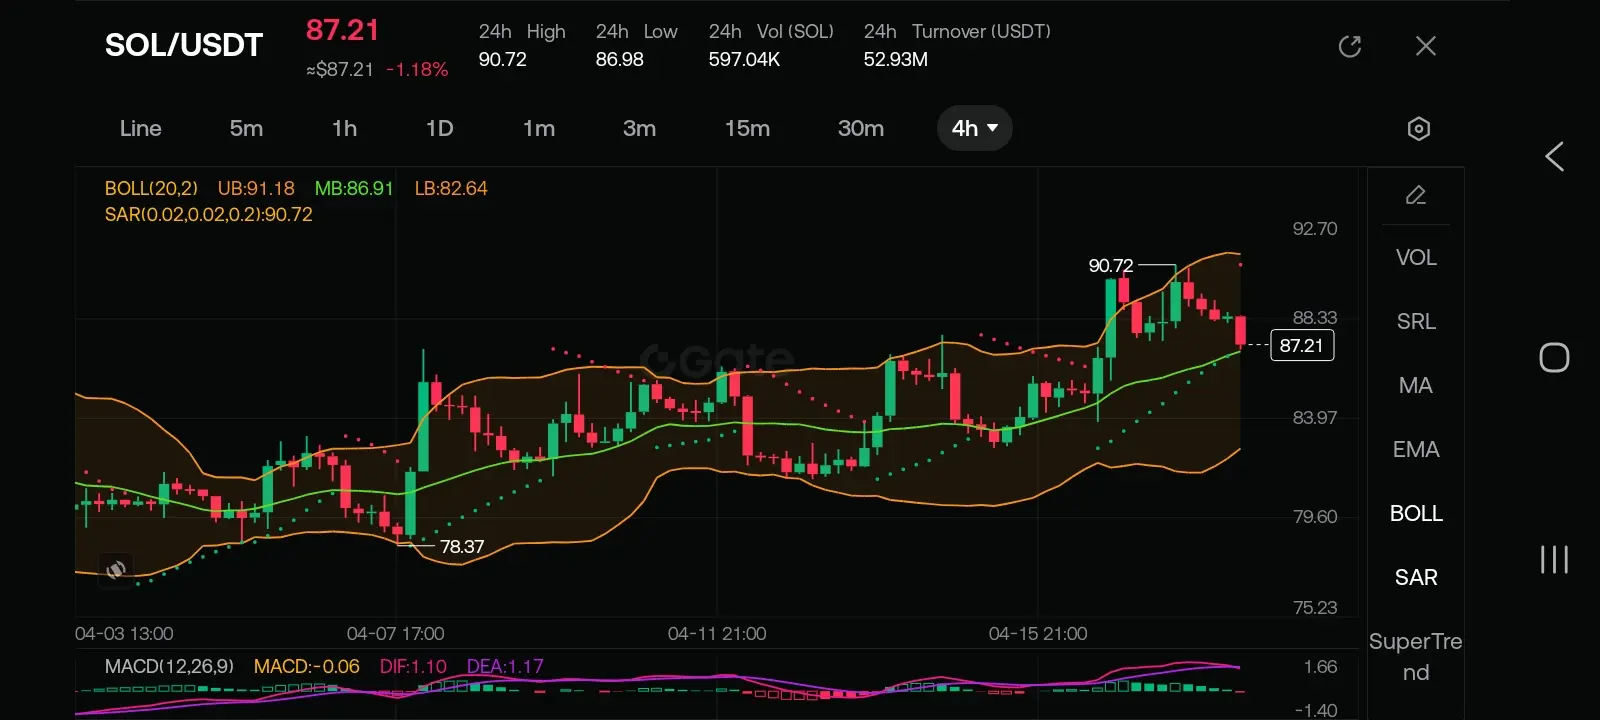
SOL 如一根螺旋弹簧。在牛熊激战、接近 $90.72** 阻力位 (由 SAR)标示的激烈战斗后,价格已回落至 **$87.21 — 一个心理上的中点。
布林带收缩:UB 91.18,MB 86.91,LB 82.64。
这个紧缩区意味着波动性收缩——通常是爆发性行情的前兆。
MACD 显示 DIF (1.10) 略高于 DEA (1.17),直方图微负 (-0.06)——动能几乎为零,犹豫不决。
但超级趋势线 (未完全显示) 结合 SAR (90.72),暗示上方存在压力。然而,价格保持在中间布林带 (86.91) 之上,暗示隐藏的多头支撑。
市场情绪分歧。接下来的4–12小时将决定 SOL 是突破 $90.72** (空头陷阱弹簧),还是跌破 **$86.98 低点 (多头陷阱门)。
🔍 深度技术分析
1. 趋势与结构
· 当前价格:87.21
· 24小时区间:86.98 – 90.72 → 中等波动
· SAR (0.02, 0.02, 0.2): 90.72 — 高于价格 → 抛物线 SAR 表示看空偏向
· 布林带 (20,2): 价格接近中轨 (86.91) → 中性,但上轨 91.18 为阻力,下轨 82.64 为主要支撑。
2. 动能 (MACD)
· MACD线:-0.0
📖 “暴涨前的平静”
SOL 如一根螺旋弹簧。在牛熊激战、接近 $90.72** 阻力位 (由 SAR)标示的激烈战斗后,价格已回落至 **$87.21 — 一个心理上的中点。
布林带收缩:UB 91.18,MB 86.91,LB 82.64。
这个紧缩区意味着波动性收缩——通常是爆发性行情的前兆。
MACD 显示 DIF (1.10) 略高于 DEA (1.17),直方图微负 (-0.06)——动能几乎为零,犹豫不决。
但超级趋势线 (未完全显示) 结合 SAR (90.72),暗示上方存在压力。然而,价格保持在中间布林带 (86.91) 之上,暗示隐藏的多头支撑。
市场情绪分歧。接下来的4–12小时将决定 SOL 是突破 $90.72** (空头陷阱弹簧),还是跌破 **$86.98 低点 (多头陷阱门)。
🔍 深度技术分析
1. 趋势与结构
· 当前价格:87.21
· 24小时区间:86.98 – 90.72 → 中等波动
· SAR (0.02, 0.02, 0.2): 90.72 — 高于价格 → 抛物线 SAR 表示看空偏向
· 布林带 (20,2): 价格接近中轨 (86.91) → 中性,但上轨 91.18 为阻力,下轨 82.64 为主要支撑。
2. 动能 (MACD)
· MACD线:-0.0
SOL2.67%

- 赞赏
- 3
- 评论
- 转发
- 分享
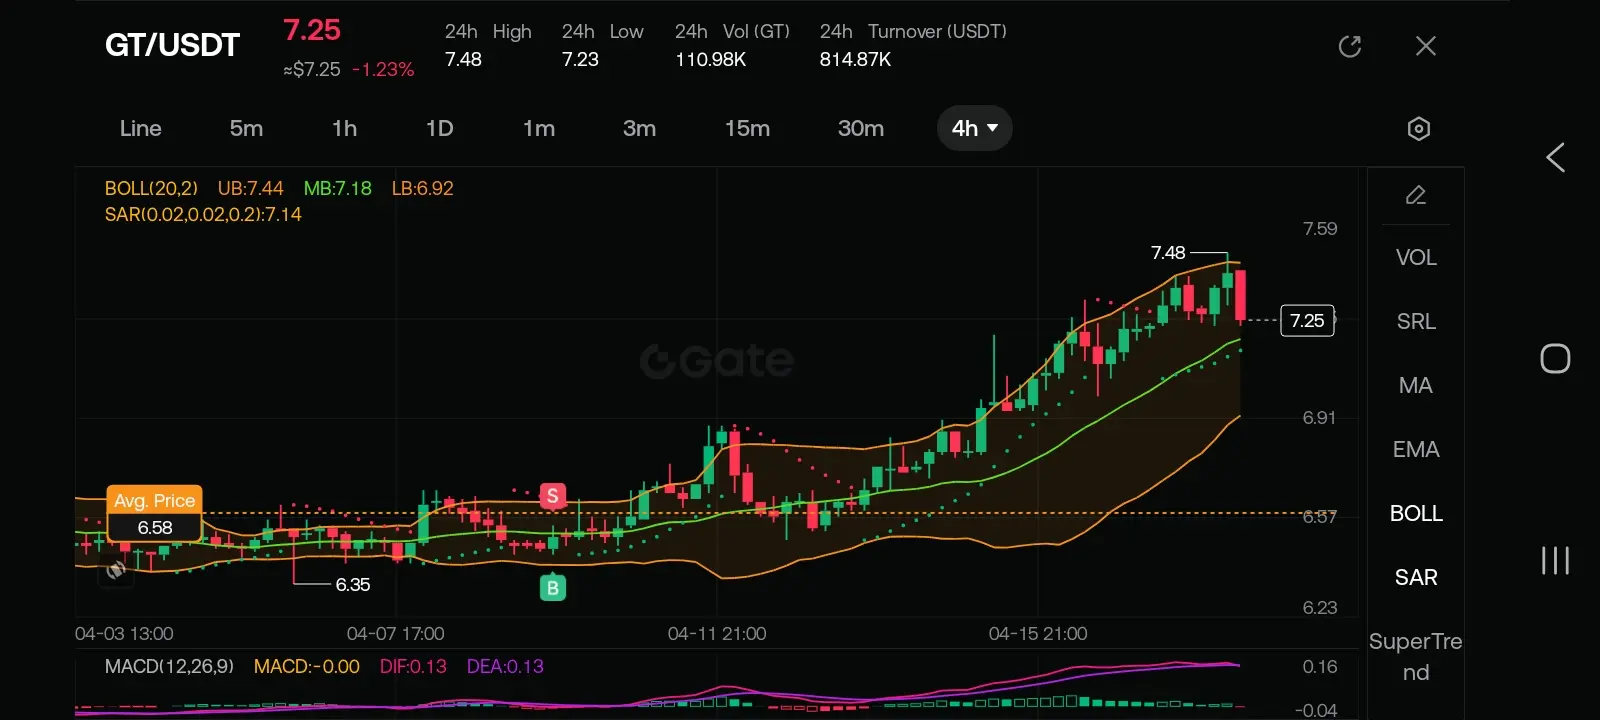
$GT #US-IranTalksVSTroopBuildup
GT/USDT,这里是一个完整、深入的技术分析:
1. 概览与趋势背景
· 当前价格:约7.25 USDT
· 24小时变化:–1.23% (温和看空偏向)
· 波动区间:7.23 – 7.48 (狭窄的日内区间)
· 更高时间框架暗示:价格在布林带的中轨(7.18)之上交易,但在上轨(7.44)以下,暗示从四月初的下跌趋势后出现反弹阶段。
2. 布林带(20,2)
· 上轨:7.44
· 中轨(20日均线): 7.18
· 下轨:6.92
解读:
· 价格重新突破中轨→短期看涨信号。
· 带宽未扩展→目前波动性较低。
· 若价格收盘高于7.44,预期突破至7.60–7.80。
· 若跌破7.18,偏向中性偏空。
3. SAR(抛物线转向指标)
· 数值:7.14
解读:
· SAR在当前价格下方→上涨趋势得到支撑。
· SAR作为动态支撑,接近7.14。
· 若跌破7.14,结构将转为看空。
4. 超级趋势(可能为10,2或类似参数)
· 显示值:0.16 / 0.04 (可能为指标叠加比例差异)
· 在多平台上,超级趋势在7.20–7.22附近由绿转红。
· 当前为绿色→上涨趋势活跃。
5. 交易量与成交额
· 24小时成交量(GT): 110.98K
· 24小时成交额:814.87K USDT
· 平均价格:
GT1.49%

- 赞赏
- 2
- 评论
- 转发
- 分享
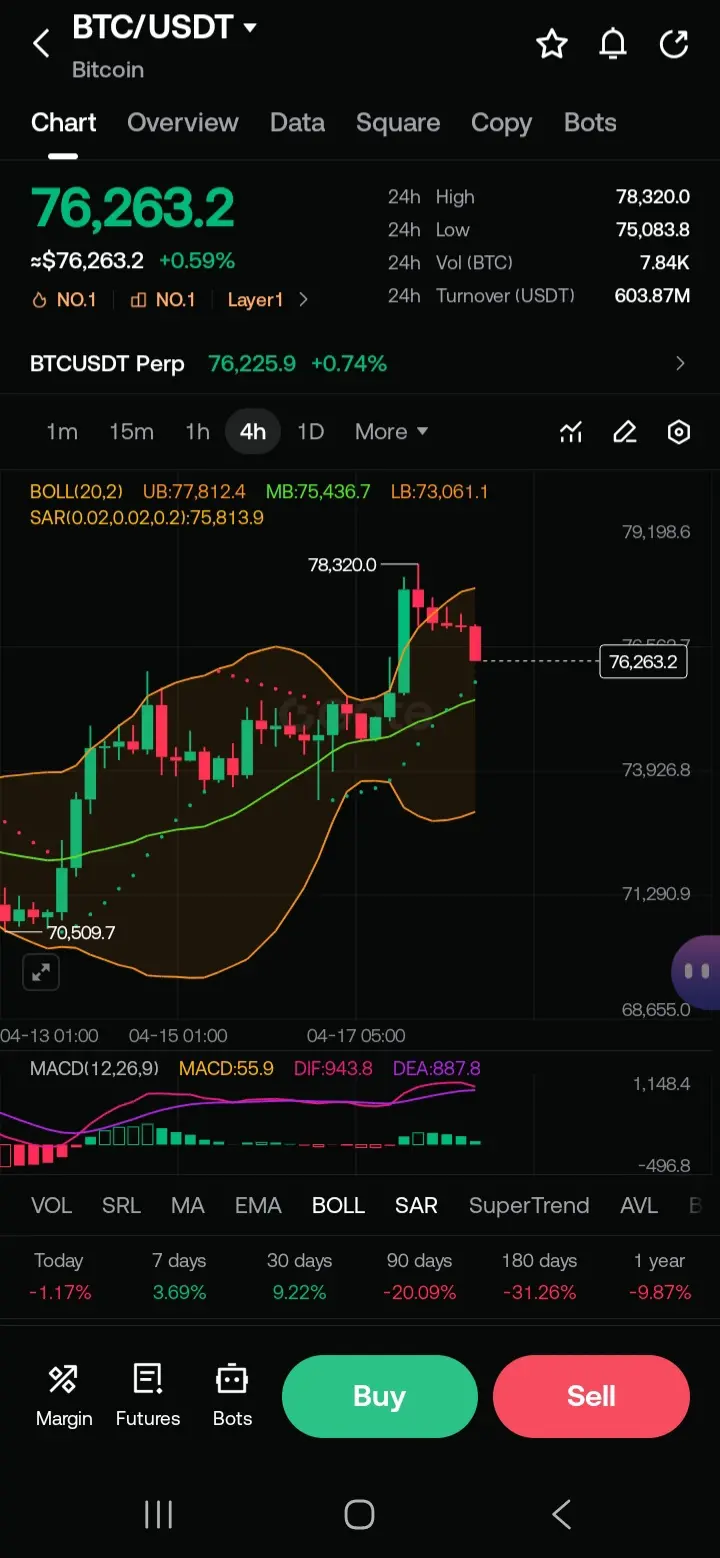
$BTC #Gate13thAnniversaryLive
BTC/USDT 4小时图,这里是简洁的技术分析:
趋势与仓位
· 价格 (76,263.2) 高于布林带中轨 (MB: 75,436.7),表明短期看涨势头。
· 但仍低于上轨 (UB: 77,812.4),显示潜在阻力在前方。
关键指标
· MACD (55.9):看涨信号——柱状图为正,DIF (943.8) 高于 DEA (887.8),确认上行动能。
· SAR (75,813.9):价格在SAR点之上,也支持上涨趋势。
· 成交量:未显示近期放量;当前上涨缺乏强劲的成交量确认。
支撑与阻力
· 立即阻力:78,320.0 (24小时高点)。
· 下一阻力:77,812.4 (布林带上轨)。
· 支撑位:75,436.7 (中轨),然后是73,061.1 (下轨)。
表现概览
· 今日涨幅+0.59%,7日涨幅+3.69%,但在90天 (-20.09%) 和180天 (-31.26%) 内仍处于深度负值,显示中期下行趋势伴随短期反弹。
总结
短期 (4小时框架)偏多,价格在中轨上方,MACD为正。然而,78.3k–77.8k 附近的阻力和成交量不足可能限制上涨空间。突破78.3k将增强看涨信心;未能保持在中轨上方可能会重新测试73k。
BTC2.49%

- 赞赏
- 2
- 评论
- 转发
- 分享
#AltcoinsRallyStrong
比特币让步——山寨币军团刚刚接管了局面
让开,比特币。加密街头有了新的能量,它电光闪烁、色彩斑斓,移动速度比刷新头条还快。当加密之王在高点附近打盹时,一大批山寨币突然解封——它们不再寻求许可。
欢迎来到山寨币接管。这里是发生了什么、为什么重要,以及如何在不赔光的情况下玩转它。
🚀 1. 动能是真实的——而且很响亮
两位数的涨幅不再是新闻;它们已成为本周的新常态。你忘记的代币突然上涨40%。为什么?因为信心具有传染性。当交易者看到全线绿色——不仅仅是比特币——他们开始再次相信。
🧠 2. 聪明的钱变得更聪明
散户和机构都意识到,把所有资金都投入比特币就像只拥有赛车的引擎。山寨币提供实用性、潜力,当然还有风险。但对于那些追求10倍潜力的人来说,加密的侧门现在变成了主入口。
⚙️ 3. DeFi和实用代币才是真正的明星
暂时忘掉狗币(好吧,也许不能完全忘掉)。真正的火焰在DeFi和实用项目中。想象没有银行的借贷、没有中间人的交易,以及没有追逐收益骗局的收益。这些不仅仅是币——它们是从零重建金融的工具。
⚡ 4. 技术终于赶上了炒作
更快的链、几乎零手续费、跨链魔法?那不再是科幻。新一代山寨币正在解决比特币和以太坊变得笨拙的问题。当技术成熟,采纳随之而来。采纳增加,价格就会爆炸。
🔄 5. 资本轮换的大幕已拉开
这是经典的加密舞蹈:比特币上
查看原文比特币让步——山寨币军团刚刚接管了局面
让开,比特币。加密街头有了新的能量,它电光闪烁、色彩斑斓,移动速度比刷新头条还快。当加密之王在高点附近打盹时,一大批山寨币突然解封——它们不再寻求许可。
欢迎来到山寨币接管。这里是发生了什么、为什么重要,以及如何在不赔光的情况下玩转它。
🚀 1. 动能是真实的——而且很响亮
两位数的涨幅不再是新闻;它们已成为本周的新常态。你忘记的代币突然上涨40%。为什么?因为信心具有传染性。当交易者看到全线绿色——不仅仅是比特币——他们开始再次相信。
🧠 2. 聪明的钱变得更聪明
散户和机构都意识到,把所有资金都投入比特币就像只拥有赛车的引擎。山寨币提供实用性、潜力,当然还有风险。但对于那些追求10倍潜力的人来说,加密的侧门现在变成了主入口。
⚙️ 3. DeFi和实用代币才是真正的明星
暂时忘掉狗币(好吧,也许不能完全忘掉)。真正的火焰在DeFi和实用项目中。想象没有银行的借贷、没有中间人的交易,以及没有追逐收益骗局的收益。这些不仅仅是币——它们是从零重建金融的工具。
⚡ 4. 技术终于赶上了炒作
更快的链、几乎零手续费、跨链魔法?那不再是科幻。新一代山寨币正在解决比特币和以太坊变得笨拙的问题。当技术成熟,采纳随之而来。采纳增加,价格就会爆炸。
🔄 5. 资本轮换的大幕已拉开
这是经典的加密舞蹈:比特币上

- 赞赏
- 2
- 评论
- 转发
- 分享
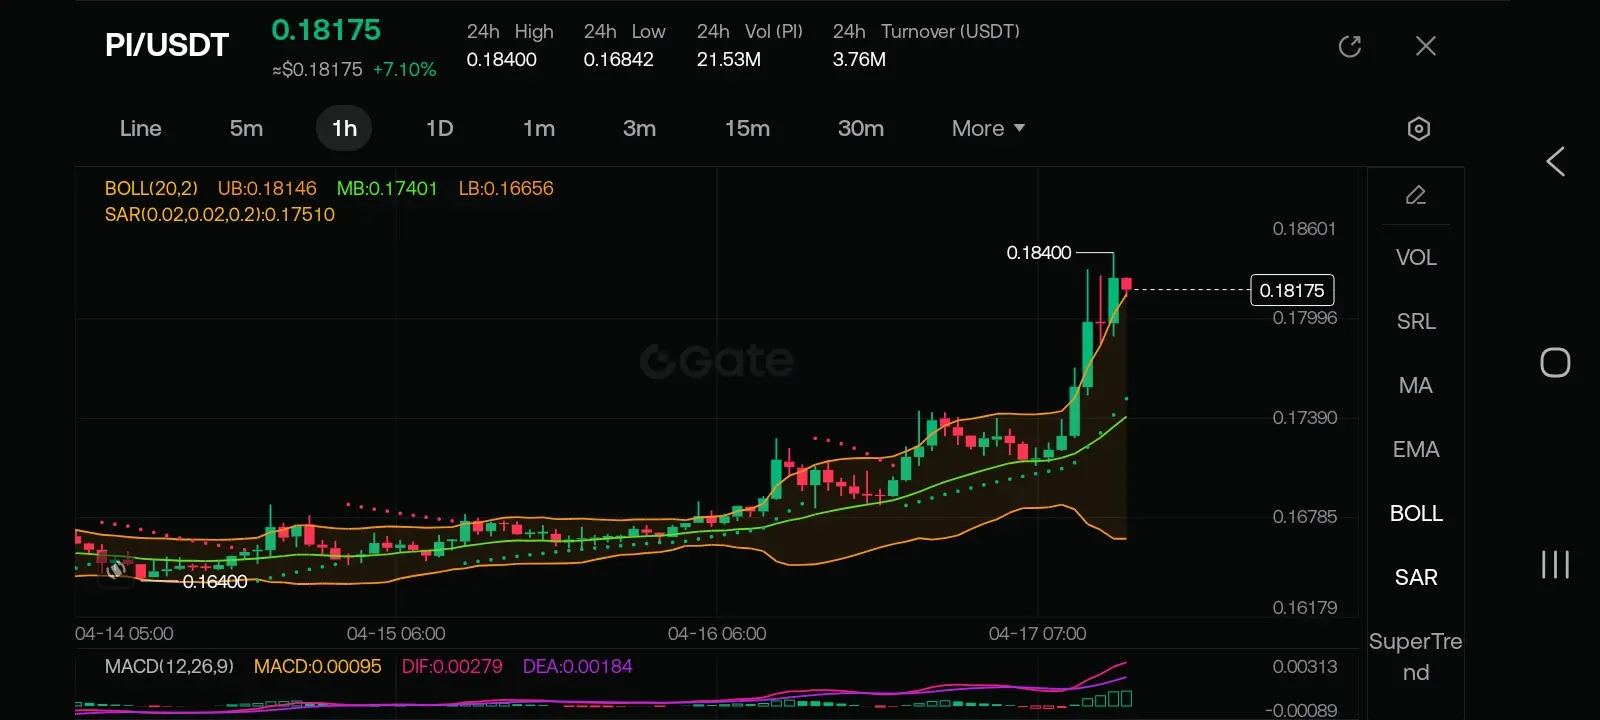
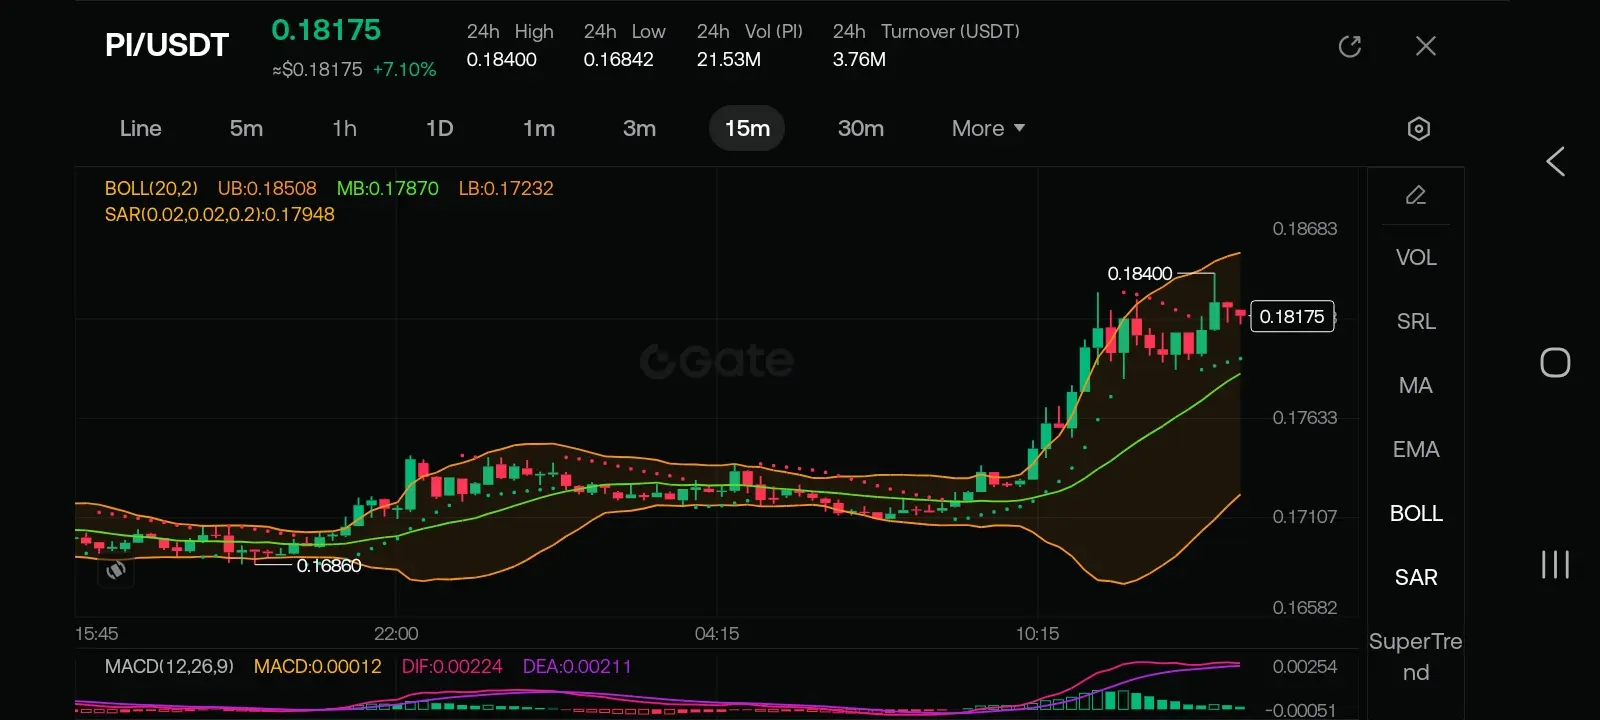
$PI #AltcoinsRallyStrong
以下是对当前市场环境的完整技术分析、交易计划及策略理由。
1. 多时间框架K线分析
(短期:可能为1小时或4小时)
· 价格:约0.18174 (+7.09%)
· BOLL(20,2): 价格在中轨(0.16945)之上,但在上轨(0.17846)之下 → 多头动能但未超买。
· SAR (0.17191): 价格在SAR之上 → 上升趋势。
· MACD: DIF (0.00264) > DEA (0.00122),柱状图为正 → 多头动能增强。
· 成交量:适中但较早低点有所增加。
解读:短期上涨趋势确认。
(中期:4小时或1天)
· 价格:0.18175
· BOLL: 价格触及上轨(0.18146) → 接近超买区域。
· SAR (0.17510): 价格在SAR之上 → 仍然看涨。
· MACD: DIF (0.00279) > DEA (0.00184),但柱状图略小于之前 → 动能减弱。
解读:趋势仍然向上,但动能减弱。可能很快出现回调或盘整。
(长期:1天或以上)
· BOLL(20,2): 价格在中轨(0.17870)和上轨(0.18508)之间 → 上升趋势完好,但接近阻力位。
· SAR (0.17948): 价格在SAR之上 → 看涨。
· MACD: DIF (0.00224) > DEA (0
PI0.09%
- 赞赏
- 4
- 2
- 转发
- 分享
林染财经:
88888888888888888888888888888查看更多
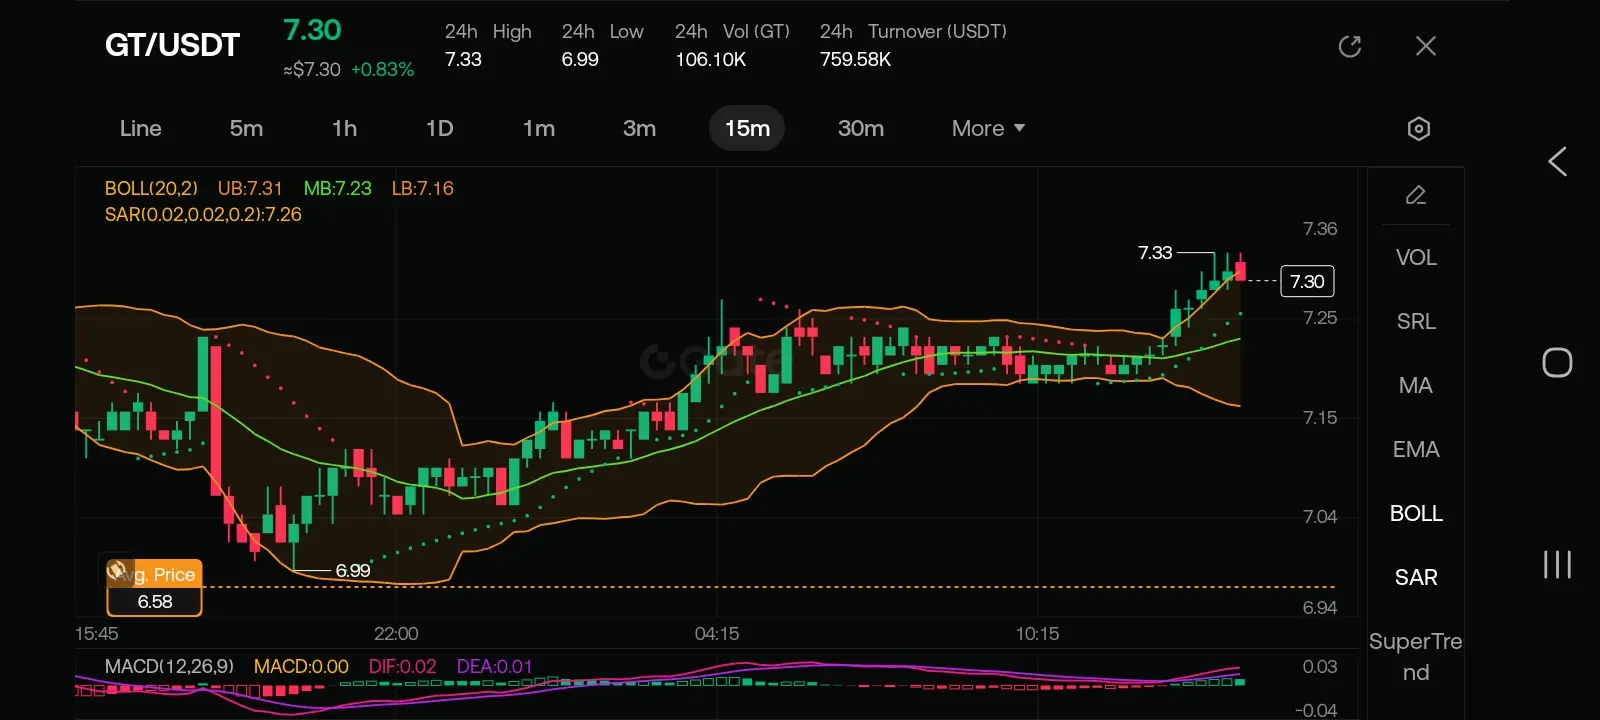
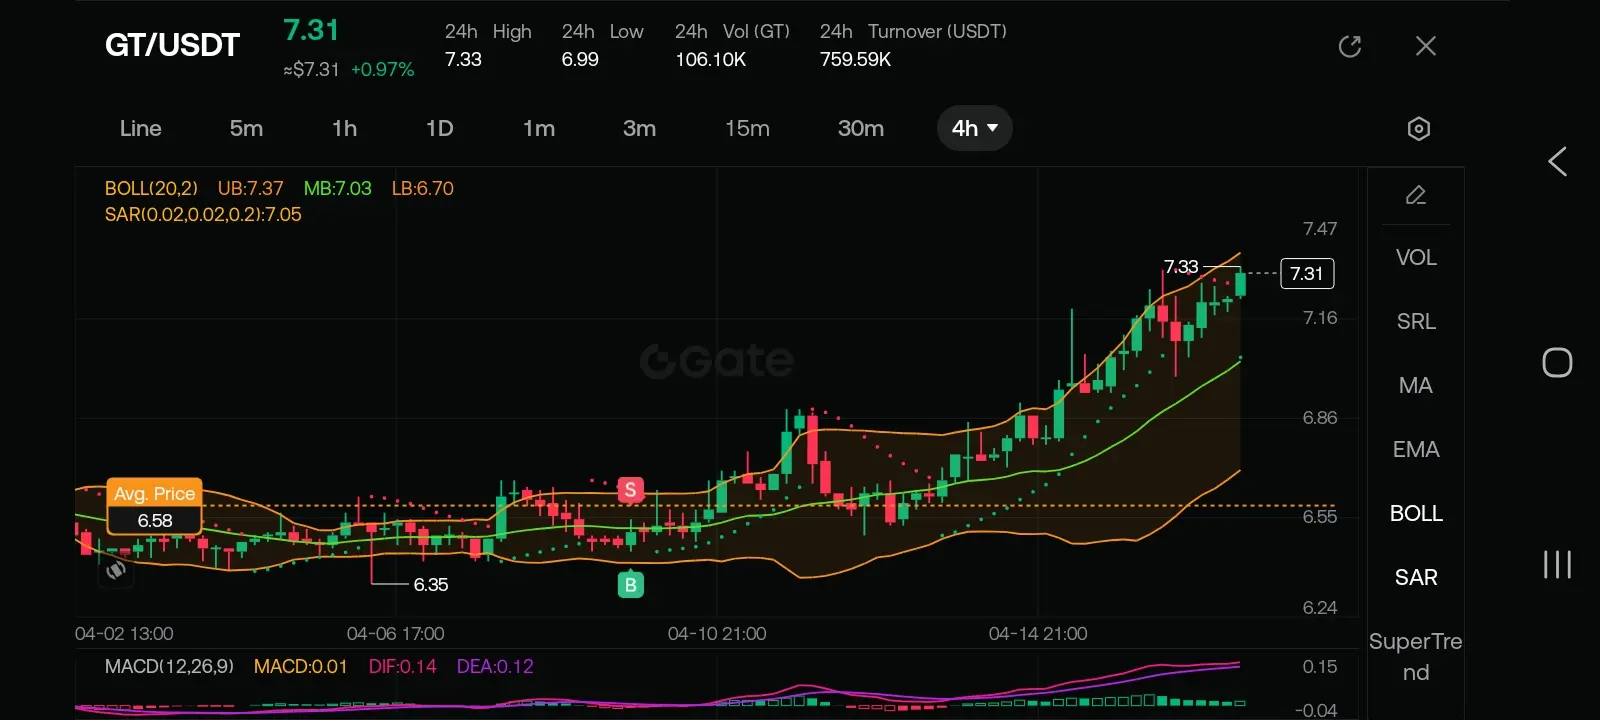
$GT #Gate13thAnniversaryLive GT/USDT 技术分析
**1. 趋势分析:**
- **总体趋势:** 在两个时间框架 (4H 和 15M) 内,价格呈现上升趋势。
- **近期走势:** 经过一系列更高的低点和更高的高点后,价格目前大约在 7.31 - 7.33 附近,显示看涨动能。
**2. 交易量分析:**
- **成交量分布:** 成交量正在逐步增加,支撑了近期的价格上涨。价格上涨过程中的高成交量表明买盘兴趣强劲。
- **波动性:** 在更高价格水平上成交量的增加,可能意味着看涨动能将继续。
**3. 布林带:**
- **当前位置:** 在 4H( 上,价格接近上轨 )7.37;这通常意味着可能处于超买状态。交易者可能预期出现回调或盘整。
- **带宽:** 布林带正在变宽,表明波动性在上升。若突破上轨,可能带来进一步的价格上涨。
**4. 移动平均线:**
- **EMA 与 MA:** 短期移动平均线高于长期移动平均线,确认看涨趋势。价格仍在 20 周期 EMA 之上,强化看涨情绪。
**5. 抛物线转向(Parabolic SAR)(Stop and Reverse):**
- **指标位置:** 两个时间框架内的点都在价格下方,表明可能存在上升趋势。若这些点上移到价格上方,则可能出现潜
GT1.49%
- 赞赏
- 2
- 评论
- 转发
- 分享
#CryptoMarketRecovery April 16, 2026,$BTC $DN 总市值已稳定在约$2.52–$2.62万亿美元左右,但在这层表象之下,仍隐藏着由地缘政治紧张局势、机构资金流动以及选择性资本轮换共同塑造的复杂结构。
📊 宏观与市场概览
在经历了残酷的第一季度之后,crypto市场正处于稳定阶段。Q1期间价格下跌20.4%至$2.4万亿美元后,价格已反弹,但交易量仍然偏弱。关键驱动因素包括:
· 地缘政治情绪:市场仍对美伊和平谈判的信号高度敏感。
· 机构活动:现货ETF资金流入正在提供结构性支撑,总流入已超过$53 billion。
· 监管前景:SEC的CLARITY Act圆桌会议(今天举行),可能为数字证券提供久等的法律清晰度。
🟧 比特币:“生死攸关”的关键转折
比特币正处于关键的技术拐点附近,目前交易价格接近$75,000,信号较为混杂。
· 关键阻力:$76,000–$76,800区间是重要的技术性障碍。链上数据表明,持币者倾向于卖出,从而限制上行空间。要进一步向$78,000-$80,000迈进,需要出现明确的、收盘站上该区间的走势。
· 关键支撑:如果出现回撤拒绝信号,初步支撑位在**$72,000**。跌破此位可能触发对$68,000-$70,000的再测试。
· 基础面支撑:尽管面临阻力,鲸鱼的增持力度依然很强。过
查看原文📊 宏观与市场概览
在经历了残酷的第一季度之后,crypto市场正处于稳定阶段。Q1期间价格下跌20.4%至$2.4万亿美元后,价格已反弹,但交易量仍然偏弱。关键驱动因素包括:
· 地缘政治情绪:市场仍对美伊和平谈判的信号高度敏感。
· 机构活动:现货ETF资金流入正在提供结构性支撑,总流入已超过$53 billion。
· 监管前景:SEC的CLARITY Act圆桌会议(今天举行),可能为数字证券提供久等的法律清晰度。
🟧 比特币:“生死攸关”的关键转折
比特币正处于关键的技术拐点附近,目前交易价格接近$75,000,信号较为混杂。
· 关键阻力:$76,000–$76,800区间是重要的技术性障碍。链上数据表明,持币者倾向于卖出,从而限制上行空间。要进一步向$78,000-$80,000迈进,需要出现明确的、收盘站上该区间的走势。
· 关键支撑:如果出现回撤拒绝信号,初步支撑位在**$72,000**。跌破此位可能触发对$68,000-$70,000的再测试。
· 基础面支撑:尽管面临阻力,鲸鱼的增持力度依然很强。过
- 赞赏
- 2
- 1
- 转发
- 分享
EqunixHub:
好文章,继续保持#JaneStreetBets$7BonCoreWeave
🧠 重新塑造你的交易的1%规则
大多数交易者都在追逐独角兽。
他们想要完美的布局,10倍的暴涨,那个“奇怪的技巧”能开启市场。
与此同时,专业人士在捡零币。
但不是普通的零币——是看不见的零币。每个人都踩在脚下的那种。
他们知道的你不知道的事情是:
你不需要圣杯。
你需要100个微小、无聊、不性感的修正——每个只值0.5%。
而99%的交易日志漏洞在哪里?
不是你的入场。也不是你的出场。
而是在你平仓之后发生的事情。
🔁 微复利循环
第一步——找到那一滴 💧
问:我在哪无缘无故地亏了0.5%?
→ 犹豫了2秒才入场。
→ 因为“感觉对”而加仓。
→ 跳过了盘前波动扫描。
第二步——应用一个修正 🔧
改变一个微小的行为。例子:
· 如果被噪音止损,就把止损点向外移动3点。
· 昨天愤怒交易时,减仓10%。
· 每次亏损后强制冷静30分钟。
第三步——观察复利 📈
1%的改进 × 100笔交易 ≠ 100%的优势。
这是指数增长。
(1.01)^100 ≈ 2.7 → 在你改变策略之前,累计优势达170%。
📓 “优势日志” (非你的普通日志)
别写“我应该持仓更久”。
相反,每个星期五,回答一个问题:
“我下周要安装哪个微观流程升级?”
来自停止无谓努力的交易者的真实例子:
· ✅ “我为非农和CPI设置了日历
查看原文🧠 重新塑造你的交易的1%规则
大多数交易者都在追逐独角兽。
他们想要完美的布局,10倍的暴涨,那个“奇怪的技巧”能开启市场。
与此同时,专业人士在捡零币。
但不是普通的零币——是看不见的零币。每个人都踩在脚下的那种。
他们知道的你不知道的事情是:
你不需要圣杯。
你需要100个微小、无聊、不性感的修正——每个只值0.5%。
而99%的交易日志漏洞在哪里?
不是你的入场。也不是你的出场。
而是在你平仓之后发生的事情。
🔁 微复利循环
第一步——找到那一滴 💧
问:我在哪无缘无故地亏了0.5%?
→ 犹豫了2秒才入场。
→ 因为“感觉对”而加仓。
→ 跳过了盘前波动扫描。
第二步——应用一个修正 🔧
改变一个微小的行为。例子:
· 如果被噪音止损,就把止损点向外移动3点。
· 昨天愤怒交易时,减仓10%。
· 每次亏损后强制冷静30分钟。
第三步——观察复利 📈
1%的改进 × 100笔交易 ≠ 100%的优势。
这是指数增长。
(1.01)^100 ≈ 2.7 → 在你改变策略之前,累计优势达170%。
📓 “优势日志” (非你的普通日志)
别写“我应该持仓更久”。
相反,每个星期五,回答一个问题:
“我下周要安装哪个微观流程升级?”
来自停止无谓努力的交易者的真实例子:
· ✅ “我为非农和CPI设置了日历
- 赞赏
- 2
- 评论
- 转发
- 分享
#StrategyBuys13,927BTC
⚠️ 为什么过度交易在无声中吞噬你的账户
2026年4月15日更新:恐惧主导,但耐心取胜
让我们直奔主题。2026年4月15日的市场现状,对于任何考虑过度交易的人来说,应该是一个响亮的警告。
· 市场总市值:约3.5万亿美元
· 比特币价格:交易接近72,000美元 (较其历史最高点下跌超过43%)
· 恐惧与贪婪指数:16 — 极度恐惧
· 比特币主导地位:58.5%
· Gate.io清算快照:最近一天内,112,329名交易者被清算。仅Gate.io就发生4,425万美元的清算 (其中174.74%为多头仓位)。信息十分明确:纪律不是可选项,它关乎生存。
残酷的真相:活动≠盈利
数字不会撒谎。Crypto恐惧与贪婪指数正陷在“极度恐惧”,而且已经持续了一段时间。这不是一个奖励鲁莽行为的市场,而是一个惩罚它的市场。
💡 更少交易,更精准决策,更强一致性
在这种高波动环境下,真正通往成功的关键并不是更多的交易,而是更聪明的交易。只要有合适的风险管理,即便只有一个高质量的交易方案,也永远会胜过十次随机、冲动的入场。
Gate.io依然是以这种自律方式实现交易的顶级平台。该交易所的全球现货交易排名保持在第3位,2026年3月的月交易量为557亿美元 $BTC ,衍生品市场份额为12.2% (历史最高)。它服务超过5100万注册用户,并
BTC2.49%

- 赞赏
- 2
- 评论
- 转发
- 分享
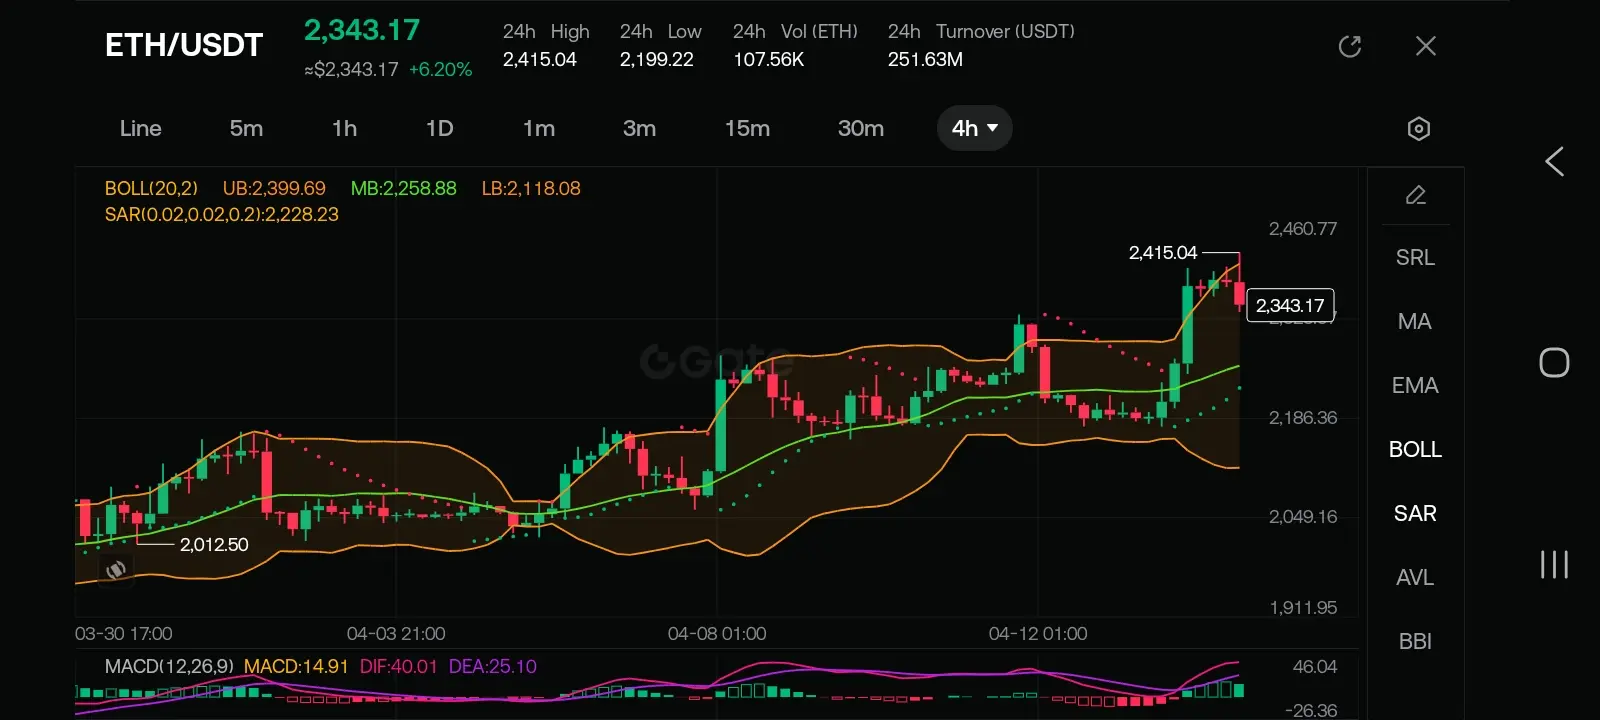
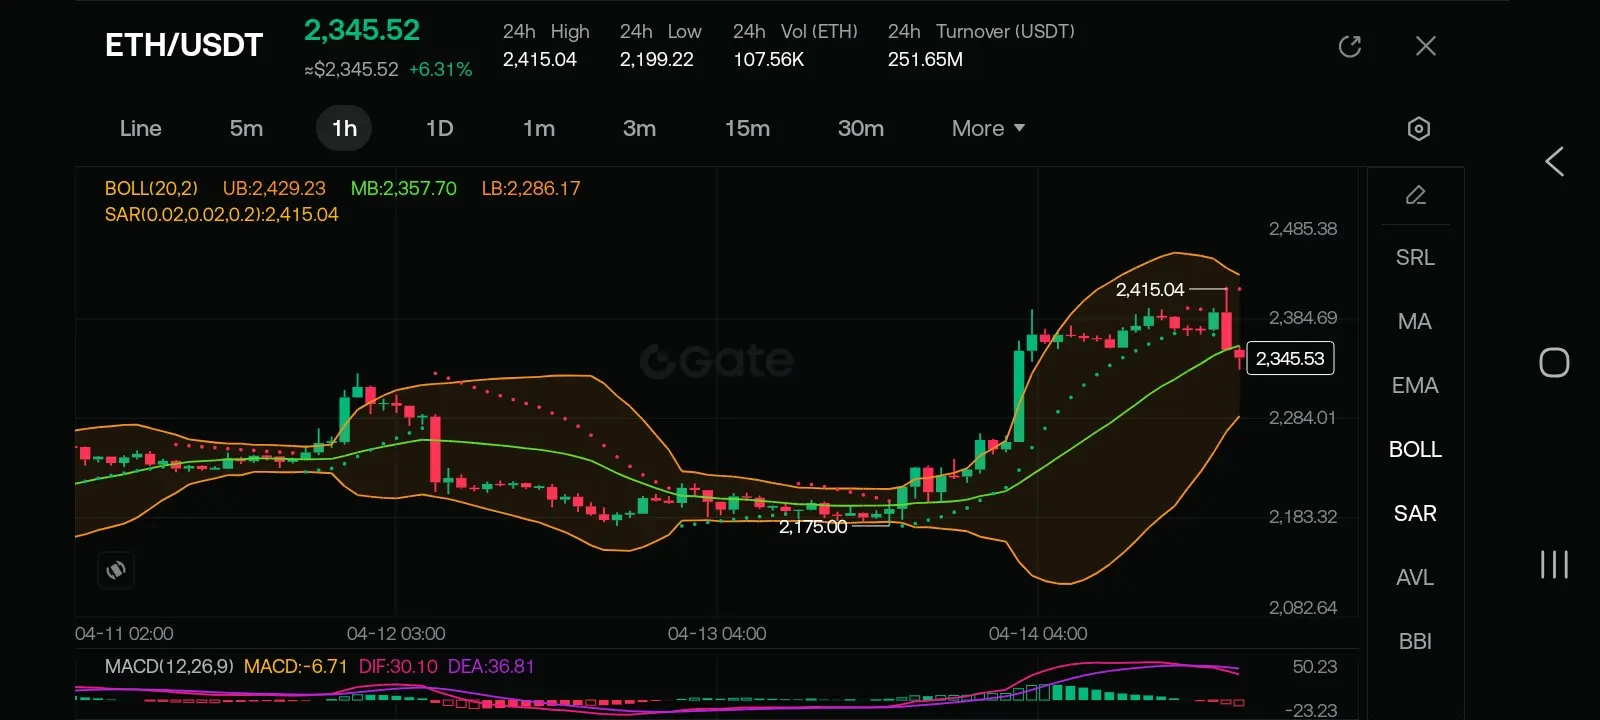
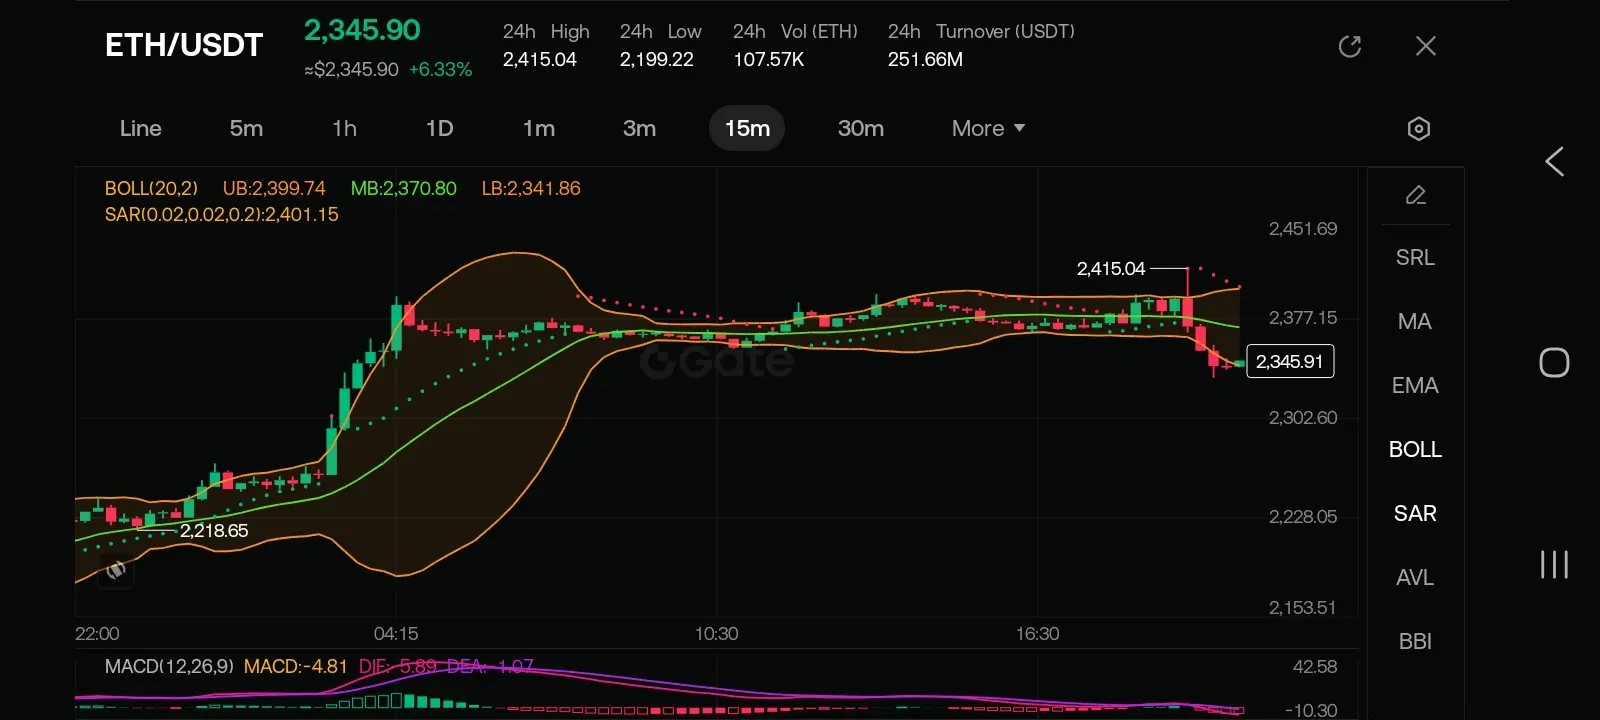
$ETH 观察 ETH/USDT 图表 (4小时、1小时和15分钟),我可以识别出市场结构的转变。经过一次强劲的 impulsive 上涨至 2,415.04 的流动性池后,价格目前正经历回调。$ETH
基于智能资金概念 (SMC) 和技术指标 (布林带、MACD 和 SAR),以下是多时间框架的深入分析。
1. 市场结构与趋势 (4小时图)
4小时图显示出明显的多头市场结构,伴随着一系列的更高高点 (HH) 和更高低点 (HL)。
MSB (市场结构突破): 最近突破 2,280 水平确认了多头意图。
当前状态:价格在 2,415.04 触顶后开始回调。这看起来像是在寻找卖方流动性,然后可能继续上涨。
SAR 见解:在4小时图上,抛物线SAR点仍在价格下方,暗示此走势的宏观趋势暂时仍然向上。
2. SMC 支撑与阻力区域 (供需)
根据价格行为和蜡烛簇,以下是你的区域的具体值:
区域类型 价值范围 (USDT) 重要性
主要供给 (目标) $2,415 - $2,460 最近的摆动高点。预计这里会有大量卖压。
即时支撑 (MB) $2,258 - $2,286 与4小时图中间布林带和之前的盘整区域一致。
SMC 需求区 (POI) $2,175 - $2,218 上次突破的“起点”。这是一个高概率的“买跌”入场区域。
极端折扣 $2,118 4小时图下布林带;跌
ETH3.07%
- 赞赏
- 2
- 1
- 转发
- 分享
EqunixHub:
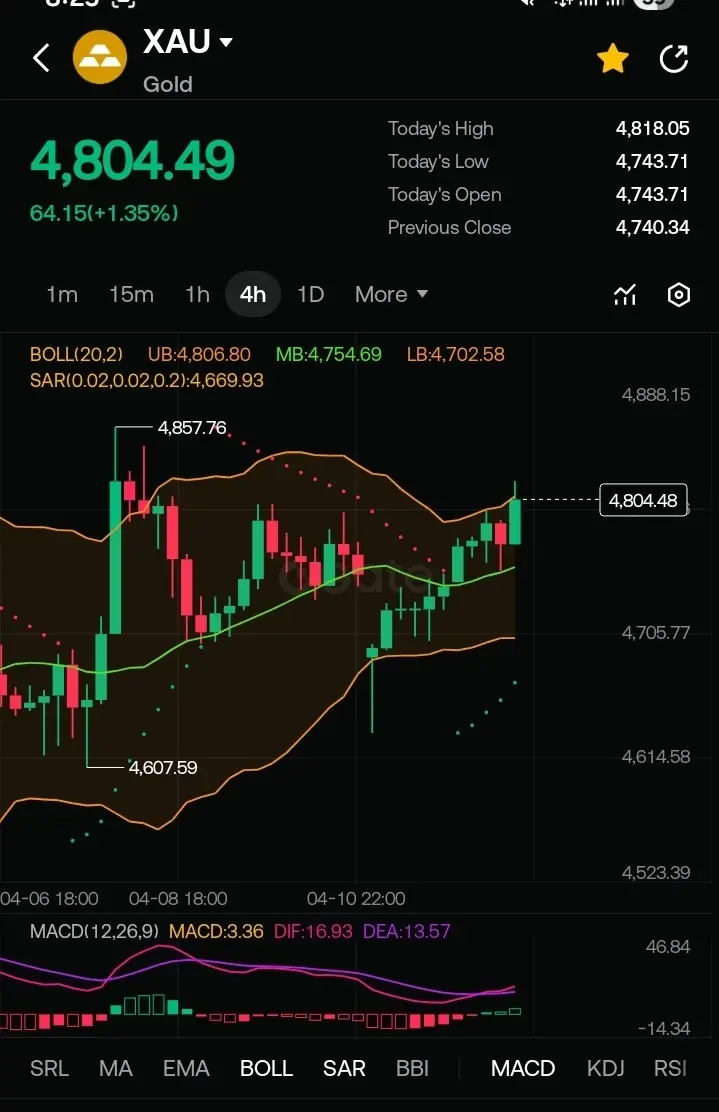
哇,精彩的文章,干得好基于 4小时 4H 图表(XAU/USD)黄金,这里是截至2026年4月14日的深入技术分析。
当前市场环境
目前价格报 4,804.49,涨幅 +1.35%。图表反映了在一段盘整之后进入了反弹阶段。Gold 目前正在测试一个重要的心理与技术阻力位,即 4,800 关口附近。
1. 趋势与支撑/阻力
直接阻力:价格正紧贴在 4,800 水平附近。如果能够干净地突破图表左侧所示、最近一次摆动高点 4,857.76,那么将确认结构发生转变,并开启一段新的看涨上行行情。
直接支撑:Bollinger Bands(布林带)中的 Green Mid-Band MB 在 4,754.69,作为第一道动态支撑。
关键结构支撑:Lower Bollinger Band LB 在 4,702.58,以及近期接近 4,607.59 的局部低点,构成当前这套看涨结构的“地板”。
2. 技术指标
Bollinger Bands 120,2#CryptoMarketRecovery :* 价格已突破中轨,目前正沿 Upper Band UB 运行:4,806.80(。
这表明短期看涨动能很强,但由于价格贴近 Upper Band UB,这也暗示该资产正处于“局部超买”状态;此类情况通常会在下一次行动之前,引发小幅回调或横向盘整。
Parabolic SAR:
此刻点位位于价格K线下方,
XAUT-0.52%

- 赞赏
- 2
- 评论
- 转发
- 分享
#AreYouBullishOrBearishToday?
🧠 最难以接受的加密货币交易真相 (2026年4月14日)
让我们面对现实——今天的市场是一场情绪搅拌机。
比特币在上周的假突破后徘徊在$72k 附近。以太坊像钝刀一样摇晃。瑞波币在同一根蜡烛中先挑衅突破然后抛售。你盯着你的盈亏表,心跳加速,心想:
“我又搞砸了吗?”
大多数交易者不愿承认的是:
🔥 损失不是你的敌人——你的自尊才是。
当每个人都在追逐绿色蜡烛、在Telegram上晒胜利时,真正的游戏在于你如何应对红色。
让我们为我们目前的市场逆转剧情。
① 💸 将损失视为“市场学费”——不是烧钱
你不会开餐厅不付租金。
你不会开车横穿国家不买油。
那么,为什么你把止损当成个人背叛?
2026年4月14日的现实检验:
这个市场会拿走你的钱。唯一的问题是——你会从中学到什么吗?
✔️ 每一次亏损都是一张教训的收据
✔️ 每一次清算都是学费 $200 有人付得比别人多(
📉 “我今天亏了)” → ❌ 错误的表达
📈 “我付了$500 学会在凌晨3点追蜡烛线是愚蠢的” → ✅ 成长
② 🎯 停止崇拜胜率——崇拜执行质量
你刚在$3,820的以太坊做空,因为你的系统这么说。
20分钟后触及止损。你感觉自己像垃圾。
但今天这个波动市场的尴尬问题是:
你遵守规则了吗?
如果是→那就是伪装的胜利。
如果不是→即使是盈利的交
查看原文🧠 最难以接受的加密货币交易真相 (2026年4月14日)
让我们面对现实——今天的市场是一场情绪搅拌机。
比特币在上周的假突破后徘徊在$72k 附近。以太坊像钝刀一样摇晃。瑞波币在同一根蜡烛中先挑衅突破然后抛售。你盯着你的盈亏表,心跳加速,心想:
“我又搞砸了吗?”
大多数交易者不愿承认的是:
🔥 损失不是你的敌人——你的自尊才是。
当每个人都在追逐绿色蜡烛、在Telegram上晒胜利时,真正的游戏在于你如何应对红色。
让我们为我们目前的市场逆转剧情。
① 💸 将损失视为“市场学费”——不是烧钱
你不会开餐厅不付租金。
你不会开车横穿国家不买油。
那么,为什么你把止损当成个人背叛?
2026年4月14日的现实检验:
这个市场会拿走你的钱。唯一的问题是——你会从中学到什么吗?
✔️ 每一次亏损都是一张教训的收据
✔️ 每一次清算都是学费 $200 有人付得比别人多(
📉 “我今天亏了)” → ❌ 错误的表达
📈 “我付了$500 学会在凌晨3点追蜡烛线是愚蠢的” → ✅ 成长
② 🎯 停止崇拜胜率——崇拜执行质量
你刚在$3,820的以太坊做空,因为你的系统这么说。
20分钟后触及止损。你感觉自己像垃圾。
但今天这个波动市场的尴尬问题是:
你遵守规则了吗?
如果是→那就是伪装的胜利。
如果不是→即使是盈利的交
- 赞赏
- 3
- 评论
- 转发
- 分享
#WCTCTradingChallengeShare8MUSDT
💰 当 BTC 突破 75,000 美元时,真正的信心才会开始真正起飞
别再相信“赢会让信心变强”——那是新手的毒药。
让我们看看今天的市场 🔥
2026年4月14日——BTC 硬是冲破 74,000 美元**,5% 的强势拉升中冲到 **74,888 美元**。
ETH 随后跟上,几乎涨近 8%,突破 **2,400 美元**。
近 **180,000 名交易者**被清算。超过 **$400 million** 的空头在做空端被抹杀。
你猜怎么着?恐惧与贪婪指数只是从 12 → 21 发生了变化。
依然深陷“极度恐惧”。
当所有人都在恐慌时,最好的钱就会被赚到。
但当别人恐慌时……你有没有那个胆量去买?
大多数交易者犹豫,不是因为他们蠢——而是因为他们没有一个自己信得过的系统。
真正的交易信心不是在 BTC 达到 75K 的时候相信自己。
而是你在 **$65K 一次残酷回撤中加仓**,并说:
“我的系统已经搞定了。”
🧠 Gate.io 专项:真正的“不可摧毁”交易信心究竟从哪来?
🎯 ① 终结混乱——建立系统
信心从随机性结束的那一刻开始。
今天这一下,就是最好的教训:
4 月初,BTC 在“美伊会谈”希望的带动下冲到 72.7K 美元。
4 月 12 日——会谈破裂
BTC2.49%

- 赞赏
- 3
- 评论
- 转发
- 分享
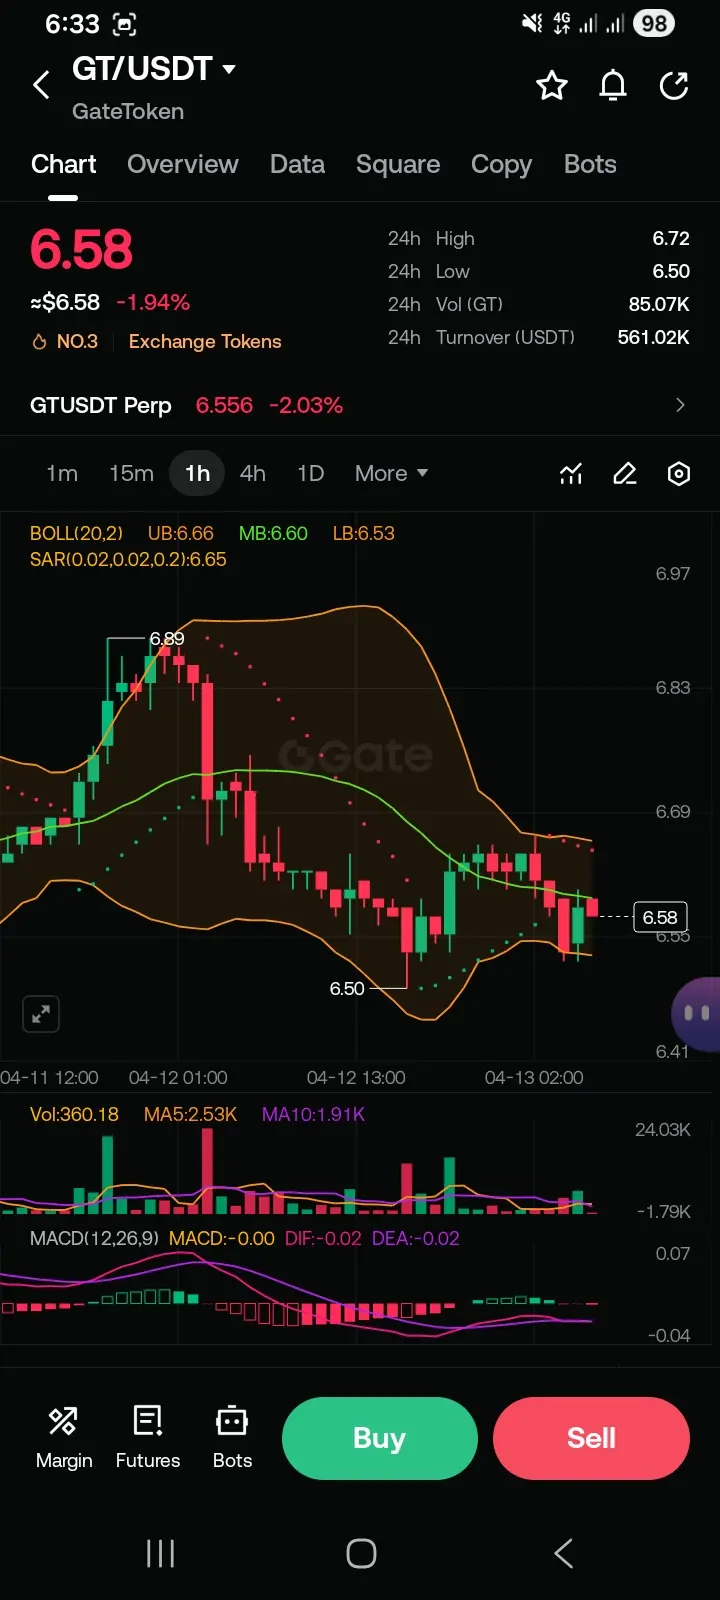
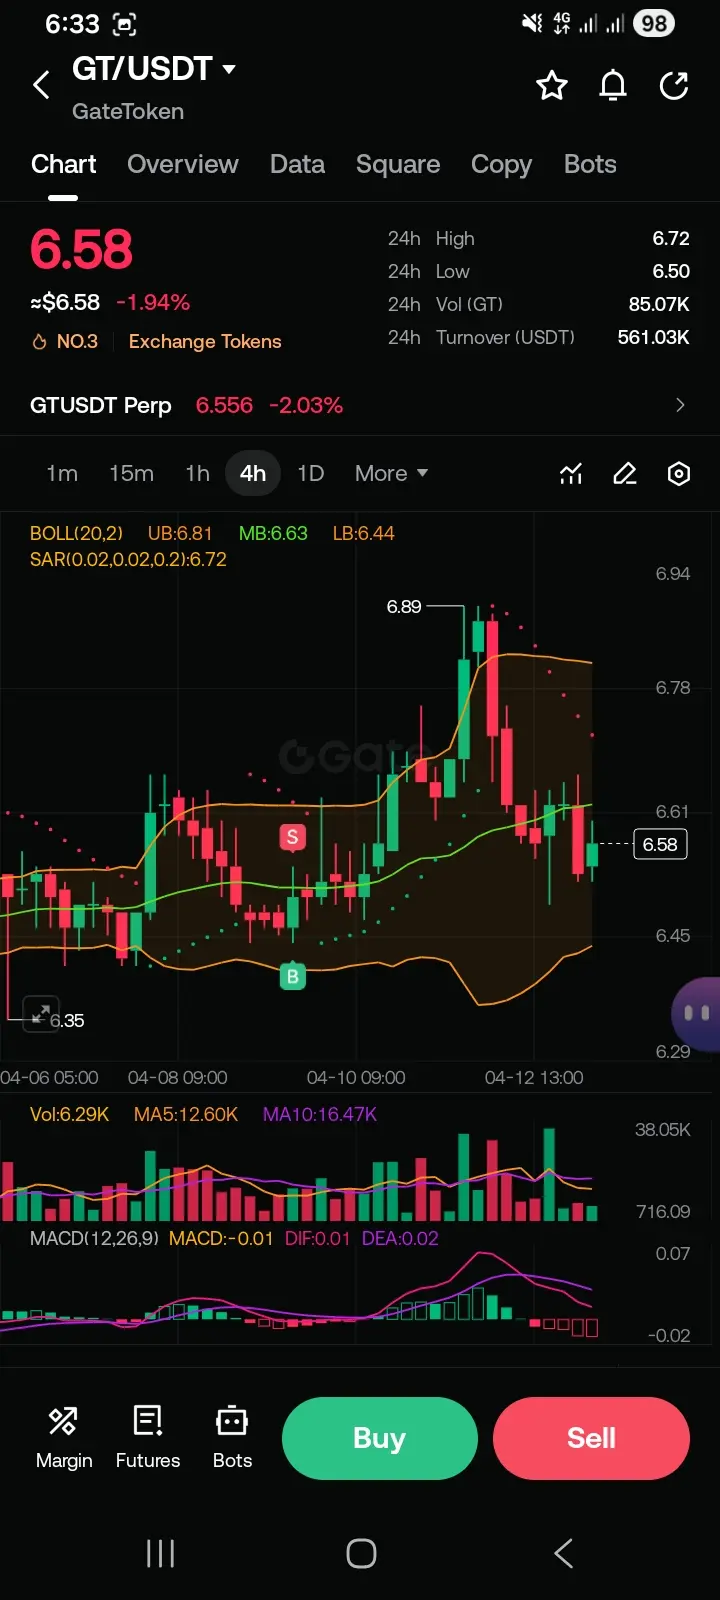
#GateSquareAprilPostingChallenge 🚨 GT/USDT:风暴前的平静?$GT
当前价格 $6.58 (-1.94%) – 交易所代币在宏观趋势与微观犹豫之间徘徊。让我们穿透噪音。 🧠🔪
📊 多时间框架K线深度分析
🕐 1小时图 (短期脉冲)
· BB(20,2): 价格6.58紧贴MB 6.60 → 布林带挤压警告 ⚠️
上轨6.66 / 下轨6.53 → 2%狭窄范围 → 突破在即 🧨
· SAR:6.65高于价格 → 空头趋势确认 🐻
· MACD:-0.00 (平稳),DIF -0.02 / DEA -0.02 → 动能零线拒绝 → 还没有燃料
· 交易量:360 (远低于MA5 2.53K) → 参与度低 = 假动作风险 🚫
1小时结论:🟡 区间震荡 – 空头倾向,但多头尚未放弃。
🕓 4小时图 (中期真相)
· BB(20,2): 价格低于MB 6.63,接近LB 6.44 → 下行通道活跃 📉
· SAR:6.72高于价格 → 明确空头结构 🐻❄️
· MACD:-0.01,DIF 0.01低于DEA 0.02 → 空头交叉确认 – 动能减弱
· 交易量:6.29K低于MA5 12.6K & MA10 16.47K → 无积累 – 卖方缺席,买方休眠 😴
4小时结论:🔴 弱势空头延续 – 除非成交量爆
GT1.49%
- 赞赏
- 2
- 1
- 转发
- 分享
EqunixHub:
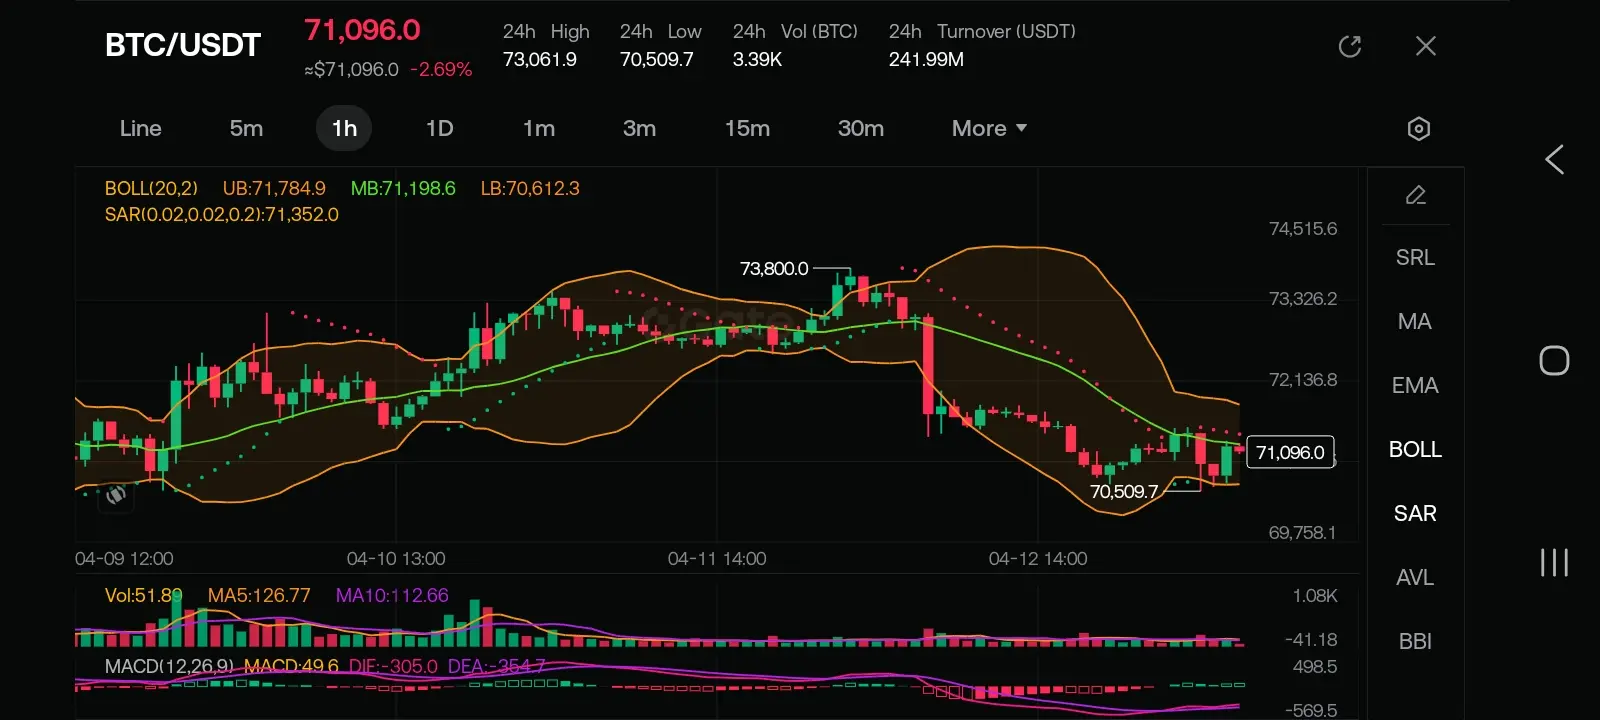
好$BTC 比特币/USDT 技术分析 (1小时图表)
当前价格:71,096.0 USDT
24小时变化:-2.69%
24小时最高/最低:73,061.9 / 70,509.7
时间周期:4月9–12日 (基于1小时蜡烛图)
I. 趋势与结构
· 短期趋势:价格从70,509支撑反弹至71,096,但仍低于前高。SAR (71,352) > 当前价格 → 仍处于下行趋势。
· 布林带 (20,2):价格在中轨 (MB 71,198.6) 以下,偏空。下轨 (70,612) 提供支撑。突破中轨是恢复的前提。
· 关键水平:
· 阻力:71,785 (UB),72,137 (MA),73,326 / 73,800 / 74,516 (前高)
· 支撑:70,612 (LB),70,510 (24小时最低),69,758 (之前的SAR支撑)
II. 技术指标
指标 数值 信号
BOLL(20,2) UB 71,785 / MB 71,199 / LB 70,612 价格在中轨以下 → 空头;但下轨持稳 → 可能在区间内震荡。
SAR(0.02,0.02,0.2) 71,352 空头趋势。突破SAR上方将发出反转信号。
MACD(12,26,9) DIF 49.6 / DEA -305.0 / 柱状图 +354.6 看涨交叉 (DIF > DEA) → 短期底部
BTC2.49%

- 赞赏
- 2
- 评论
- 转发
- 分享
热门话题
查看更多31.14万 热度
78.07万 热度
17.98万 热度
23.92万 热度
3.6万 热度
置顶
Gate Pre-IPOs 首期项目:SpaceX (SPCX) 认购现已开启!
🔹 认购总量 33,900 $SPCX|单价 $590
🔹 隐含估值 $1.4万亿
🔹 支持 $USDT 或 $GUSD 认购
🔹 越早认购 = 分配权重越高
🔹 认购新用户参与余币宝,最高享 200% 年化收益
🔹 VIP 5+ 用户及超级代理商享额外空投
📅 认购截止:2026年4月22日18:00(UTC+8)
立即认购:https://www.gate.com/ipos/2
更多详情:https://www.gate.com/article/50724十三载风雨同行,您是 Gate 最珍贵的见证者。分享您的故事,瓜分重磅周年豪礼!
参与方式
1️⃣ 带 #Gate13周年 和相应主题标签,在 13 周年留言板或广场发帖
2️⃣ 分享您与 Gate 的故事、送上祝福,或畅想未来 13 年
13 周年定制礼盒、红牛模型、大额仓位体验券等您来拿!
13周年庆留言板 👉️ https://www.gate.com/activities/13th-anniversary
Gate 广场 👉️ https://www.gate.com/post
13 年成长,感谢有您。您的故事,我们期待聆听!
详情:https://www.gate.com/announcements/article/50694🎉 Gate 广场创作者狂欢正式开启
发文冲榜、社群接龙、分享有奖 — 瓜分 2,000 USDT 及周年礼包
📅 活动时间:4 月 8 日 - 4 月 22 日
✅ 发文冲榜:内容质量 + 互动数据 + 挖矿收益综合评分瓜分1200 USDT
✅ TG群组打卡:每周抽 3 份周年礼盒 + 7 份 200 U 体验金券
✅ X 同步奖:分享内容至 X 平台,瓜分 500 USDT 额外奖池
📌 活动详情:https://www.gate.com/announcements/article/50593
📌 报名链接:https://www.gate.com/questionnaire/7536
#Gate广场 #创作者狂欢 #内容挖矿✍️ Gate 广场「创作者认证激励计划」进行中!
我们欢迎优质创作者积极创作,申请认证
赢取豪华代币奖池、Gate 精美周边、流量曝光等超 $10,000+ 丰厚奖励!
立即报名 👉 https://www.gate.com/questionnaire/7159
📕 认证申请步骤:
1️⃣ App 首页底部进入【广场】 → 点击右上角头像进入个人主页
2️⃣ 点击头像右下角【申请认证】进入认证页面,等待审核
让优质内容被更多人看到,一起共建创作者社区!
活动详情:https://www.gate.com/announcements/article/47889