Gate Research: Gate Research: BTC and ETH Consolidate as AI and Privacy Computing Sectors Show Structural Strength
Crypto Market Overview
According to CoinGecko data, global markets showed pronounced divergence between December 2 and December 15, 2025. Although the Fed delivered a rate cut as expected, policy disagreements and expectations of a pause in further easing continued to suppress overall risk appetite. Gold outperformed traditional assets with a year-to-date gain exceeding 60%, while equity markets reached new highs amid cooling sentiment in AI infrastructure. In crypto markets, fear sentiment rebounded, trading volume concentrated in major assets and stablecoins, and capital flows tilted toward defensive positioning and volatility hedging.【1】
From a structural perspective, BTC retreated sharply after briefly breaking above USD 94,000, forming a pattern of lower highs on the 4-hour timeframe; the USD 90,000–91,000 zone has shifted from support to resistance. ETH pulled back from around USD 3,400 but continues to consolidate above USD 3,000, maintaining a relatively more resilient price structure. Several tokens bucked the broader trend: M gained more than 46% over the past week, while MERL and ZEC rose by approximately 28% and 19%, respectively, emerging as short-term highlights. On the fundamental side, Polygon completed the Madhugiri hard fork, lifting network throughput by roughly 33%. Meanwhile, Ethereum’s daily fee payments (90-day average) fell below 300 ETH per day, reaching a multi-year low. At the same time, institutions continue to advance Bitcoin-collateralized lending, and regulators have signaled accelerated rulemaking and an expansion of eligible collateral, indicating a marginal improvement in the long-term institutional environment.
In terms of on-chain capital flows, Hyperliquid stood out with net inflows of approximately USD 190 million, reflecting concentrated market positioning toward on-chain perpetuals, high-frequency trading, and capital-efficient infrastructure. New trading paradigms temporarily amplified inflow volumes. By contrast, despite earlier narrative momentum, the newly launched stablecoin chain Stable has seen adoption fall short of expectations; in an environment dominated by established stablecoin networks on mature chains, its future performance will depend on the rollout of genuine applications and real usage scenarios.
Overall, the market remains in a phase characterized by elevated macro uncertainty and structurally driven opportunities. Capital behavior continues to prioritize defensive allocation and efficiency, and conditions for a broad-based recovery in risk appetite have yet to fully materialize. A cautious trading environment with ongoing structural rotation is therefore the more likely near-term outcome.
1. Overview of Price Performance
This analysis groups the top 500 tokens by market capitalization and examines their average price performance between December 2 and December 15. Rather than a synchronized market-wide pullback, the period was marked by clear structural divergence. Higher-ranked assets outperformed: the top 1–100 market-cap cohort recorded an average gain of 4.10%, while the 101–200 cohort rose further to 5.18%, indicating that core and secondary large-cap assets retained relative appeal in capital allocation.
In contrast, the 201–300 cohort declined by 1.38%, making it the only group to post negative returns, highlighting increased pressure on mid-cap tokens amid selective capital retrenchment. Lower-ranked cohorts showed modest recovery, with the 301–400 and 401–500 groups gaining 1.38% and 2.43%, respectively, supported by low base effects and thematic flows.
Taken together, the market exhibited a layered pattern of “large caps leading, mid-caps under pressure, and small caps stabilizing.” Rather than uniformly avoiding risk, capital rotated structurally across liquidity profiles, narratives, and elasticity, with performance dispersion across market-cap segments widening materially.
Based on CoinGecko data, the top 500 tokens by market capitalization were divided into groups of 100 (e.g., ranks 1–100, 101–200, etc.). For each group, price changes from December 2 to December 15, 2025 were measured and averaged to derive the segment’s mean return. The overall average gain (2.34%) represents the simple average of individual returns across the top 500 tokens, unweighted by market cap.
Figure 1: The overall average gain was 2.34%. The market did not experience a synchronized pullback, instead showing pronounced structural divergence.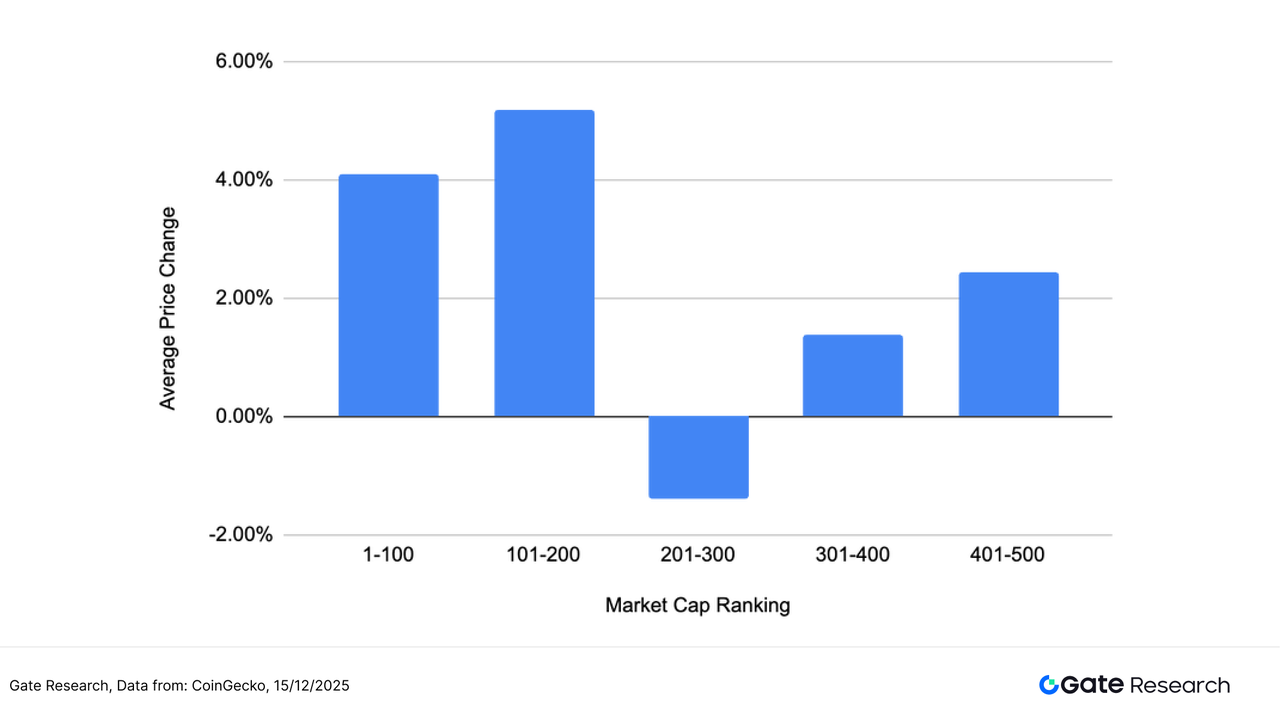
Top Gainers and Losers
Over the past two weeks (December 2–15), crypto markets displayed heightened dispersion amid macro uncertainty and rapid narrative rotation. Individual token gains and losses were significantly amplified, underscoring the dominance of short-term, high-volatility trading strategies.
Top Gainers: High-Beta Thematic Tokens Surge, Led by BEAT and NIGHT
BEAT topped the gainers with a rise of 237.39%. As an application-focused token centered on AI music and virtual content creation, BEAT benefited from sustained AI narrative momentum combined with a small market capitalization, attracting concentrated short-term capital and amplifying price elasticity.
NIGHT (+173.35%) ranked second. As the native token of the Midnight Network ecosystem, NIGHT emphasizes a “privacy-by-default with selective disclosure” model aligned with regulatory compliance, targeting use cases in finance, identity, and data sharing. Increasing clarity around its mainnet and roadmap, alongside a phase of market re-rating for privacy computing and compliant infrastructure, supported its strong rebound.
LUNA, JELLYJELLY, and several others also posted gains exceeding 100%, reflecting a broader preference for small-cap, narrative-driven, high-volatility assets.
Top Losers: High-Risk Assets See Sharp Pullbacks
On the downside, SAD and LGCT led declines, indicating that tokens with weaker liquidity or insufficient fundamental support were the first to face selling pressure as volatility increased. TOMI, H, APEPE, and MON also fell by 30%–50%, largely concentrated among assets experiencing narrative fade, limited market depth, or excessive prior speculation. This underscores a phase of active risk reduction in high-beta exposures.
Overall, the gainers and losers list reflects a classic “strong get stronger, weak are rapidly flushed out” dynamic. Capital has not exited the market wholesale; instead, it has selectively targeted high-elasticity themes while quickly reducing exposure to assets lacking sustained narratives or liquidity support. In the near term, small-cap tokens with clear themes, strong community consensus, and active trading may remain intermittently active, but overall risk appetite remains cautious, and structural dispersion is likely to persist.
Figure 2: BEAT ranked first with a gain of 237.39%, driven primarily by sustained AI narrative momentum and the high elasticity associated with a small market capitalization, which attracted concentrated short-term inflows and significantly magnified price volatility.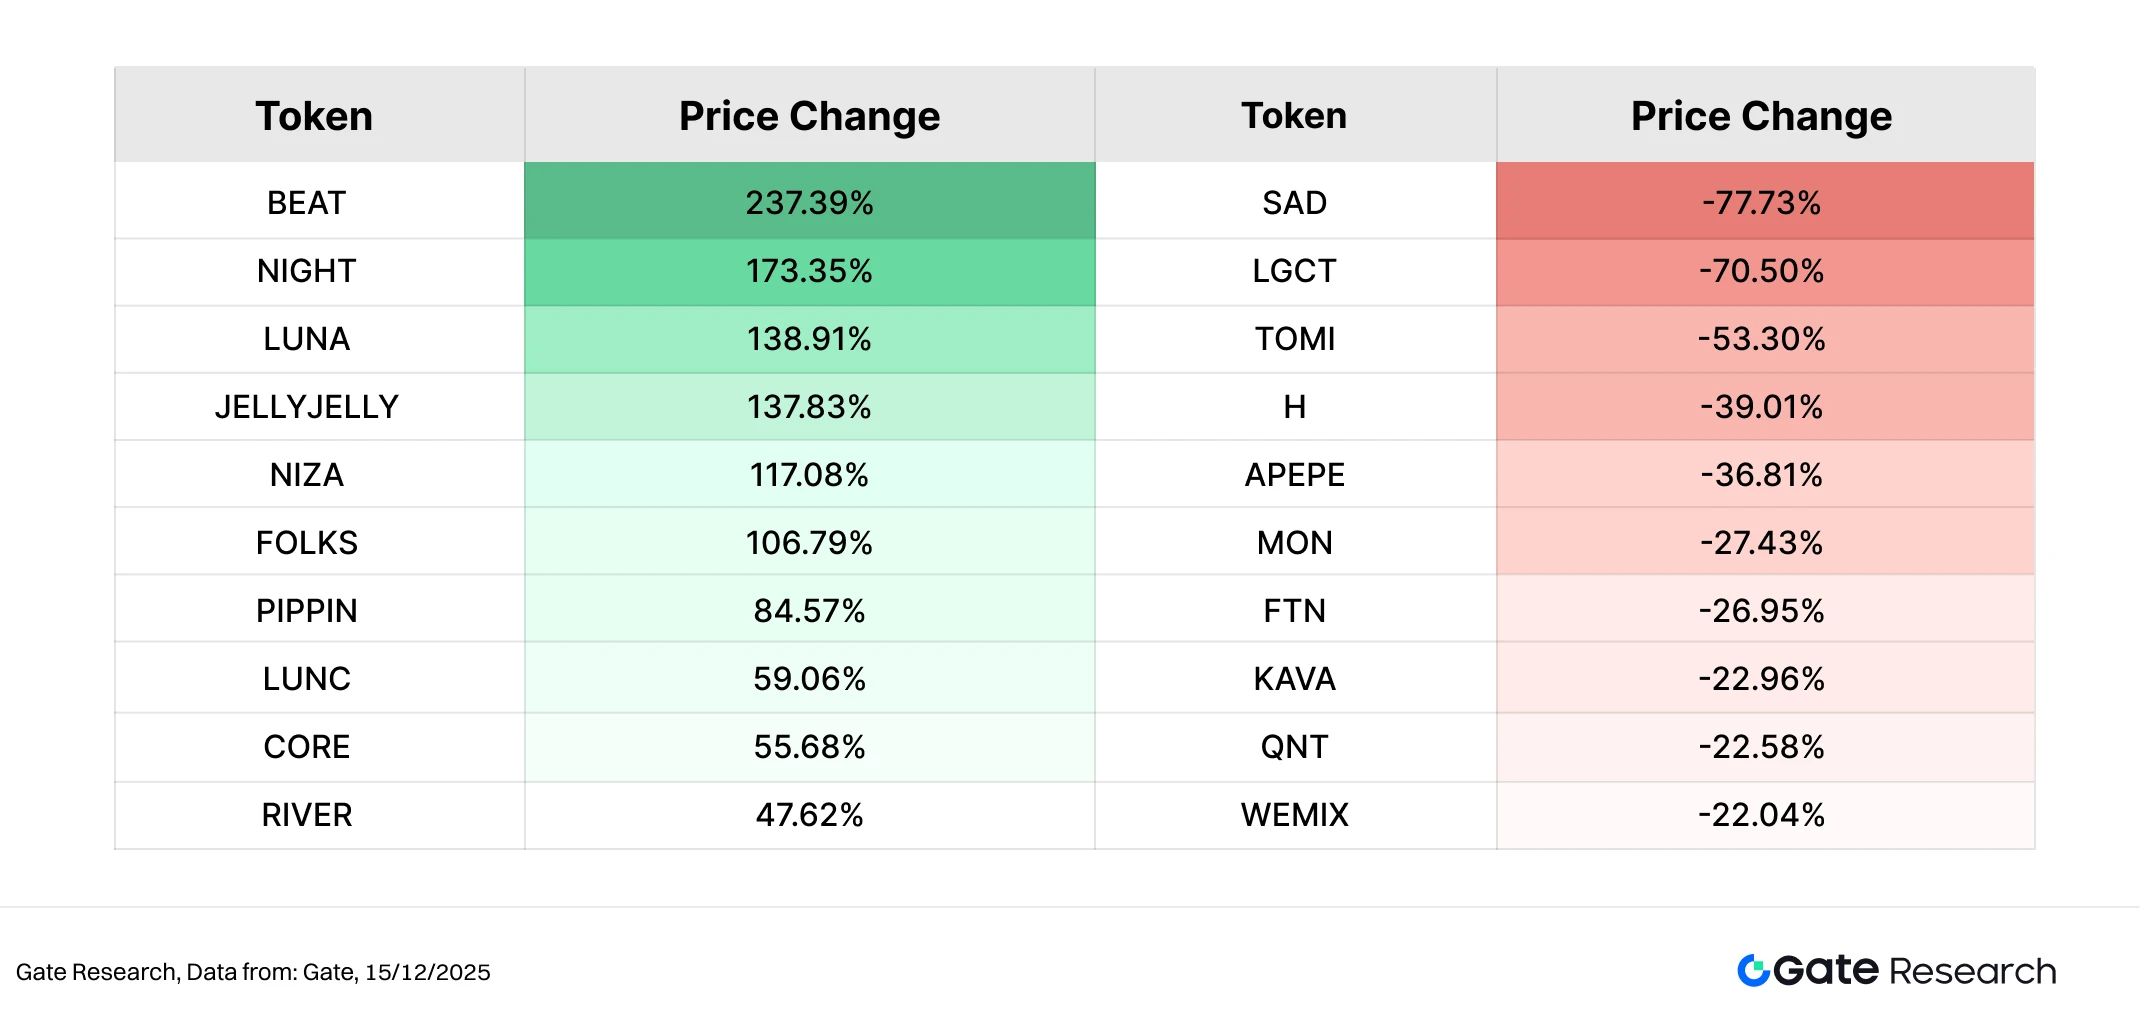
Relationship Between Market Cap Ranking and Price Performance
To analyze the structural characteristics of token performance during this market cycle, this report plots a scatter distribution of the top 500 tokens by market capitalization. The horizontal axis represents market-cap ranking (with larger-cap assets on the left), while the vertical axis shows price performance from November 11 to November 24. Each dot represents one token, with green indicating gains and red indicating declines.
Overall, the number of declining tokens far exceeds those that rose. Most assets are clustered in the –10% to –25% range, suggesting that under macro pressure and fading sentiment, the market remains in a weak recovery phase. Tokens with significant gains are relatively scarce and are predominantly concentrated in the 200–500 market-cap range—indicating that capital favored high-elasticity, narrative-driven assets rather than more stable large-cap coins.
Among the outperformers, BEAT (+436%), AVICI (+67.93%), and TEL (+66.47%) stand out as the three most notable gainers, collectively reflecting an “extreme strength + narrative-driven” pattern. All three are positioned in the mid- to lower-cap segments, reinforcing this cycle’s theme that “small-cap narrative tokens dominated the upside.”
Conversely, major decliners such as SOON, COAI, USELESS, and PLUME fall mostly within the long-tail segment (beyond rank 250), with broad drawdowns of –50% to –70%. These assets exhibit classic “post-hype unwinding + capital exit” behavior. This segment also saw the most intense volatility and contributed significantly to the downward pressure in this market cycle.
Overall, price dynamics during this period can be summarized as: “Large caps remained relatively stable, while mid- and small-cap tokens experienced sharp divergence; strength was highly concentrated, while weakness was broadly distributed.” Capital continued to favor short-term sentiment-driven assets in a choppy environment, amplifying volatility among mid- to lower-cap tokens and reflecting a market where risk appetite remains dominated by short-term trading activity.
Figure 3: The scatter distribution of price performance among the top 500 tokens shows that gainers are concentrated in mid- to lower-cap ranges, while decliners are broadly distributed—highlighting clear structural divergence.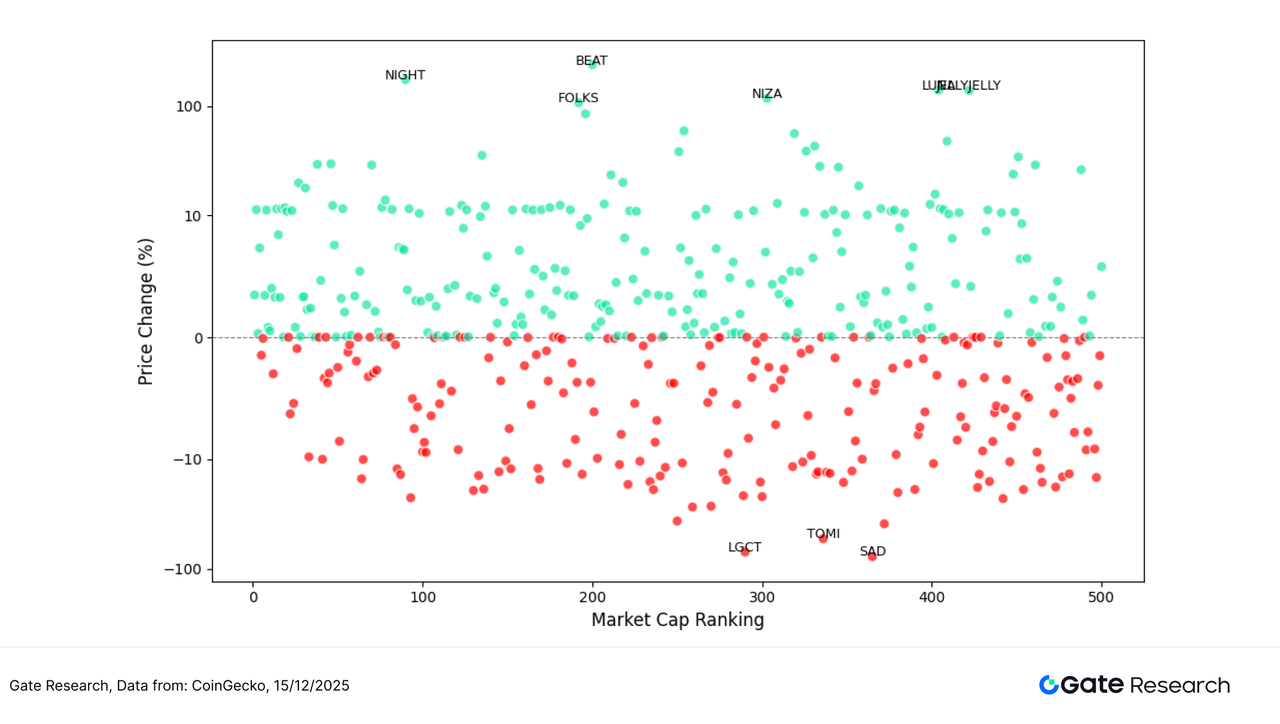
Top 100 Market Cap Leaders
During the current phase of market consolidation, the top 100 tokens by market capitalization continued to exhibit a divergent pattern. Major assets came under broad pressure, while a small number of projects with clear narratives or structural support still generated relative outperformance.
On the upside, NIGHT (+173.35%) clearly led the top-100 cohort, standing out as one of the few large-cap tokens to post outsized gains. This performance reflects concentrated capital interest in privacy computing and compliance-oriented blockchain narratives during the current rebound phase. M (+29.58%) and MNT (+29.25%) followed with comparatively resilient performance, while HASH (+28.84%) and ZEC (+19.81%) also delivered double-digit gains, indicating that assets linked to hash power, infrastructure, and privacy retained a degree of defensive demand amid heightened risk aversion. Overall, the number of advancing tokens within the top 100 remained limited, but gains were highly concentrated, reinforcing a pattern of “selective strength rather than broad-based participation.”
On the downside, QNT (-22.58%) recorded the steepest decline, with ICP (-15.14%), KAS (-13.85%), and APT (-12.30%) also experiencing notable pullbacks. These declines were concentrated among assets that previously exhibited high-beta characteristics or relatively elevated valuations, which became more vulnerable as risk appetite cooled and capital conditions tightened.
In summary, the top-100 segment displayed a structure of “isolated narrative-driven breakouts alongside broader retracement.” Capital has not exited major assets wholesale; instead, it has been selectively allocated to tokens with differentiated positioning and medium-term fundamental support. This underscores a market environment still defined by cautious positioning and structurally selective allocation.
Figure 4: Among the top 100 tokens by market capitalization, NIGHT led gains, highlighting concentrated capital interest in privacy computing and compliance-oriented blockchain narratives during the current phase of market repair.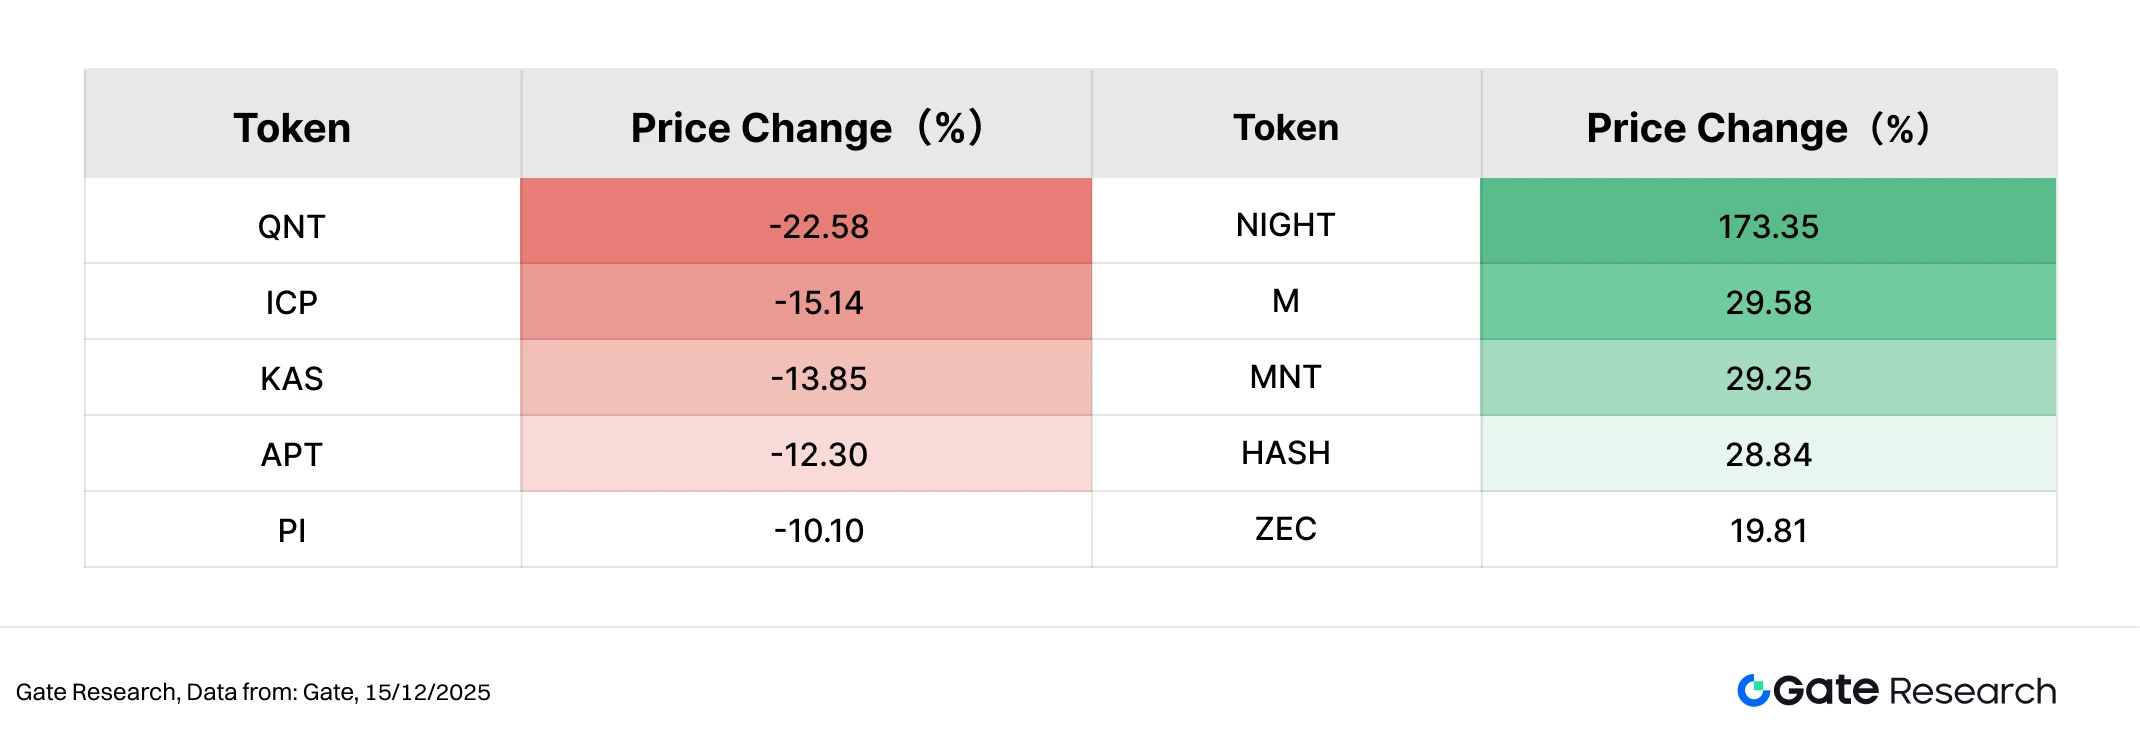
2. Volume Surge Analysis
Trading Volume Growth Analysis
Beyond price rebounds, a closer examination of trading volume dynamics provides clearer insight into the structure of capital participation. During this period, volume expansion was concentrated primarily among mid- to small-cap tokens in the market-cap ranking range of 200–400, exhibiting a pattern of “rising volume with clearly differentiated rebound outcomes.”
Among them, LUNA stood out with a 138.91× increase in trading volume alongside a 24.58% price rebound, representing the most pronounced case of volume–price resonance in this period. This suggests concentrated short-term capital deployment at lower price levels, targeting rebound-driven trading opportunities. CONSCIOUS also demonstrated a relatively healthy “volume–price alignment,” with trading volume rising 8.60× and price rebounding 19.05%, reflecting a simultaneous recovery in market attention and buying support.
By contrast, LUNC and AXL recorded substantial volume expansion of 59.06× and 27.53×, respectively, but delivered more limited price rebounds of only 10.40% and 5.95%. This indicates that increased trading activity was driven more by short-term turnover and liquidity replenishment rather than the entry of trend-following capital. VSN showed only modest increases in both volume and price, remaining largely in a tentative repair phase.
Overall, tokens experiencing significant volume expansion during this period were predominantly mid- to lower-market-cap assets. In most cases, rising volume was fueled by short-term trading and rebound strategies, while tokens achieving a clear combination of “volume expansion plus meaningful price recovery” remained relatively few. This underscores that current capital behavior continues to favor tactical, phase-driven opportunities rather than the onset of a broad-based trend, and that risk appetite has yet to show a substantive improvement.
Figure 5: Tokens such as LUNA and CONSCIOUS recorded significant volume expansion during this period. While some achieved synchronized volume–price rebounds, others exhibited elevated volume with limited price gains, indicating that capital activity remains dominated by short-term trading and liquidity-driven strategies, with trend-oriented buying yet to be firmly established.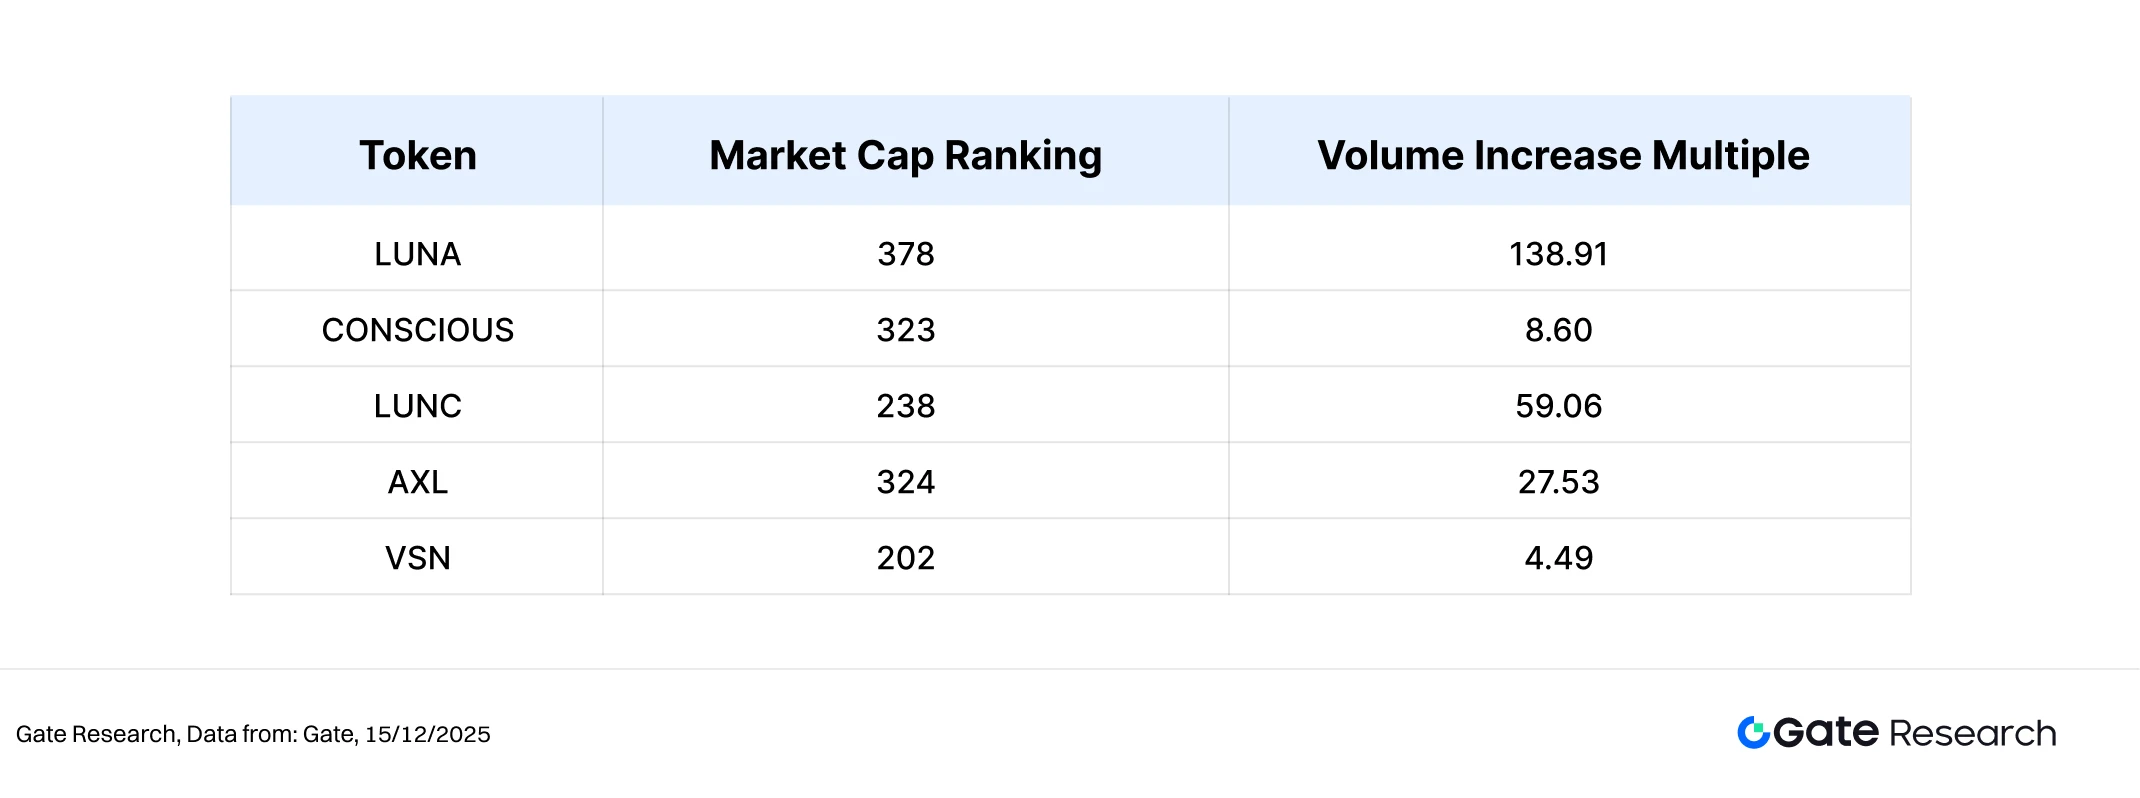
Volume-Price Relationship Analysis
To further characterize the relationship between volume expansion and price response, this analysis cross-examines trading volume growth multiples against concurrent price performance. In the chart, the x-axis represents the volume expansion multiple, while the y-axis denotes price change. Key thresholds (such as a fivefold increase in trading volume and a 20% price gain) are used to delineate different market structure regimes.
From the overall distribution, most tokens remain clustered in the low–volume-expansion, low–price-volatility region, indicating that aggregate trading activity is still subdued and that incremental capital has yet to return in a systematic manner. At the same time, the number of declining data points slightly exceeds that of advancing ones, suggesting that market sentiment remains cautious and that the market as a whole is still in a consolidation-and-repair phase.
In the quadrant where both volume expansion and price appreciation occur, only a small number of tokens stand out. LUNA is the most notable example, recording a price rebound of over 100% alongside a more than 100× surge in trading volume, forming a textbook “high volume + strong rebound” pattern. This indicates concentrated short-term capital deployment at lower price levels and the formation of temporary market consensus. LUNC also exhibited substantial volume expansion and double-digit gains, though with lower price elasticity than LUNA, reflecting more of a rebound driven by high turnover rather than a decisive directional move.
By contrast, tokens such as CONSCIOUS and AXL experienced significant increases in trading volume, yet price gains remained in the 10%–20% range. This suggests that capital participation was largely exploratory or oriented toward short-term trading rather than trend formation. Other assets, including CETH and PZETH, saw extreme volume expansion with only modest price increases, reflecting their characteristics as staking, derivative, or structurally oriented assets. In these cases, elevated trading volumes were more likely driven by rebalancing, arbitrage, or on-chain liquidity demand rather than directional buying pressure.
Overall, the market during this period exhibits a clear pattern of “volume–price stratification.” Tokens achieving genuine volume–price resonance are rare, and for most assets, increased trading activity did not translate into meaningful price appreciation. This indicates that capital behavior remains dominated by short-term trading and liquidity operations, while broad risk appetite and trend-following capital have yet to fully return.
Figure 6: The scatter distribution of trading volume growth multiples versus price performance shows that volume expansion does not necessarily correspond to price appreciation. Only a limited number of tokens exhibit true volume–price resonance, while the broader market remains in a phase of consolidation and structural trading.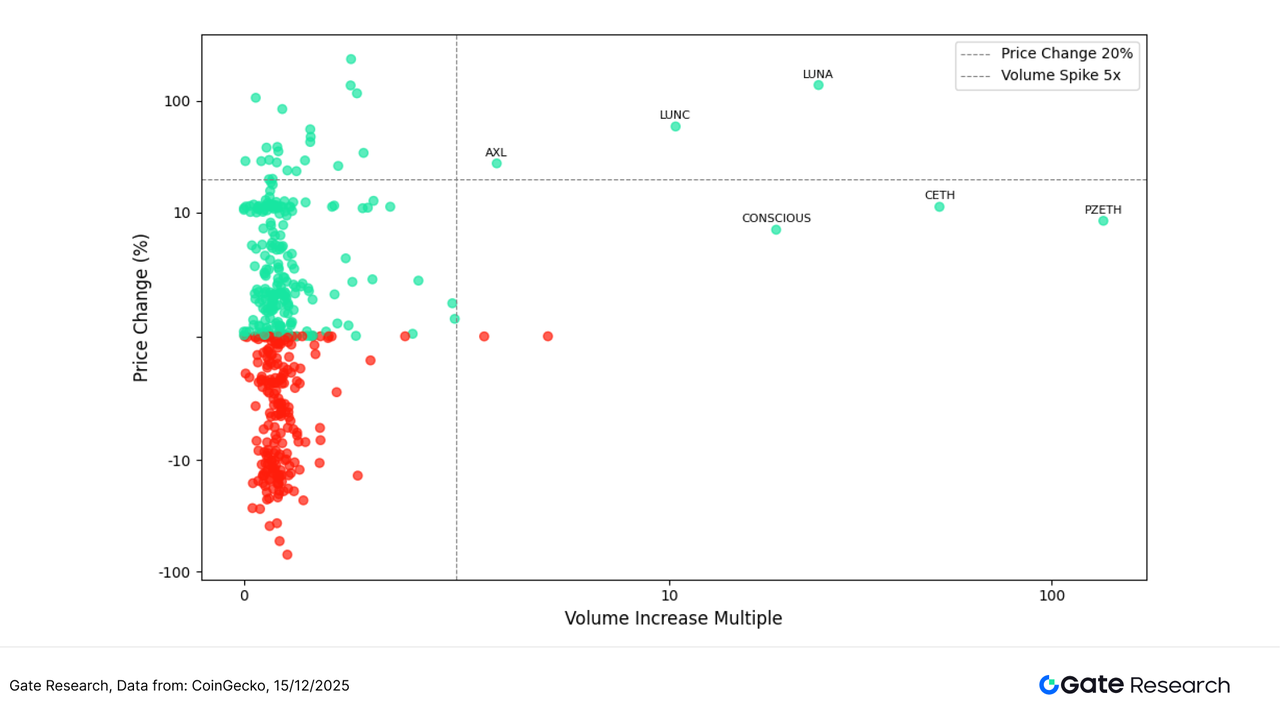
Correlation Analysis
Following the examination of the linkage between trading volume and price performance, this report further analyzes their systematic relationship from a statistical perspective. By using “trading volume growth rate divided by market capitalization” as a proxy for relative capital activity, and calculating its correlation with price returns, the analysis seeks to identify token types that are more susceptible to capital-driven movements. In the chart, circle size represents the intensity of relative capital activity: larger circles indicate stronger volume expansion per unit of market cap and, correspondingly, higher price sensitivity to capital inflows.
As shown in the figure, the majority of tokens exhibit correlation coefficients concentrated in the 0.65–0.85 range. This suggests that in the current market, price fluctuations remain meaningfully influenced by trading activity, but without a uniformly strong synchronization across assets. Such dispersion indicates that capital behavior has begun to stratify rather than moving in a fully homogeneous manner.
In the high-correlation segment, tokens such as STCUSD, WFLR, WGLUE, and XCN show correlation coefficients close to or exceeding 0.85–0.90, indicating that their price movements are highly aligned with changes in trading volume. These assets typically feature strong trading orientation, high liquidity dependence, or clearly defined narrative drivers, making their prices more prone to rapid upside or downside moves during periods of volume expansion. They are representative of high-beta, sentiment-sensitive tokens.
Tokens with correlations in the 0.75–0.85 range display a pattern of “volume-responsive but amplitude-contained” behavior. Their prices are influenced by capital flows while still retaining some degree of fundamental or functional support. By contrast, lower-correlation assets such as WAL, BARD, CTC, and QTUM show limited sensitivity to changes in trading volume and are more strongly driven by medium- to long-term demand and ecosystem development, giving them relatively defensive characteristics. Overall, the correlation distribution in this period reveals a clear structural stratification: high-correlation assets are primarily trading- and sentiment-driven, mid-correlation assets balance capital flows and underlying logic, and low-correlation assets exhibit greater independence. This suggests that the market has entered a phase of more granular, attribute-based pricing.
Figure 7: The correlation between relative trading activity and price performance shows that trading- and sentiment-driven tokens exhibit significantly higher correlations, while infrastructure and mature-ecosystem tokens display lower sensitivity to volume changes, highlighting a clearly stratified market structure.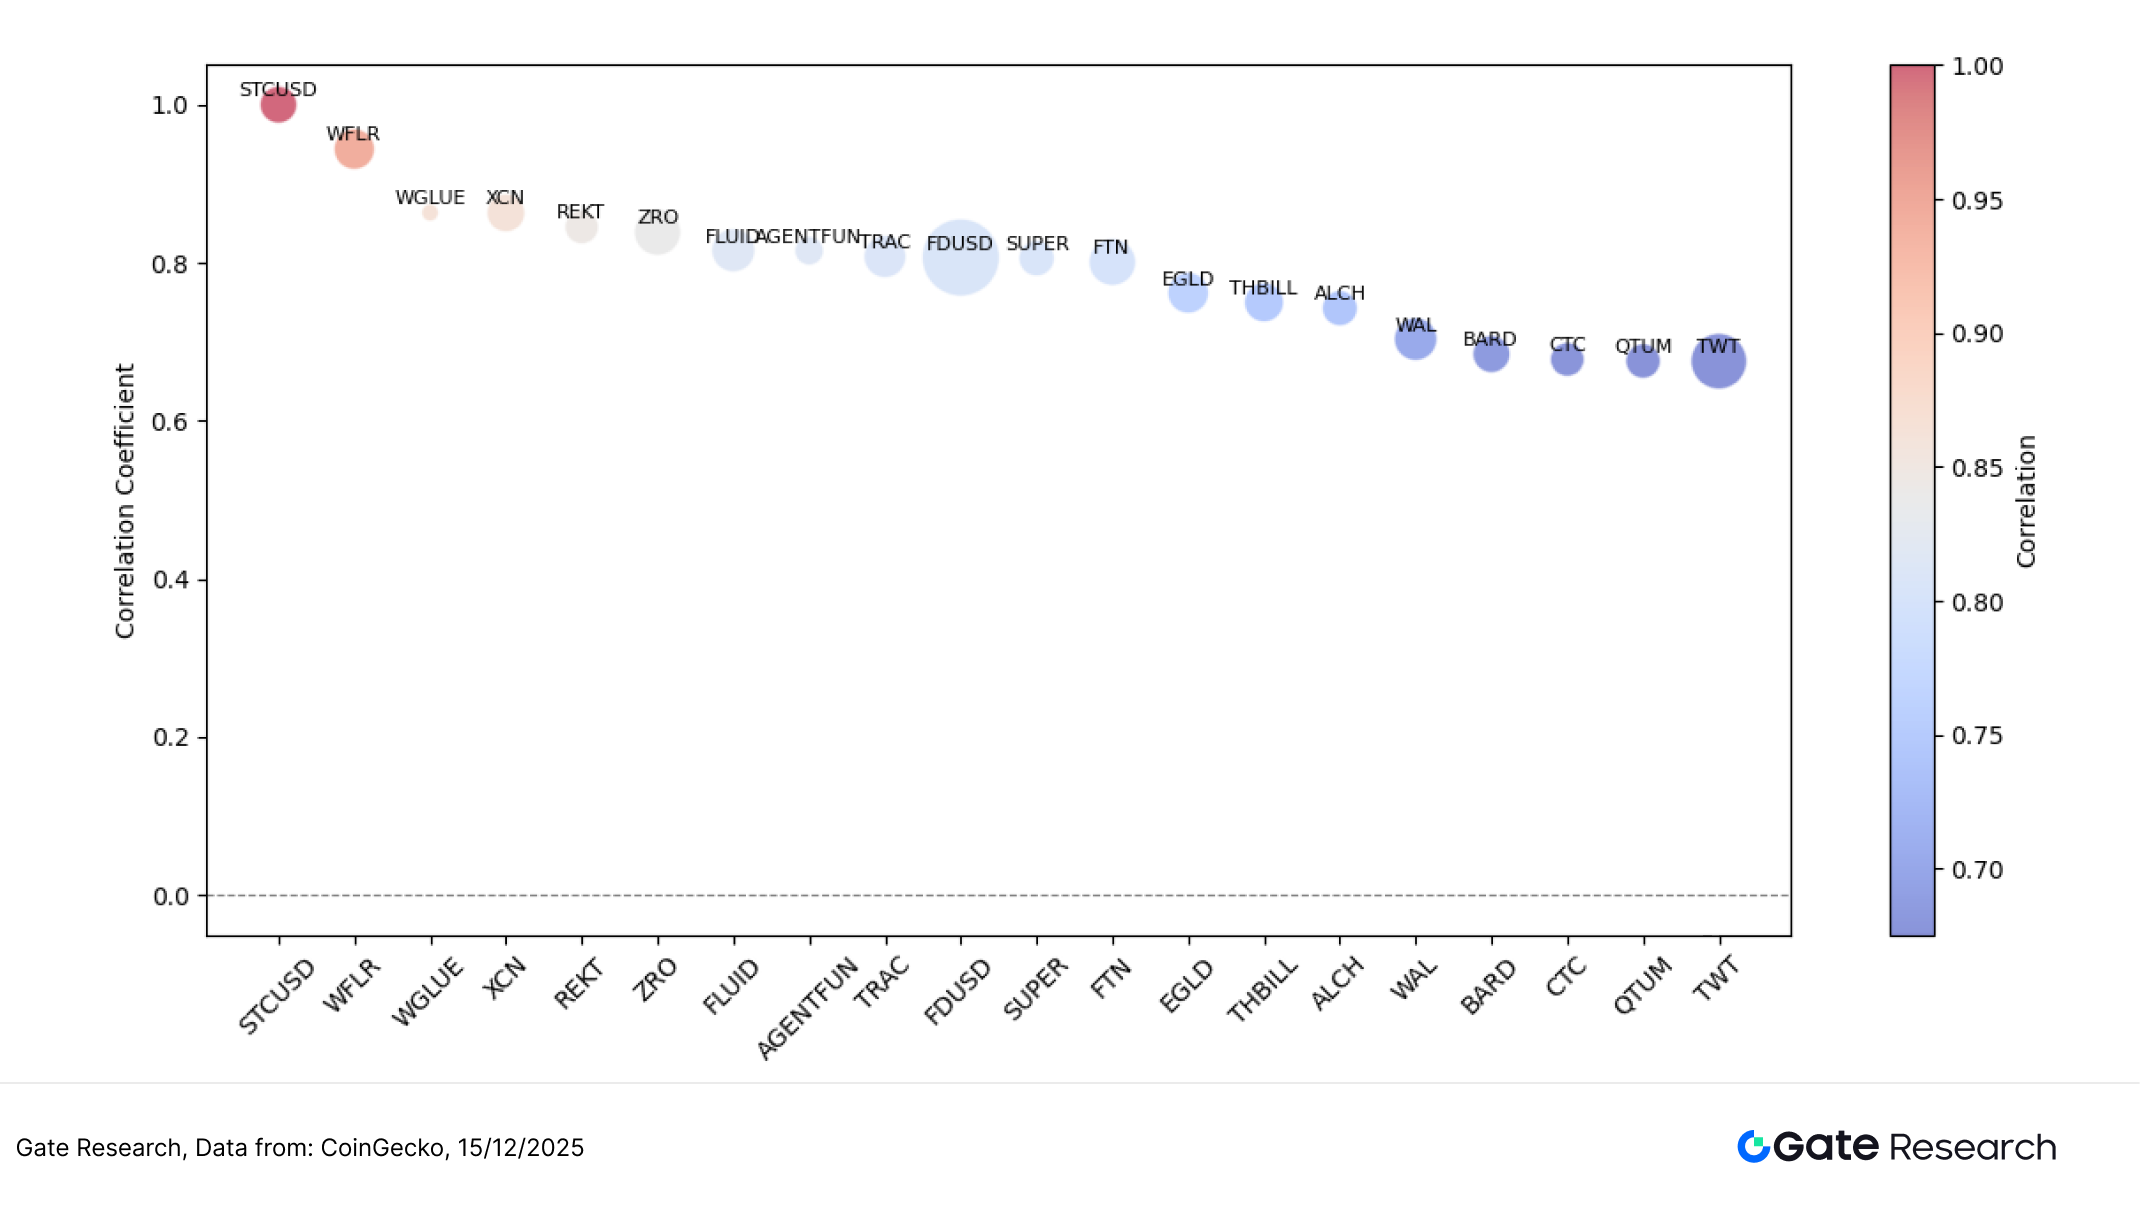
In this market cycle, the crypto market has continued to exhibit a pattern of structural rotation under the pressure of macroeconomic uncertainty. The top 500 tokens by market capitalization recorded a mild average gain of approximately 2.34%, but performance dispersion was pronounced. Large-cap assets showed relative resilience, mid-cap segments came under pressure, and smaller-cap tokens at the tail end displayed early signs of recovery. On the thematic front, high-elasticity assets experienced concentrated rallies, with tokens such as BEAT, NIGHT, and LUNA strengthening markedly on the back of AI applications, privacy computing narratives, and high-volatility trading dynamics. By contrast, previously weak-consensus or high-beta assets such as SAD, LGCT, and TOMI underwent rapid pullbacks. While trading volume expanded significantly among some mid- and small-cap tokens, the overall pattern remained one of “divergent volume expansion,” with trend-level consensus yet to form.
Beyond market price action, several potential airdrop projects continue to make progress, spanning popular sectors such as AI, Layer 2, social incentive systems, and identity verification. By timing participation effectively and maintaining consistent engagement, users may be able to secure early positioning in a range-bound market and capture token incentives or airdrop eligibility. The following section outlines four projects worth close attention, along with their participation pathways, to support a more systematic approach to capturing Web3 opportunity.
Airdrop Highlights
This report highlights four airdrop and incentive-driven projects worth close attention between December 2 and December 15, 2025: Tashi Network (a node-based XP farming network within the Solana ecosystem), Pharos (an incentive-driven testnet blockchain that has progressed to Phase 3), Chainers (a community task–centric Loyalty Program), and Altura (a Mindshare-based content incentive initiative built on Cookie.fun).
All of these projects are currently in early-stage or incentive activation phases. Users can accumulate contribution records by deploying nodes, participating in testnet interactions, completing social and community tasks, or engaging in content creation, thereby positioning themselves in advance for potential future airdrops, token distributions, or reward settlements.
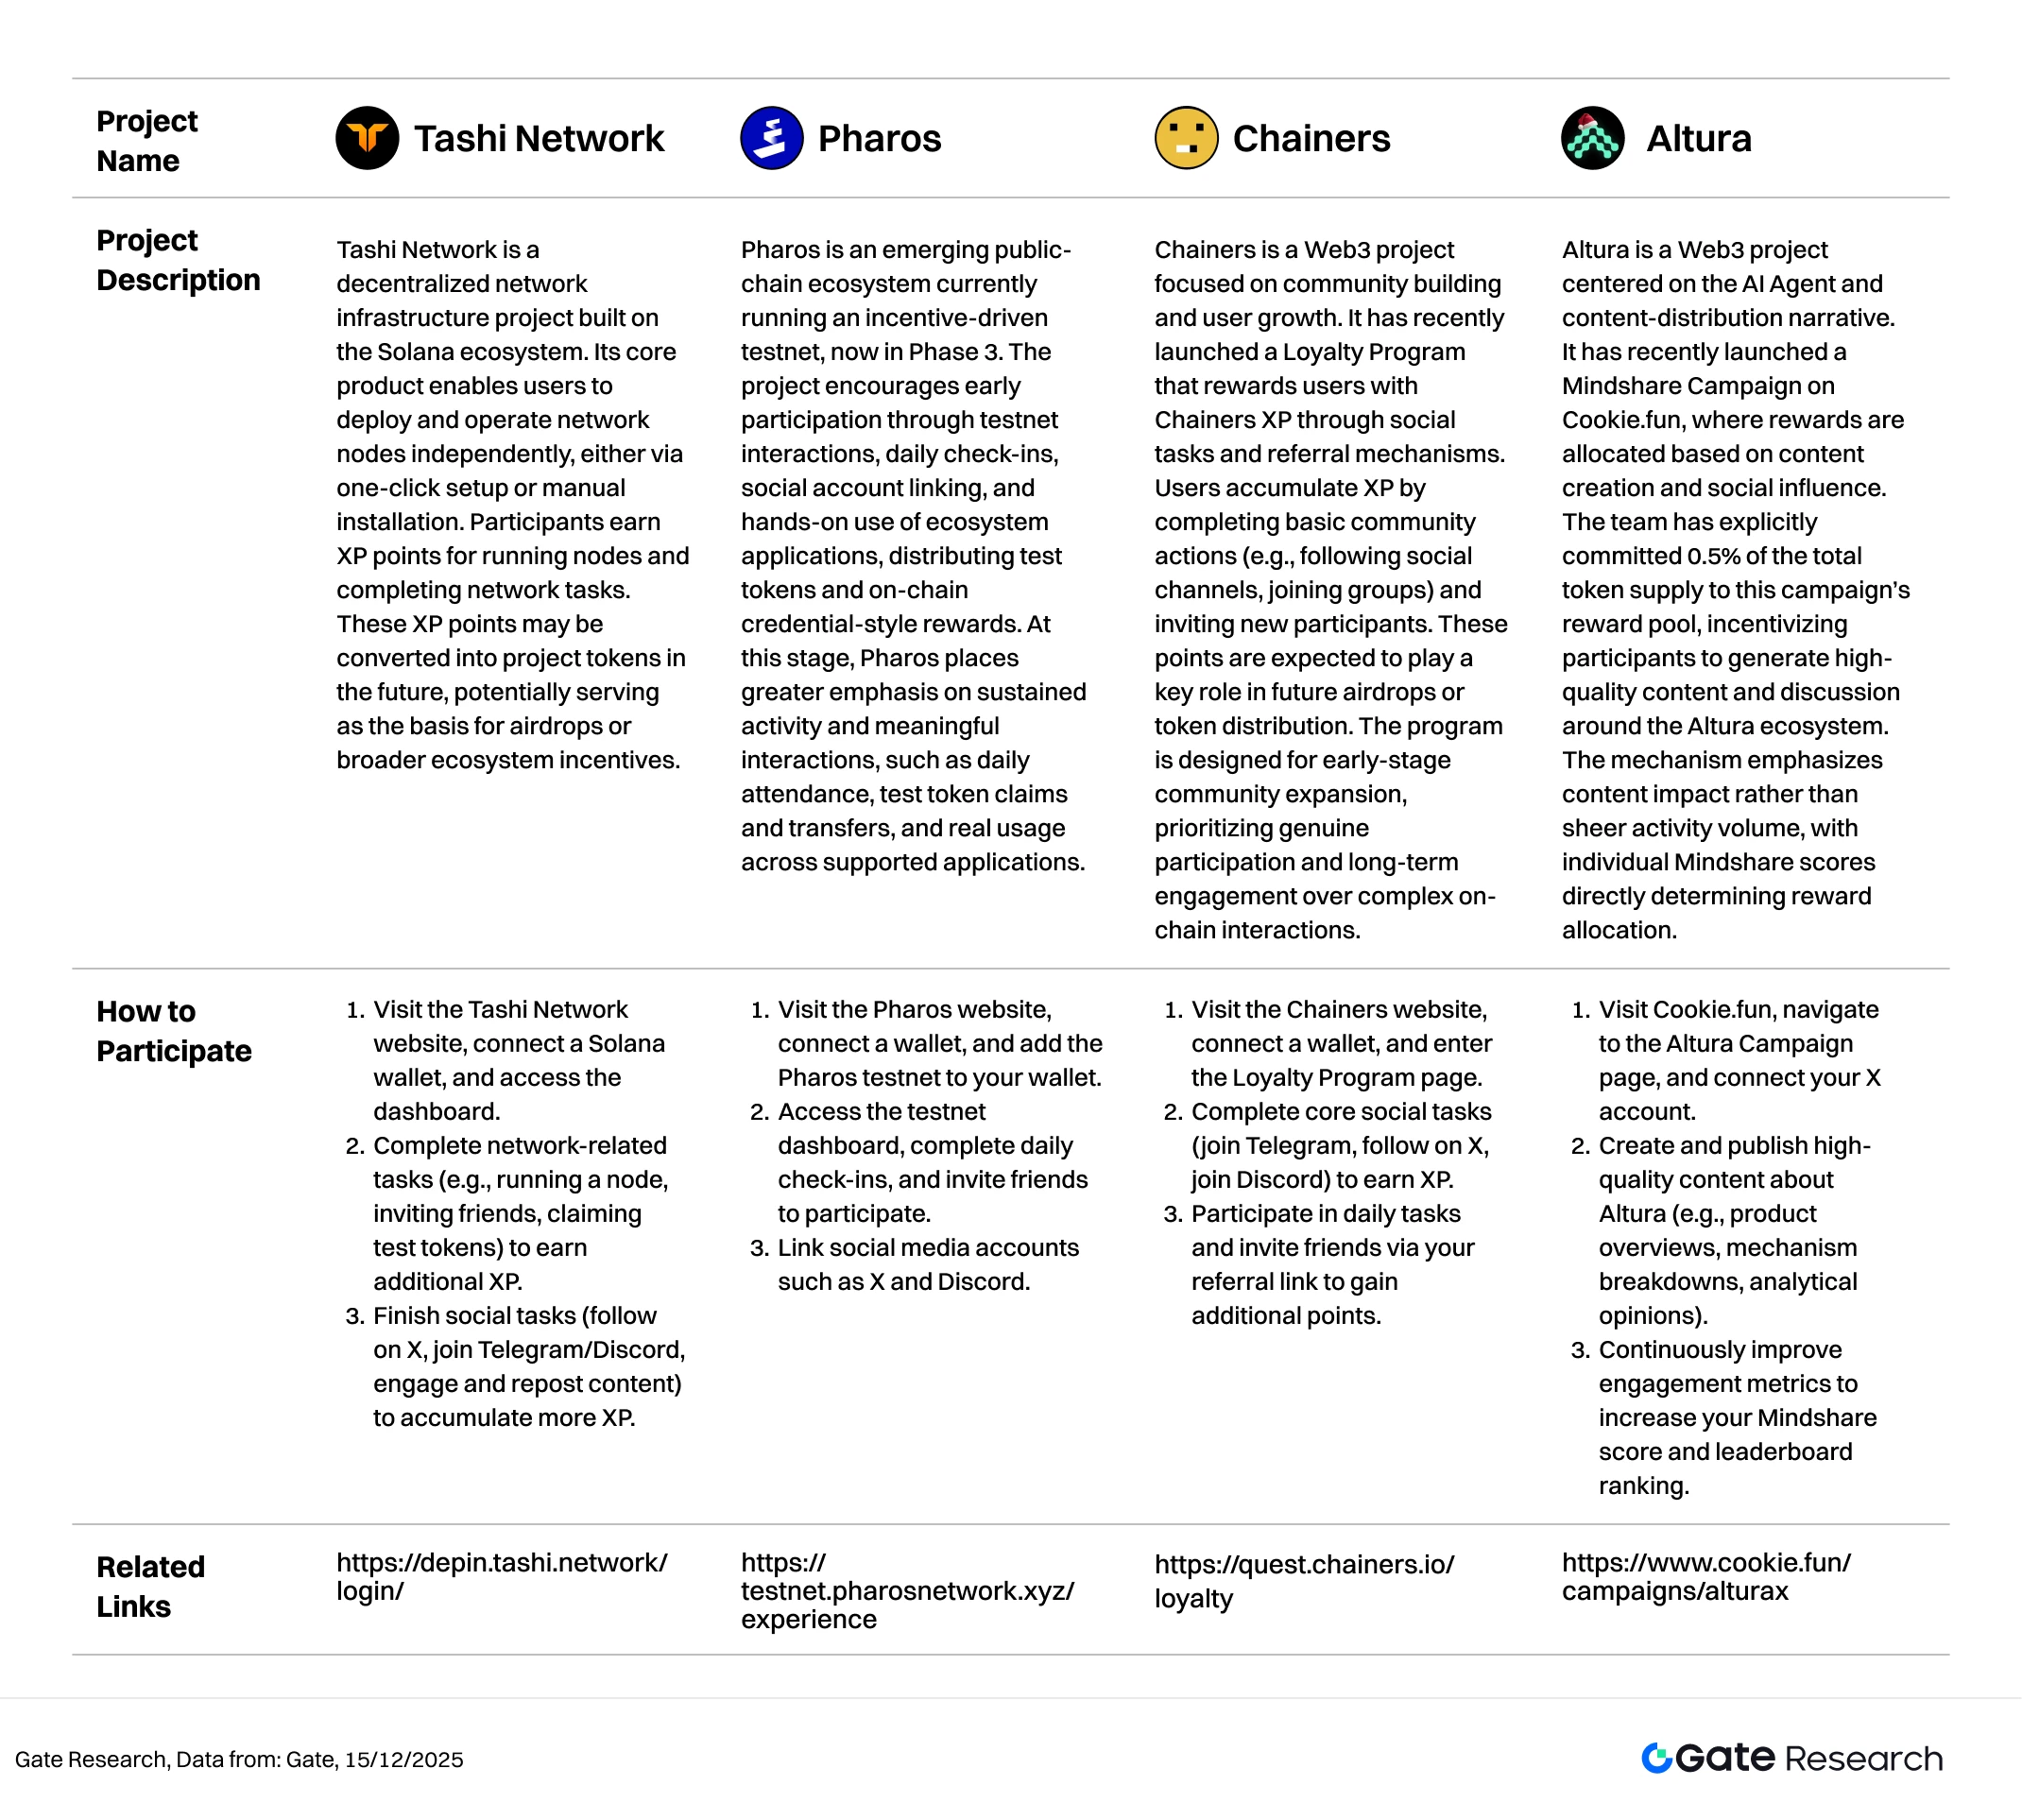
Tashi Network
Tashi Network is a decentralized network infrastructure project built on the Solana ecosystem. Its core product enables users to deploy and operate network nodes independently, either via one-click setup or manual installation. Participants earn XP points for running nodes and completing network tasks. These XP points may be converted into project tokens in the future, potentially serving as the basis for airdrops or broader ecosystem incentives.【2】
How to Participate:
- Visit the Tashi Network website, connect a Solana wallet, and access the dashboard.
- Complete network-related tasks (e.g., running a node, inviting friends, claiming test tokens) to earn additional XP.
- Finish social tasks (follow on X, join Telegram/Discord, engage and repost content) to accumulate more XP.
Pharos
Pharos is an emerging public-chain ecosystem currently running an incentive-driven testnet, now in Phase 3. The project encourages early participation through testnet interactions, daily check-ins, social account linking, and hands-on use of ecosystem applications, distributing test tokens and on-chain credential-style rewards. At this stage, Pharos places greater emphasis on sustained activity and meaningful interactions, such as daily attendance, test token claims and transfers, and real usage across supported applications.【3】
How to Participate:
- Visit the Pharos website, connect a wallet, and add the Pharos testnet to your wallet.
- Access the testnet dashboard, complete daily check-ins, and invite friends to participate.
- Link social media accounts such as X and Discord.
Chainers
Chainers is a Web3 project focused on community building and user growth. It has recently launched a Loyalty Program that rewards users with Chainers XP through social tasks and referral mechanisms. Users accumulate XP by completing basic community actions (e.g., following social channels, joining groups) and inviting new participants. These points are expected to play a key role in future airdrops or token distribution. The program is designed for early-stage community expansion, prioritizing genuine participation and long-term engagement over complex on-chain interactions.【4】
How to Participate:
- Visit the Chainers website, connect a wallet, and enter the Loyalty Program page.
- Complete core social tasks (join Telegram, follow on X, join Discord) to earn XP.
- Participate in daily tasks and invite friends via your referral link to gain additional points.
Altura
Altura is a Web3 project centered on the AI Agent and content-distribution narrative. It has recently launched a Mindshare Campaign on Cookie.fun, where rewards are allocated based on content creation and social influence. The team has explicitly committed 0.5% of the total token supply to this campaign’s reward pool, incentivizing participants to generate high-quality content and discussion around the Altura ecosystem. The mechanism emphasizes content impact rather than sheer activity volume, with individual Mindshare scores directly determining reward allocation.【5】
How to Participate:
- Visit Cookie.fun, navigate to the Altura Campaign page, and connect your X account.
- Create and publish high-quality content about Altura (e.g., product overviews, mechanism breakdowns, analytical opinions).
- Continuously improve engagement metrics to increase your Mindshare score and leaderboard ranking.
Reminder
Airdrop plans and participation methods are subject to change at any time. Therefore, it is recommended that users follow the official channels of the above projects for the latest updates. Additionally, users should exercise caution, be aware of the risks, and conduct thorough research before participating. Gate does not guarantee the distribution of subsequent airdrop rewards.
Conclusion
Reviewing the period from December 2 to December 15, 2025, although the Fed delivered a rate cut as expected, policy divergences and expectations of a pause continued to suppress risk appetite, leaving BTC and ETH in range-bound consolidation. On the on-chain front, capital flows concentrated clearly toward high-efficiency derivatives and trading infrastructure, with Hyperliquid leading in net inflows, reflecting sustained market conviction in on-chain perpetuals and high-frequency trading use cases. From a thematic perspective, capital gravitated toward high-elasticity segments: assets tied to AI applications, privacy computing, and high-volatility trading dynamics performed notably well, with BEAT, NIGHT, and LUNA posting significant gains. By contrast, newer Layer 1 and stablecoin narratives underdelivered relative to prior expectations.
Volume–price dynamics show that only a small number of tokens—such as LUNA and CONSCIOUS—achieved true volume–price resonance, while most tokens with elevated trading activity saw limited price appreciation. This indicates that capital behavior remains dominated by short-term rebound trades and liquidity-driven strategies. Correlation analysis further suggests that high-beta, trading-oriented tokens are the most sensitive to shifts in market sentiment, whereas infrastructure assets and tokens tied to more mature ecosystems exhibit relatively independent price behavior.
In addition, the projects tracked in this period—Tashi Network, Pharos, Chainers, and Altura—are all in clearly defined incentive execution phases. Their respective focuses include node network expansion, testnet activity accumulation, community-driven growth and loyalty point systems, and content distribution combined with mindshare competition. Overall, these projects feature well-defined incentive pathways and relatively manageable participation thresholds. Users can incrementally increase their XP, points, or mindshare weight by running nodes, completing daily check-ins, engaging in on-chain interactions, inviting new participants, or publishing content, thereby enhancing their potential allocation in future airdrops and reward distributions.
Reference:
- CoinGecko, https://www.coingecko.com/
- Tashi Network, https://depin.tashi.network/login/
- Pharos, https://testnet.pharosnetwork.xyz/experience
- Chainers, https://quest.chainers.io/loyalty
- Altura, https://www.cookie.fun/campaigns/alturax
Gate Research is a comprehensive blockchain and cryptocurrency research platform that provides deep content for readers, including technical analysis, market insights, industry research, trend forecasting, and macroeconomic policy analysis.
Disclaimer
Investing in cryptocurrency markets involves high risk. Users are advised to conduct their own research and fully understand the nature of the assets and products before making any investment decisions. Gate is not responsible for any losses or damages arising from such decisions.
Share
Content


Related Articles

12 Best Sites to Hunt Crypto Airdrops in 2025

Top 20 Crypto Airdrops in 2025

Gate Research: 2024 Cryptocurrency Market Review and 2025 Trend Forecast
Perpetual Contract Funding Rate Arbitrage Strategy in 2025

Gate Research: BTC Breaks $100K Milestone, November Crypto Trading Volume Exceeds $10 Trillion For First Time