GregMiller
$ETH 強気の逆転構造 🔥
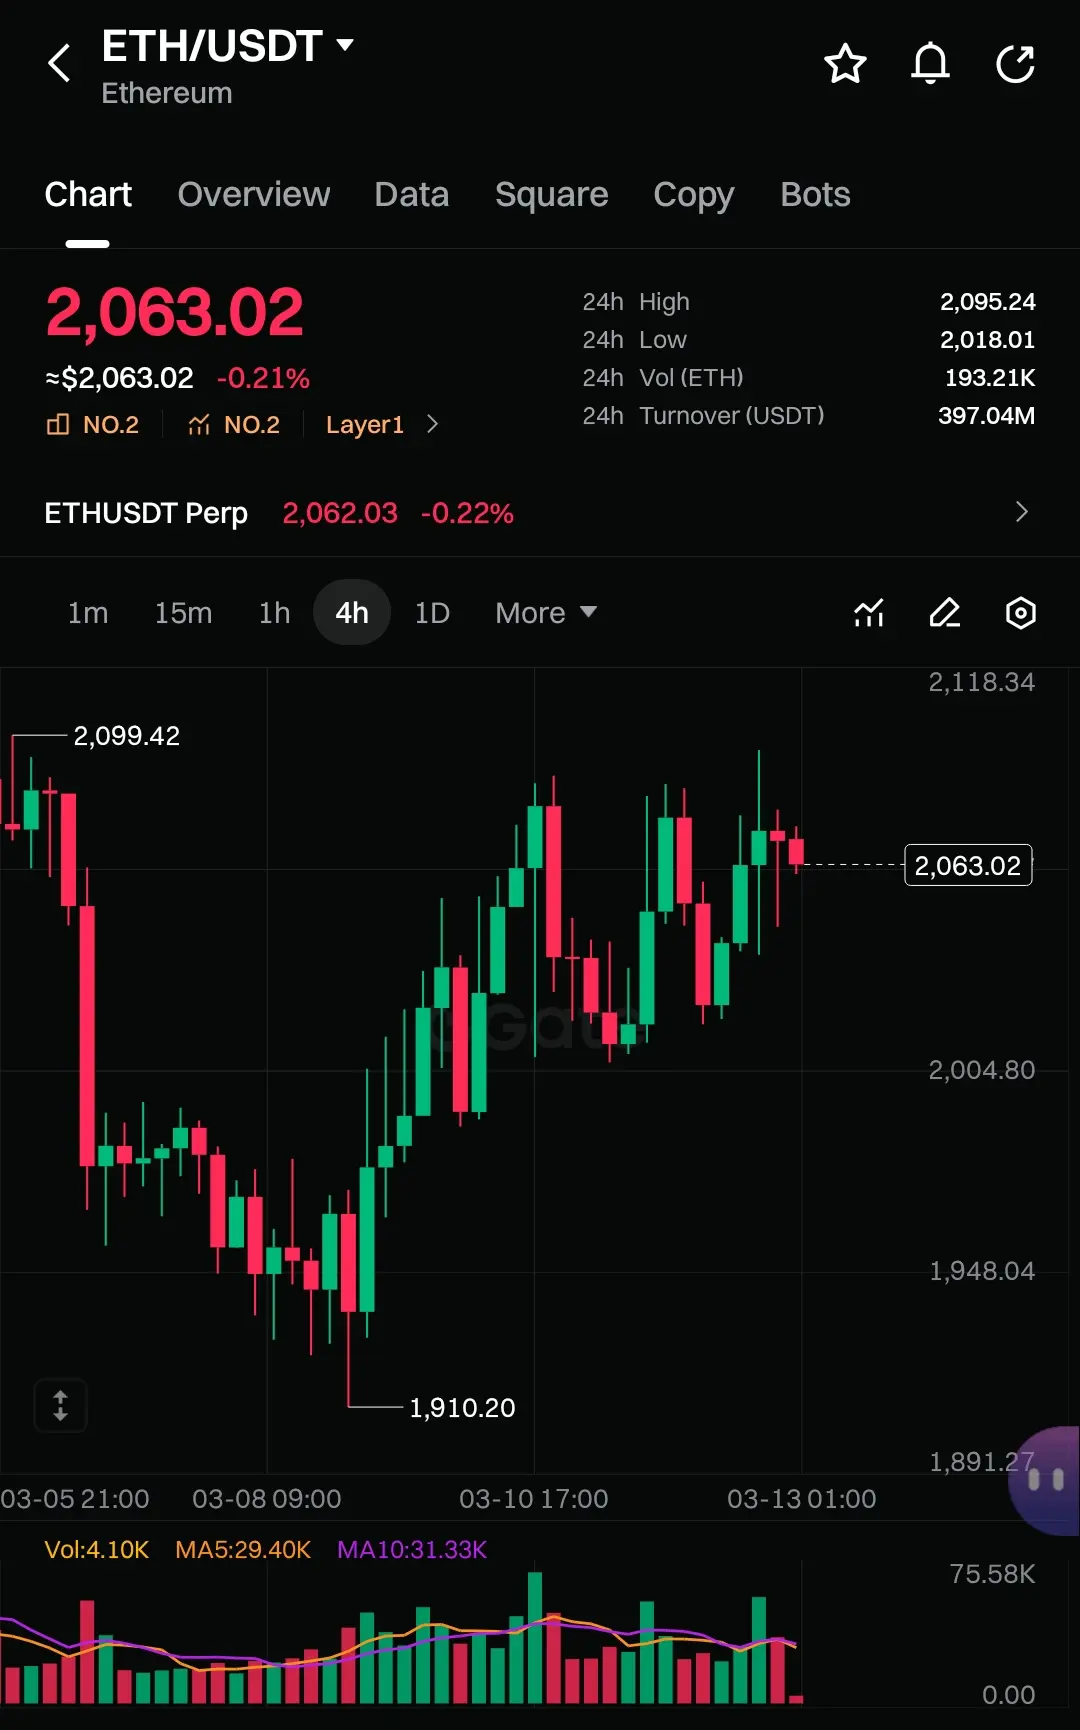
エントリー: 2,030 – 2,050
強気の上抜け: 2,095
TP1: 2,150
TP2: 2,210
TP3: 2,300
SL: 1,975
価格は1,916.14のローカルフロアからのバウンス後、堅調な高値安値ベースを確立しています。4時間足でモメンタムは現在ポジティブに転じており、買い手が2,000の心理的レベルを防衛し、直近レジスタンスへ向かっています。完全なトレンド逆転を確認するため、2,095ピークの上での継続的な上昇を期待しており、以前のレンジ高値に向かうことを目指しています。
#ETH #Ethereum #BitcoinSupportAndResistanceAnalysis
ETH0.02%
- 報酬
- いいね
- コメント
- リポスト
- 共有

- 報酬
- いいね
- コメント
- リポスト
- 共有
弟子入りは態度だけを見て、資金は見ません。同じ波長の者、来てください。
技術、心構え、リスク管理から実戦体系まで、
あなたが自分自身の取引認識を築くのをサポートします。
本気で学びたい、実行する意志のある方は、師匠に弟子入りしてください。
取引はギャンブルではなく、認識を現金化することです。
私が長年にわたり検証してきた思考、方法、そして踏んだ落とし穴を、
体系的に教えます。
原文表示技術、心構え、リスク管理から実戦体系まで、
あなたが自分自身の取引認識を築くのをサポートします。
本気で学びたい、実行する意志のある方は、師匠に弟子入りしてください。
取引はギャンブルではなく、認識を現金化することです。
私が長年にわたり検証してきた思考、方法、そして踏んだ落とし穴を、
体系的に教えます。

- 報酬
- 1
- コメント
- リポスト
- 共有
HokageFire
火影币
作成者@GateUser-793953f1
申込状況
0.00%
時価総額:
$0
より多くのトークン
紹介取引チャレンジ:50 GTを一緒に稼ごう、リーダーボードのトップに立ってUnitreeロボットを獲得しよう https://www.gate.com/campaigns/4162?ref=VLARBF1YAG&ref_type=132&utm_cmp=bg9cll5L
GT-0.14%

- 報酬
- いいね
- コメント
- リポスト
- 共有
✨米国労働統計局BLSは2026年2月のデータを2026年3月11日に発表した。年間CPIの伸びは2.4%で、1月と全く同じ水準であり、エコノミストの予想を完全に満たしている。季節調整済みの月次増加率は0.3%だった。コアCPI(食料とエネルギーを除く)は年間で2.5%、月間で0.2%上昇した。住宅・シェルター費用がインフレの最大の要因であり、月次で0.2%、年間で3.0%上昇している。食料は月次で0.4%、エネルギーは0.6%上昇。ガソリンは前年同期比で依然として-5.6%のマイナスだった。医療と衣料品でも大幅な上昇が見られた。
✨データ発表後のウォール街の反応は限定的だった。株価先物はまちまちで、債券利回りはわずかに上昇した。アナリストはこのレポートを「背景ノイズ」と呼び、本当の焦点は原油価格の上昇と中東の緊張、特にイランにあると指摘している。3月のデータは4月10日に発表予定であり、原油の影響によりインフレが押し上げられると予想されている。
✨インフレは依然としてFRBの2%目標を上回っており、10〜12ヶ月間ほぼ変わらない状態が続いている。この状況は金利引き下げの期待を遅らせる可能性がある。しかし、エネルギーコストに対する世界的な圧力は、2026年第2四半期に再び加速するリスクを孕んでいる。短期的には、「予想通り」のデータが市場に安心感をもたらしたが、地政学的リスクに注意を
原文表示✨データ発表後のウォール街の反応は限定的だった。株価先物はまちまちで、債券利回りはわずかに上昇した。アナリストはこのレポートを「背景ノイズ」と呼び、本当の焦点は原油価格の上昇と中東の緊張、特にイランにあると指摘している。3月のデータは4月10日に発表予定であり、原油の影響によりインフレが押し上げられると予想されている。
✨インフレは依然としてFRBの2%目標を上回っており、10〜12ヶ月間ほぼ変わらない状態が続いている。この状況は金利引き下げの期待を遅らせる可能性がある。しかし、エネルギーコストに対する世界的な圧力は、2026年第2四半期に再び加速するリスクを孕んでいる。短期的には、「予想通り」のデータが市場に安心感をもたらしたが、地政学的リスクに注意を


- 報酬
- 2
- 4
- リポスト
- 共有
Discovery :
:
LFG 🔥もっと見る
🔴 アメリカの不動産市場では、売り手の数が買い手の数を60万件以上上回っており、これは記録されたことのないほどの最大の格差です。
原文表示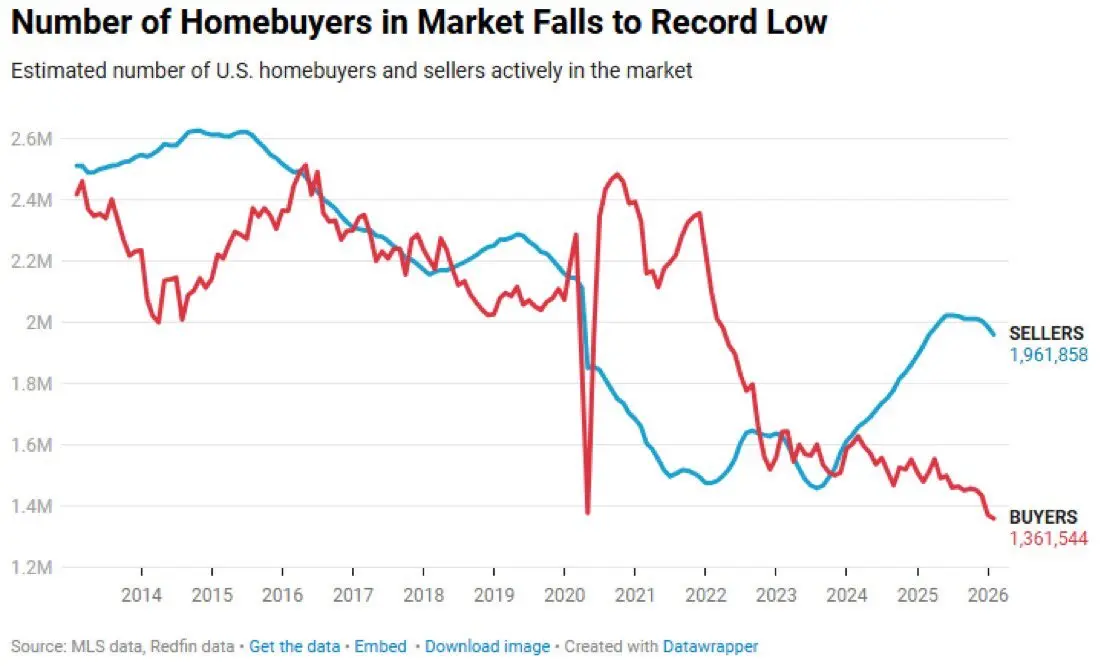
- 報酬
- いいね
- コメント
- リポスト
- 共有
$EXA 🇫🇷 コールを購入 💰 👇
原文表示
- 報酬
- いいね
- コメント
- リポスト
- 共有
✨ProShares戦略責任者のシメオン・ハイマン氏は、$100 十億ドル規模のETF大手として、CNBCでビットコインに対する古典的なリスク認識を打ち砕きました:「ビットコイン、イーサ、ソラナ、XRPを単なるリスク資産と考えるのは間違っています。数字を実行すると、それらの分散性が明らかになります。」ハイマン氏は、ビットコインが株式から乖離し、世界中の紛争と地政学的緊張の中でも上昇傾向を示しているとしています。このステートメントは、BTC が「まだ完全には価格設定されていない」というテーゼを強化しています。特にスポットETFのフローと機関投資家による買いが継続している間は。
✨ビットコインは現在、(過去24時間で1~2%の変動を伴う)68,500~70,000ドルの統合レンジで取引されています。週足チャートにはデッドクロスシグナルがありますが、ProSharesが強調した「分散化特性」とETFの支援的トレンドのおかげで、短期間は上昇バイアスが維持されています。
✨強気シナリオ (最も可能性が高い-60%の確率):72,000ドルを超過してETFの流入が継続する場合(ProShares BITOおよびその競争相手の影響とともに)、75,000~78,000ドルがターゲットになります。ハイマン氏の「リスク資産ではない」という強調がここで機能します。BTCの乖離が増加する一方で、株式と金
原文表示✨ビットコインは現在、(過去24時間で1~2%の変動を伴う)68,500~70,000ドルの統合レンジで取引されています。週足チャートにはデッドクロスシグナルがありますが、ProSharesが強調した「分散化特性」とETFの支援的トレンドのおかげで、短期間は上昇バイアスが維持されています。
✨強気シナリオ (最も可能性が高い-60%の確率):72,000ドルを超過してETFの流入が継続する場合(ProShares BITOおよびその競争相手の影響とともに)、75,000~78,000ドルがターゲットになります。ハイマン氏の「リスク資産ではない」という強調がここで機能します。BTCの乖離が増加する一方で、株式と金


- 報酬
- 2
- 4
- リポスト
- 共有
Discovery:
LFG 🔥もっと見る
#GateSquareAIReviewer ビットコイン ($BTC)は、引き続き暗号資産市場の主要なデジタル資産として支配的な地位を保ち、市場全体のセンチメントに強い影響を与え続けています。最近のBTCは、強気の楽観主義と短期的な利益確定の間でバランスを取るような、混在した価格動きを示しています。サイクルの初期段階での強い上昇モメンタムの後、市場は現在、マクロ経済のシグナルや流動性状況を評価しながら調整局面を迎えています。
テクニカル分析の観点から、ビットコインはより長い時間軸で広範な強気の構造を維持しています。主要なサポートゾーンは比較的良好に維持されており、長期投資家が価格の下落時に継続的に買い増しを行っていることを示唆しています。この買い集め行動は、次のブレイクアウト前の調整段階でよく見られる現象です。しかしながら、現在の取引レンジの上に位置する抵抗レベルは、短期的な上昇を制限し続けており、横ばいの取引環境を作り出しています。
市場のセンチメントは、金利予想、機関投資の資金流入、デジタル資産に関する規制の動向など、世界経済の状況にも左右されています。従来の市場がボラティリティを見せるとき、ビットコインは迅速に反応し、リスクオンとリスクオフの戦略間でトレーダーが動きます。特に、現物ビットコインETFや大手ファンドによる大規模な買い集めを通じた機関投資家の関心は、資産の構造的
BTC-0.34%


- 報酬
- いいね
- コメント
- リポスト
- 共有
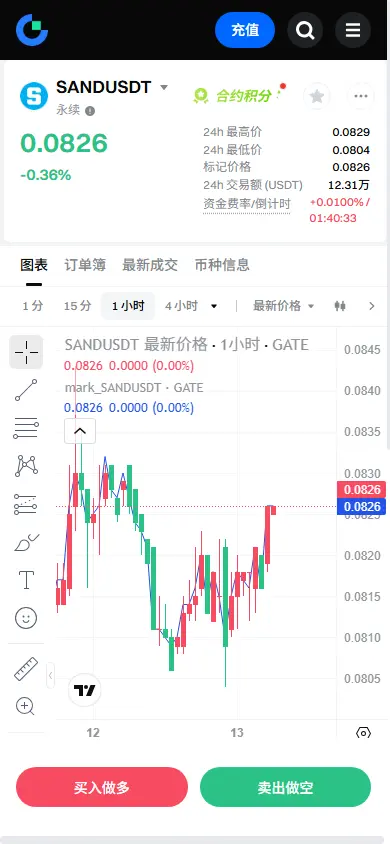
【$SAND Signal】1H Breakout and Pullback, Setting Up for Short-term Rebound
$SAND At the 1H level, price pulled back after surging near 0.0829. Currently, price is finding support above the 1-hour moving average and showing a convergence consolidation pattern. The 4-hour chart shows price oscillating within the 0.0806-0.0829 range, but the 1-hour chart displays thick buying depth with the latest 1-hour candle showing buying pressure at 70%, indicating that short-term bullish momentum is gathering. Open interest remains stable, and the price decline has not triggered panic liquidations, suggesti
原文表示$SAND At the 1H level, price pulled back after surging near 0.0829. Currently, price is finding support above the 1-hour moving average and showing a convergence consolidation pattern. The 4-hour chart shows price oscillating within the 0.0806-0.0829 range, but the 1-hour chart displays thick buying depth with the latest 1-hour candle showing buying pressure at 70%, indicating that short-term bullish momentum is gathering. Open interest remains stable, and the price decline has not triggered panic liquidations, suggesti
- 報酬
- いいね
- コメント
- リポスト
- 共有
👑 KING MYCO
地下菌類ネットワークの支配者。
🍄 Myco Kingdom Game
⚔️ クラン戦争
🏰 あなたの王国を築こう
💰 Solana上の$MYCO によって支えられています
胞子が広がっています。
王国に参加しよう ↓
地下菌類ネットワークの支配者。
🍄 Myco Kingdom Game
⚔️ クラン戦争
🏰 あなたの王国を築こう
💰 Solana上の$MYCO によって支えられています
胞子が広がっています。
王国に参加しよう ↓
SOL-0.86%

- 報酬
- いいね
- コメント
- リポスト
- 共有
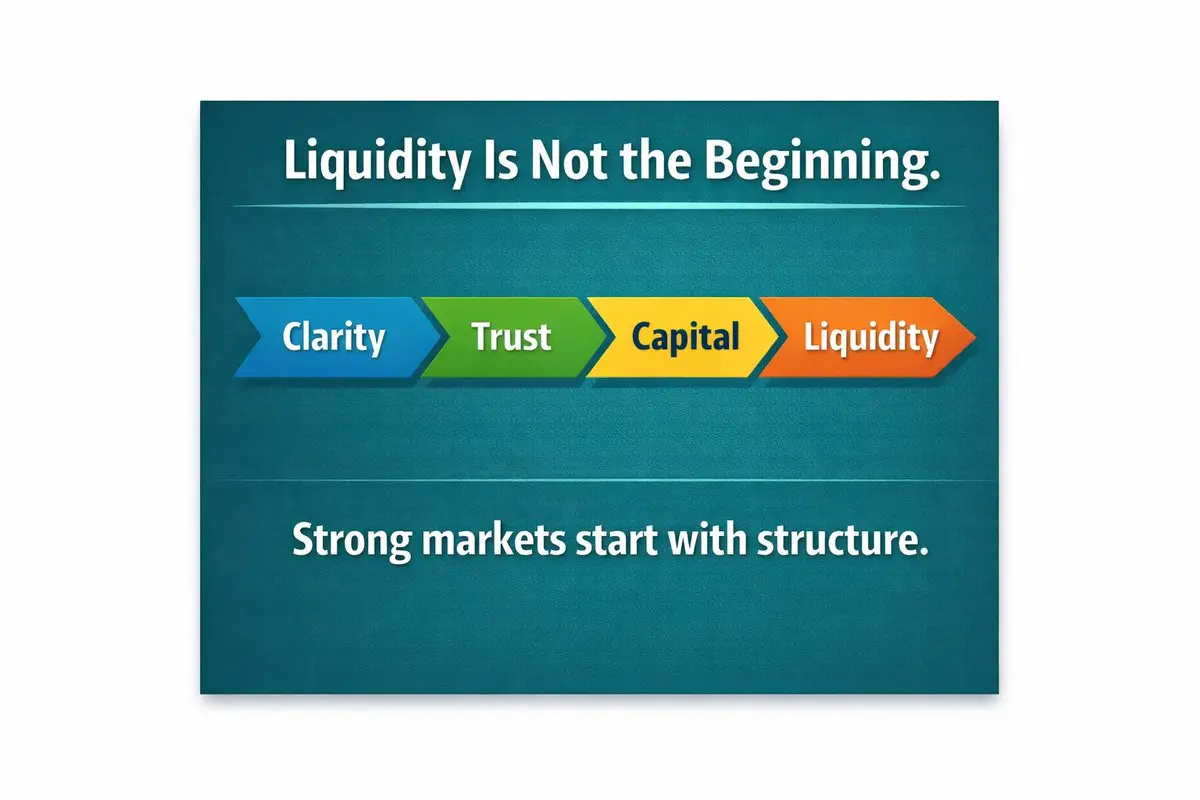
スマートコントラクトが最初に失敗することはめったにない。
ガバナンスが失敗する。
コードは決定論的である。
人間のインセンティブはそうではない。
#DigitalAssets
#Governance
#Tokenization
原文表示ガバナンスが失敗する。
コードは決定論的である。
人間のインセンティブはそうではない。
#DigitalAssets
#Governance
#Tokenization
- 報酬
- いいね
- コメント
- リポスト
- 共有
汗血宝马
汗血宝马
作成者@gatefunuser_22b1
上場の進行状況
100.00%
時価総額:
$8.38K
より多くのトークン
運試しをしてみた
BC Gameのミームコインで新しいハンドバッグが買えたかもしれない
それとも、ただディナー代くらいだったのかな?
BC Gameのミームコインで新しいハンドバッグが買えたかもしれない
それとも、ただディナー代くらいだったのかな?
原文表示
- 報酬
- いいね
- コメント
- リポスト
- 共有
【$SNX 信号】押し目買いチャンス!1H RSIの底背離、主力の護盤サインが明確
$SNX 1時間足は現在、重要なサポート付近で底打ちの調整中であり、価格は小幅に下落しているものの、建玉量は安定しており、パニック売りは見られないことから、主力が価格を支えている可能性が示唆される。1時間RSIはすでに売られ過ぎゾーンに入り、底背離の兆候も見られる。4時間足は前期の密集取引域の上限まで下げており、その下の買い深度も厚く、短期的な反発の土台として良好な状況となっている。
🎯方向性:買い
⚡エントリー/注文:0.308 - 0.309
🛑ストップロス:0.301
🚀ターゲット1:0.342
🚀ターゲット2:0.358
🛡️取引管理:
- 実行戦略:ターゲット1到達後に保有量の50%を手仕舞いし、ストップロスをエントリー価格に引き上げる。残りのポジションはターゲット2を狙い、価格がエントリーレベルに戻った場合は自動的に退出し、資本を保護する。
深層ロジック:価格は下落しているが、建玉量は安定しており、負の資金費率と併せて考えると、これはむしろロングレバレッジの清算であり、主力の売り出しではない可能性が高い。1時間RSIは43.5まで下落し、売られ過ぎに近づき、底背離も出現しているため、テクニカル的な反発が間近に迫っている。板情報によると、0.301〜0.308の範囲に大量の注文
原文表示$SNX 1時間足は現在、重要なサポート付近で底打ちの調整中であり、価格は小幅に下落しているものの、建玉量は安定しており、パニック売りは見られないことから、主力が価格を支えている可能性が示唆される。1時間RSIはすでに売られ過ぎゾーンに入り、底背離の兆候も見られる。4時間足は前期の密集取引域の上限まで下げており、その下の買い深度も厚く、短期的な反発の土台として良好な状況となっている。
🎯方向性:買い
⚡エントリー/注文:0.308 - 0.309
🛑ストップロス:0.301
🚀ターゲット1:0.342
🚀ターゲット2:0.358
🛡️取引管理:
- 実行戦略:ターゲット1到達後に保有量の50%を手仕舞いし、ストップロスをエントリー価格に引き上げる。残りのポジションはターゲット2を狙い、価格がエントリーレベルに戻った場合は自動的に退出し、資本を保護する。
深層ロジック:価格は下落しているが、建玉量は安定しており、負の資金費率と併せて考えると、これはむしろロングレバレッジの清算であり、主力の売り出しではない可能性が高い。1時間RSIは43.5まで下落し、売られ過ぎに近づき、底背離も出現しているため、テクニカル的な反発が間近に迫っている。板情報によると、0.301〜0.308の範囲に大量の注文

- 報酬
- いいね
- コメント
- リポスト
- 共有
彼氏は彼女がこんなに俺のことを考えているって知ってるのかな
原文表示
- 報酬
- いいね
- コメント
- リポスト
- 共有
Crypto bro: すべて大丈夫?
Me:
原文表示Me:

- 報酬
- いいね
- コメント
- リポスト
- 共有
市場:Striveは、ビットコインの購入、配当構造の調整、およびStrategy+優先株への大規模な投資を組み合わせて、バランスシートをさらに調整しました。同社はトレジャリーに179 BTCを追加し、SATA配当を12.75%に引き上げ、$50 百万をSTRCに割り当てました。Striveは追加で179 BTCを購入し、準備金を13,311 BTCに増加させ、約$930 百万と評価しています。同社はSATA永久優先株の配当を25ベーシスポイント引き上げて12.75%としました。
BTC-0.34%

- 報酬
- いいね
- コメント
- リポスト
- 共有
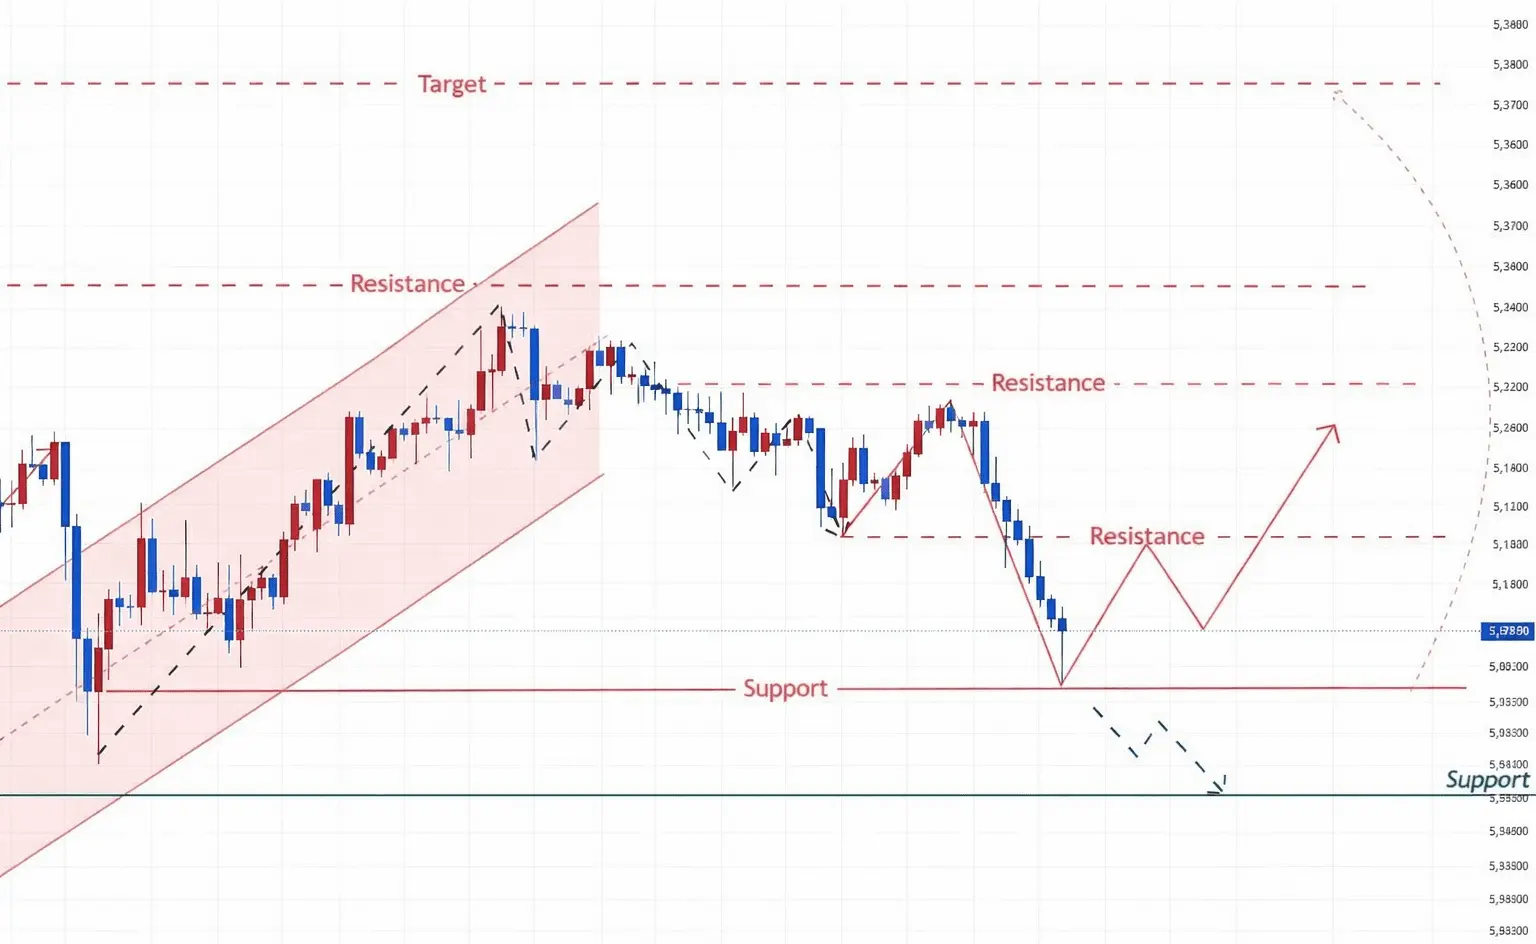
#GOLD の1時間足チャート分析では、価格が明確な短期下降トレンドにあり、一連の安値と高値の切り下げを形成しています。
最近の下落に続き、価格は$5060 流動性レベルを下抜け、売却流動性が不足している領域を指しています。
注視すべき主要レベルは$5070 エリアです。
価格がこのレベルまで戻り、強気の確認ローソク足が現れた場合、流動性枯渇後に買い手が市場をコントロールしていることを示す可能性があります。
トレーディング方向
• 流動性スイープエリア:約$5060
• エントリー確認:$5070
上での強気クローズ• メジャーサポート:約$5040 (4時間サポートエリア)
• 目標価格:$5140 (次の抵抗/流動性ターゲット)
強気の確認シグナルが現れた場合、市場は上方に動いて市場の非効率性を埋め、$5140 抵抗レベルをテストする可能性があります。
ここをクリックしてトレード
$XAU #XAUUSD
XAU-1.38%
- 報酬
- いいね
- コメント
- リポスト
- 共有
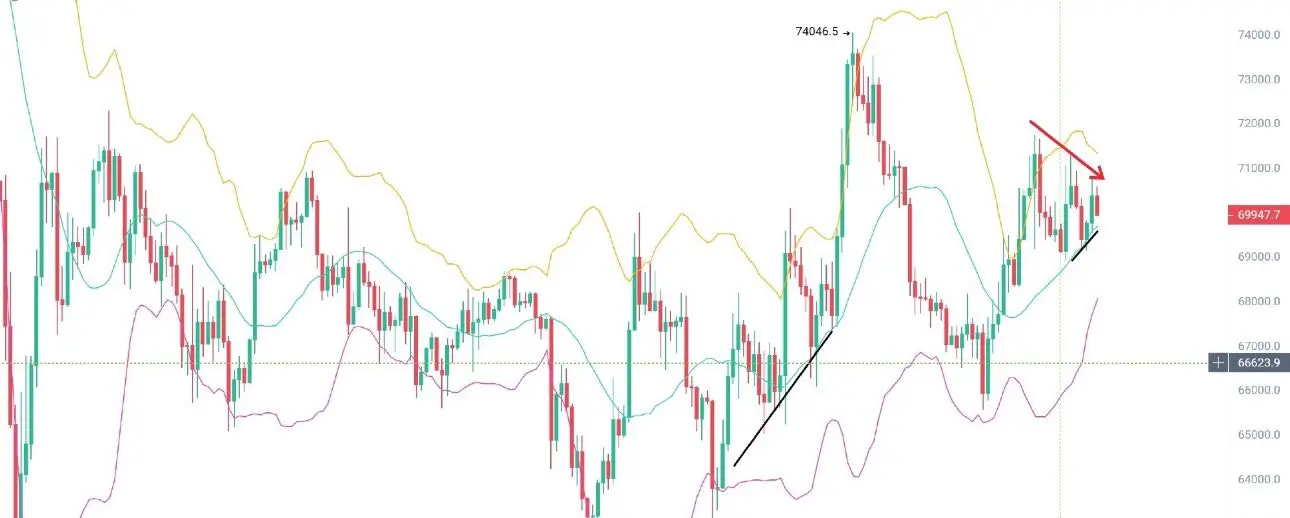
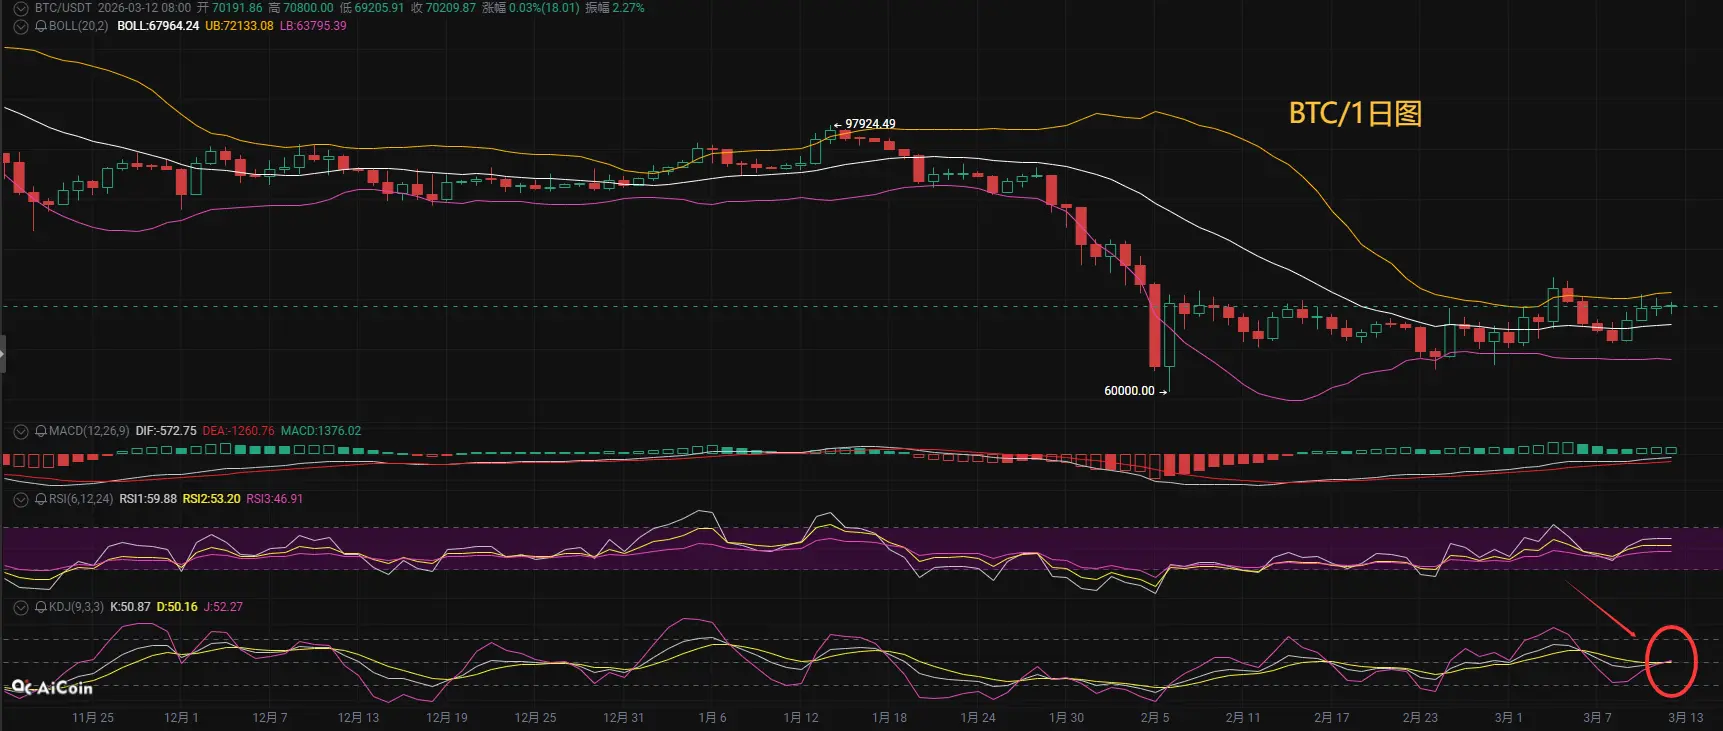
BTCは4時間足のインジケーターとローソク足の形態が非常に魅力的で強気に見えますが、日足と週足は上昇トレンドに向かう条件を備えていません。特に週足のインジケーターはこの点で完全に止まっています。相場の上昇余地はあまりなく、いつでも急落する可能性があります。また、主な押し目買いは調整と微増の動きで時間を稼いでいる段階であり、最終的には売りと急落が必要となるでしょう。日足のボリンジャーバンドの圧力ラインは71800をトップとし、その上の溢出ポイントは8時間EMAのダブルトラック圧力の72800です。これは3月4日の高値74000の圧力ラインでもあります。現在の高値圏は71000付近で、最近の調整は69000ポイント付近で行われています。昨日は70200-71000の高値でショートを仕掛け、今日は70500-71300の範囲に上昇したところでショートを仕掛けます。毎日の高値の上昇に合わせてショートを積み重ねていきます。上昇余地は限られており、いつでも急落の可能性があります。
BTC-0.34%
- 報酬
- 2
- コメント
- リポスト
- 共有
Cryptocurrency Mr. Coin: 3.13 Bitcoin (BTC) Market Analysis Reference
Bitcoin rebounded yesterday after testing support, and prices rose but unfortunately failed to break through the upper resistance. Currently, the price has pulled back to around the 70000 level, with bulls and bears in a stalemate. The pullback shows signs of stabilization, and if it closes positive again during the day, it is expected to further test upward. Focus on the previous high around 71300 level above. Breaking through and stabilizing is expected to change the oscillation pattern. All coin friends are advised to be
原文表示Bitcoin rebounded yesterday after testing support, and prices rose but unfortunately failed to break through the upper resistance. Currently, the price has pulled back to around the 70000 level, with bulls and bears in a stalemate. The pullback shows signs of stabilization, and if it closes positive again during the day, it is expected to further test upward. Focus on the previous high around 71300 level above. Breaking through and stabilizing is expected to change the oscillation pattern. All coin friends are advised to be

- 報酬
- いいね
- コメント
- リポスト
- 共有
もっと詳しく
成長中のコミュニティに、40M人のユーザーと一緒に参加しましょう
⚡️ 暗号通貨ブームのディスカッションに、40M人のユーザーと一緒に参加しましょう
💬 お気に入りの人気クリエイターと交流しよう
👍 あなたの興味を見つけよう
人気の話題
もっと見る115.27K 人気度
44.18K 人気度
13.5K 人気度
131.59K 人気度
145.84K 人気度
人気の Gate Fun
もっと見る- 時価総額:$2.42K保有者数:10.00%
- 時価総額:$0.1保有者数:10.00%
- 時価総額:$0.1保有者数:00.00%
- 時価総額:$2.41K保有者数:10.00%
- 時価総額:$0.1保有者数:00.00%
ニュース
もっと見るピン