Highlights
①. Gate's "Basic Futures Contracts" course introduces various methods of technical analysis that are commonly employed in futures trading. The aim of these courses is to help traders establish a comprehensive framework for technical analysis. Covered topics include the basics of Candlestick charts, technical patterns, moving averages, trend lines, and the application of technical indicators.
②. This article, as Course VI of the series "Master Technical Analysis", will introduce one key candlestick pattern-round bottom, and will cover the concept of the pattern, its characteristics, technical meaning, as well as its application in trading.
1. What is the round bottom?
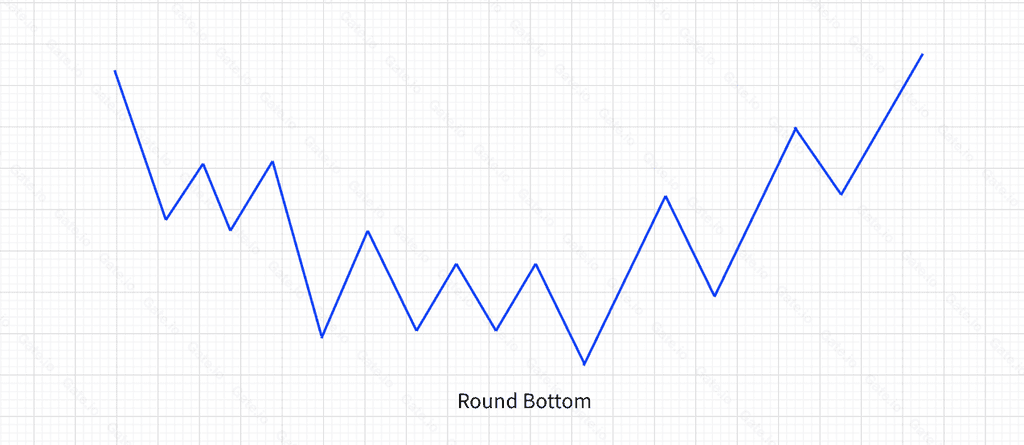
The round bottom depicts the trajectory of the price when it falls at first, then consolidates at the bottom for a while, and finally gains momentum to rise. In the falling stage, as the price tumbles at an increasingly faster speed, the trading volume shrinks as well. Similarly, when the price starts to go bullish, the market also sees an increase in the trade volume. Figure 6-1 shows an example of round bottom:
2. Technical features of round bottom
①. It may appear at the end of a bearish trend or in the middle of a bullish run;
②. In the first stage, the price fluctuates violently, showing frequent trading behaviors from traders. As time goes by, traders' enthusiasm dims, the candlestick shows gentle ups and downs, and gradually starts a period of sideways movement. The consolidation lasts until new capital enters, which pushes the price to rally slowly. With more and more money flowing in, the market enters a new round of bullish run.
③. The trading volume shrinks as the price tumbles and hits the bottom when the price consolidates sideways. As the price starts to pick up, the trading volume begins to expand as well. The faster the speed of price recovery, the larger the increment in trade volume. In the candlestick chart, the histograms of trading volume are also arranged in the shape of an arc.
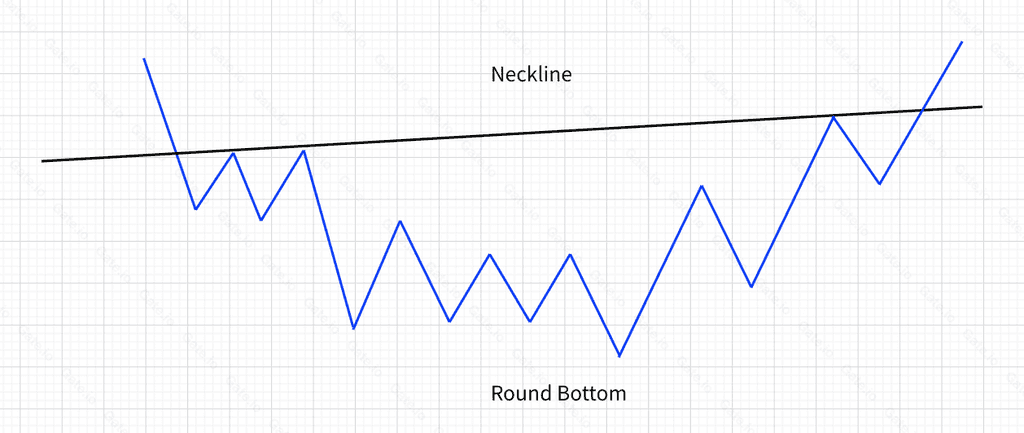
④. The neckline is the line that connects the highest points of the arc:
3. Technical meaning of round bottom
①.A round bottom is a reliable pattern for a reversal signal. Traders can enter the market to open long positions when the price breaks up the neckline. Or, before the round bottom has yet been established, they can depend on other technical analysis methods to find the timing to enter.
②. A round bottom usually provides reliable buying signals. As long as traders can identify the pattern and follow the signal to trade, they can usually substantially profit from a strong, sharp, and sustainable bullish wave. Unfortunately, the pattern can be easily missed in actual trading because most traders lack the patience to wait for the arc to be established, which usually takes a long process to form.
4. Application
The duration of consolidation is positively correlated to the strength of the subsequent bullish rise. The longer the consolidation, the harder and longer the rally. As shown below:
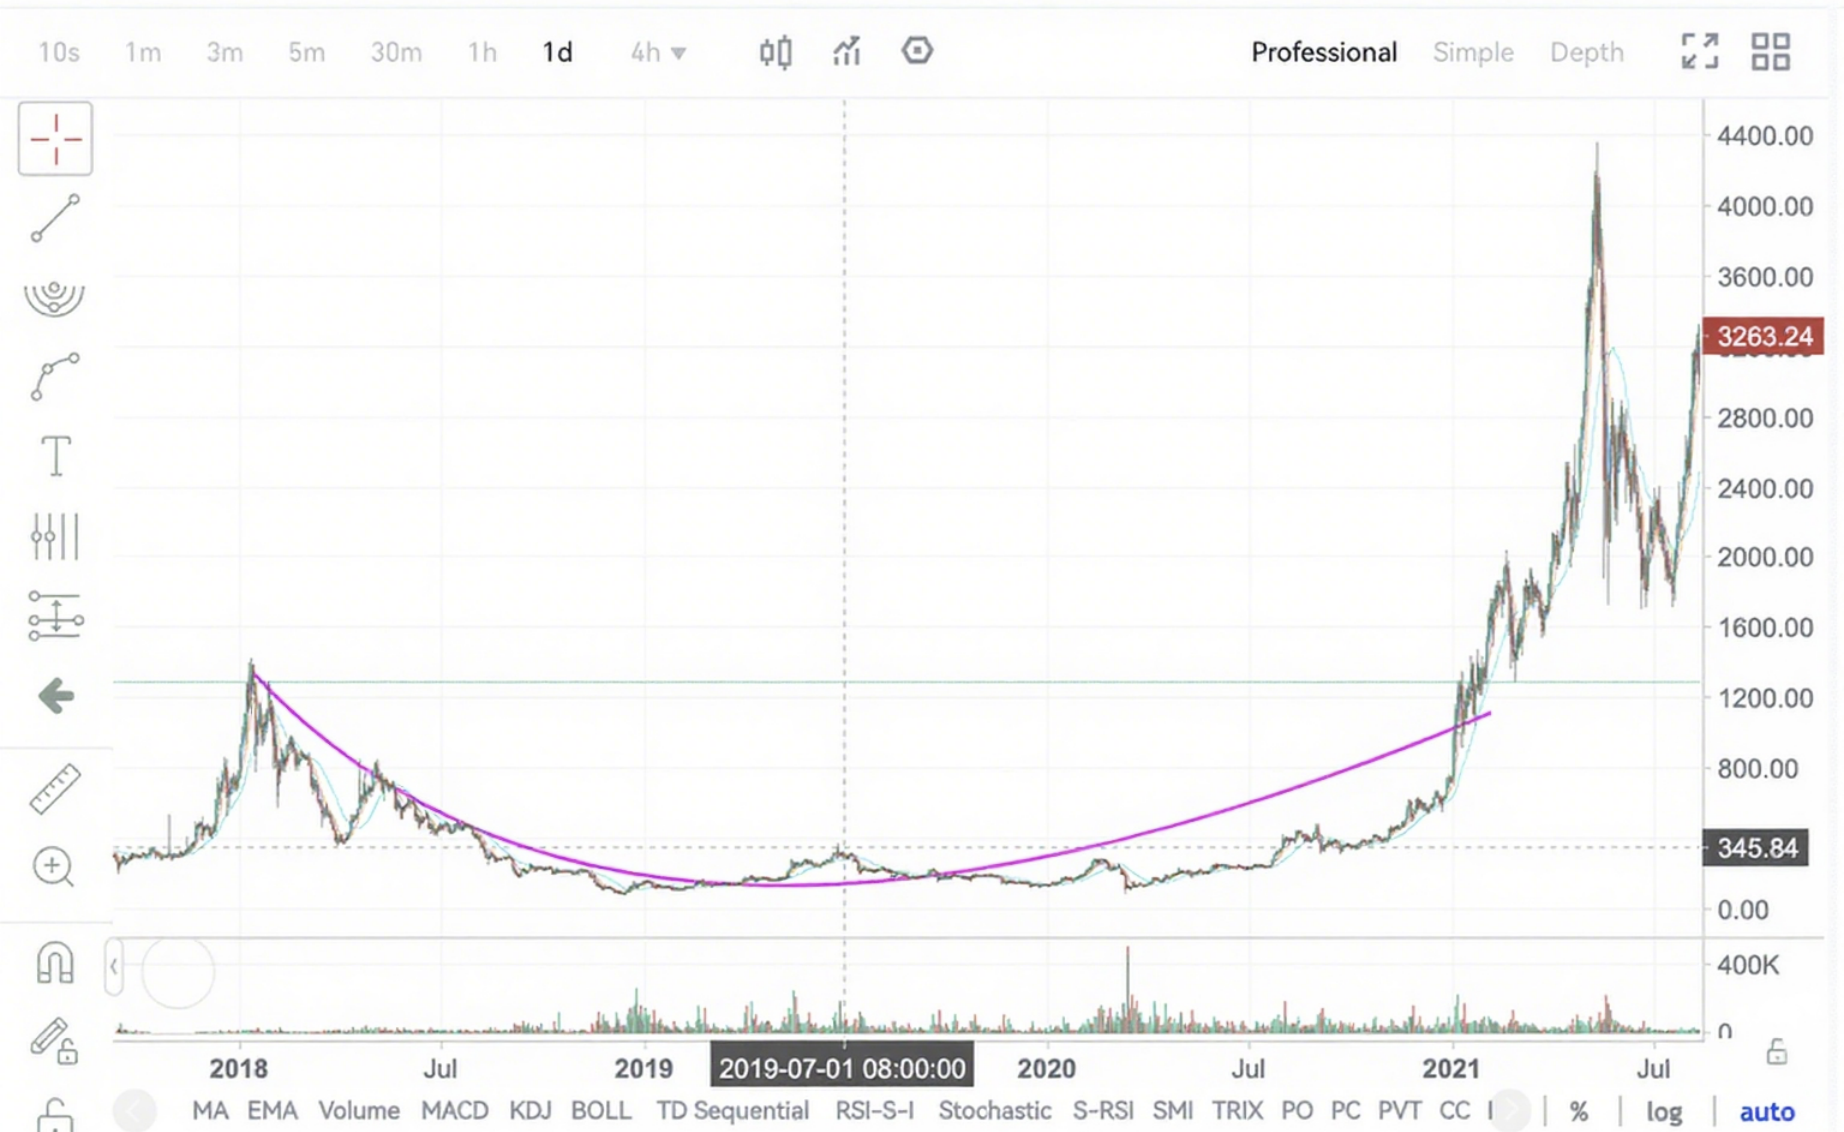
The above shows the change of ETH price from 2018 to 2021. From January 2018 and January 2019, the market experienced a bearish run to fall from the highs of $1,300 to the lows of $81, diving more than 90% in just one year.The asset underwent a prolonged consolidation period from January 2019 to March 2020, with the price ranging between $100 and $400 US dollars. The candlesticks during this period formed a distinct round bottom pattern, spanning over a year. After an extended phase of accumulation, the market finally experienced a significant surge. The super bull market commenced in March 2020, driving the price up by more than 5,000%.
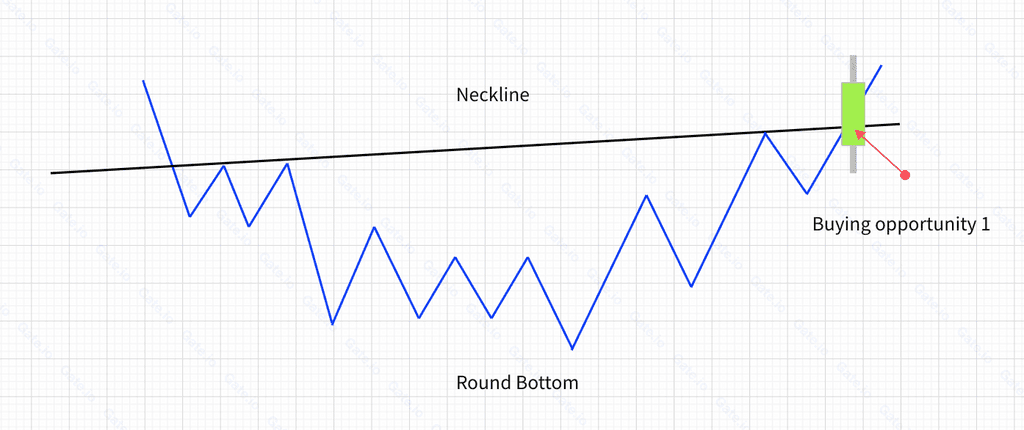
①.Buying opportunity 1: The first buying signal occurs when the price breaks up the neckline.
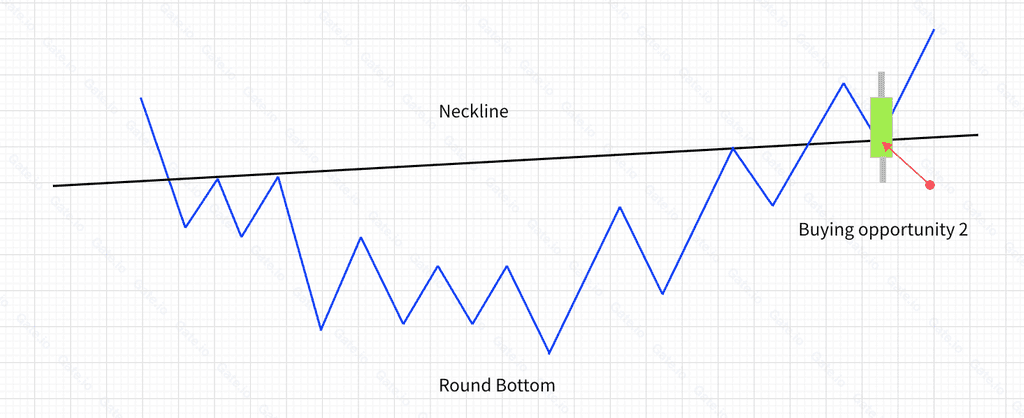
②.Buying opportunity 2: After the price rises to break up the neckline, it will not keep rising. Usually, it will take a downturn until it touches the neckline again. This is a second chance to buy a crypto asset. As shown below:
③. In certain instances, the buying signal may manifest before the completion of the round bottom pattern. Given that the formation of some arcs can be time-consuming, traders can rely on other technical patterns emerging during this phase. For instance, a breakthrough of the medium and long-term trend lines can serve as effective entry signals, eliminating the need to await the neckline break. When a signal is identified, it's advisable to cross-reference with other technical patterns to doubly confirm and enhance the likelihood of success.
After the round bottom is formed, the time coverage of the arc shape is often positively correlated with the magnitude of the later rebound. That is, the longer the sideways consolidation, the harder and longer the rally. As the saying goes, "The wider the arc, the higher it is."
The round bottom might be a fake one if there is no significant increase in the trade volume when the price goes up to break the neckline.
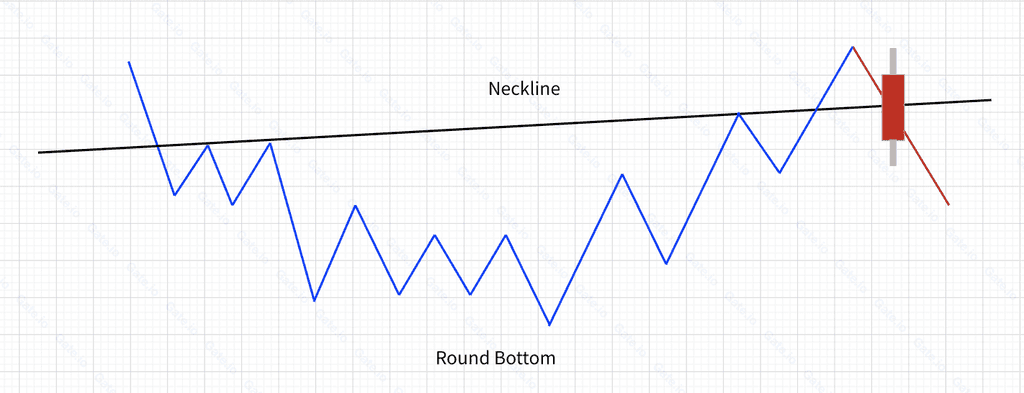
As illustrated above, the round bottom may not always function as an effective trading signal. Even though a perfect arc shape forms, trading volume doesn't see a significant rise as the price attempts to breach the neckline. Furthermore, after breaking it, the price drops below the neckline once again.
5. Summary
The round bottom pattern frequently appears in market movements. At times, especially during an extended bear market, this pattern can take a while to develop. This is often because investors, having been significantly impacted both financially and emotionally, require more time for recovery. However, once the round bottom is confirmed, traders can consider it a highly reliable signal to confidently enter the market with a long position.
Start trading futures by registering on Gate Futures.

Disclaimer
This article is for informational purposes only and does not constitute investment advice. Gate is not responsible for any investment decisions you make. Content related to technical analysis, market assessments, trading skills, and traders' insights should not be considered a basis for investment. Investing carries potential risks and uncertainties. This article offers no guarantees or assurances of returns on any type of investment.
Disclaimer
The content provided herein is for reference and educational purposes only and does not constitute any financial, investment, trading, or legal advice, nor does it constitute an offer or solicitation to buy or sell any digital assets. Gate makes no express or implied representations or warranties regarding the accuracy, completeness, or timeliness of the information contained herein. Product features, interfaces, rules, and fee structures may be updated or adjusted at any time. Please refer to the latest announcements and the actual information displayed on the Gate platform for the most accurate details.
Digital asset investments involve significant risk, and prices may fluctuate substantially. You may lose the entire amount of your investment. Please make decisions cautiously based on your own financial situation and risk tolerance after fully understanding the associated risks. If necessary, you are advised to consult an independent professional financial or legal advisor.
For more information about potential risks, please refer to Gate's Risk Disclosure and User Agreement.
