Understanding Red and Green Colors in Cryptocurrency Charts

12-21-2025, 8:17:39 AM
Crypto Insights
Crypto Trading
Crypto Tutorial
K-line
Spot Trading
Article Rating : 4.5
half-star
122 ratings
The article "Understanding Red and Green Colors in Cryptocurrency Charts" explores how these colors indicate market momentum and sentiment, critical for effective trading. It addresses questions like the significance of green in crypto and how green and red patterns shape market interpretations. Aimed at traders seeking to enhance technical analysis, the article delves into candlestick relationships, trend reversals, and support/resistance levels. By mastering red and green analysis alongside broader market research, traders can refine strategies and improve outcomes on platforms like Gate.
Understanding Red and Green Colors in Cryptocurrency Charts

On Crypto Charts: What is Red and What is Green

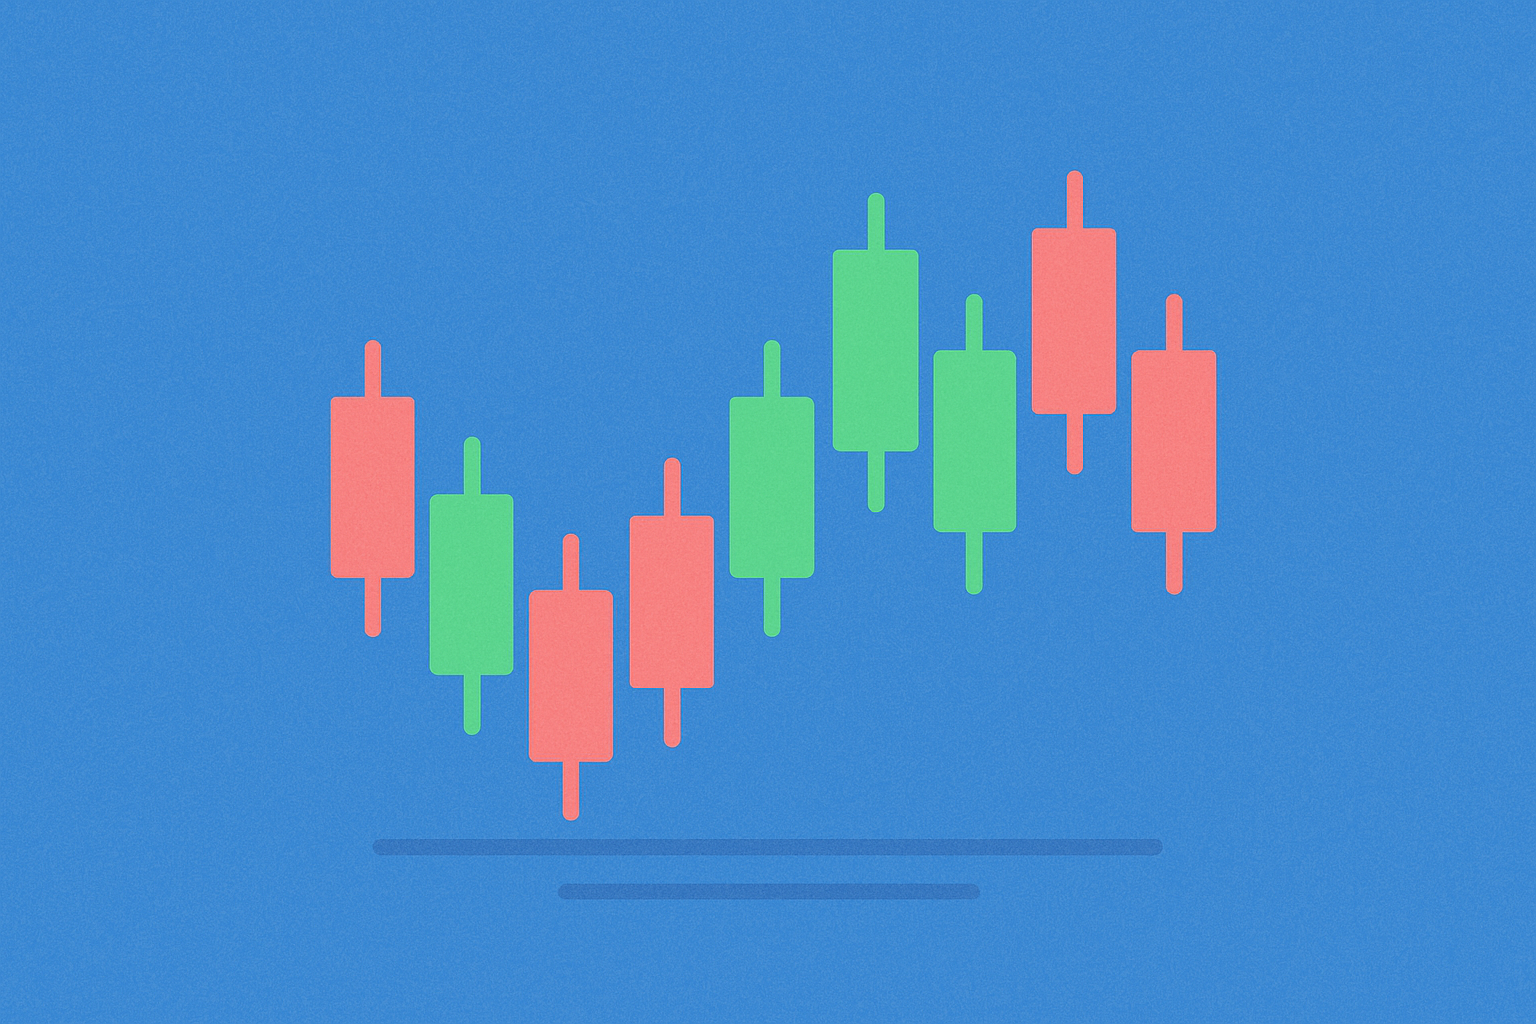
Understanding cryptocurrency charts is fundamental to successful trading in digital asset markets. Among the most basic yet crucial elements of chart reading are the red and green colors that appear throughout price charts. These colors serve as visual indicators of market direction and can significantly influence trading decisions. For traders wondering "what do the greens represent?" and how they contrast with red indicators, this guide provides comprehensive insights into these essential chart elements.

The Meaning of Red

In cryptocurrency trading, red represents a bearish market condition characterized by declining prices. When a candlestick or price bar displays in red, it indicates that the asset's closing price has fallen below its opening price during that specific time period. This downward movement reflects selling pressure in the market.

For example, if Bitcoin opens at $50,000 and closes at $48,000 within an hour, that hourly candlestick would appear red, showing a $2,000 decrease. Traders interpret consecutive red candlesticks as a bearish trend, suggesting that sellers are dominating the market. This pattern often prompts traders to consider selling their positions or initiating short positions, anticipating further price declines. Red candlesticks serve as warning signals that market sentiment may be turning negative, and caution should be exercised before entering new long positions.

The Significance of Green: What Do the Greens Represent?

Green candlesticks represent the opposite scenario, indicating bullish market conditions where prices are rising. Understanding what do the greens represent is crucial for identifying profitable trading opportunities. A green candlestick appears when the closing price exceeds the opening price for that period. This upward movement demonstrates buying pressure and positive market sentiment.

For instance, if Ethereum opens at $3,000 and closes at $3,200, the resulting candlestick would be green, reflecting a $200 gain. Multiple consecutive green candlesticks suggest an uptrend, where buyers are in control and demand exceeds supply. What do the greens represent in practical terms? They signal market optimism, buyer dominance, and potential continuation of upward price movement. Traders typically view this as an opportunity to enter long positions or hold existing investments, expecting continued price appreciation. Green patterns can signal market confidence among investors, making them attractive entry points for those seeking to capitalize on upward momentum.

Interpreting Red and Green Together

The true power of candlestick analysis emerges when examining the relationship between red and green patterns. Markets rarely move in a single direction indefinitely, and the interaction between these colors reveals important market dynamics.

A sequence of red candlesticks followed by green ones may indicate a trend reversal, where selling pressure exhausts itself and buying interest resurfaces. For example, after a sustained decline marked by five consecutive red candlesticks, the appearance of two strong green candlesticks might signal that the downtrend is ending and a new uptrend is beginning. This pattern often represents a shift in market sentiment from fear to optimism.

Conversely, when a series of green candlesticks is interrupted by red ones, it may suggest a temporary pullback or consolidation phase. This doesn't necessarily mean the uptrend has ended; rather, it could indicate profit-taking or a brief pause before the market continues higher. Traders must analyze the context, including volume and the size of candlesticks, to determine whether these interruptions represent minor corrections or significant trend changes.

Using Red and Green in Technical Analysis

Professional traders incorporate red and green candlestick patterns into comprehensive technical analysis strategies. These colors help identify critical support and resistance levels, which are price points where buying or selling pressure tends to concentrate.

For example, if a cryptocurrency consistently bounces upward (forming green candlesticks) after touching a specific price level, that level becomes identified as support. Understanding what do the greens represent at these support levels helps traders identify reliable entry points. Conversely, if prices repeatedly fail to break above a certain point (forming red candlesticks at that level), it establishes resistance.

Traders enhance their candlestick analysis by combining it with technical indicators. Moving averages help smooth out price action and confirm trends suggested by color patterns. The Relative Strength Index (RSI) measures momentum and can validate whether red or green candlesticks indicate oversold or overbought conditions. The Moving Average Convergence Divergence (MACD) indicator can confirm trend strength when aligned with predominant candlestick colors.

Successful traders don't rely on colors alone but use them as part of a multi-layered approach. They consider timeframes, volume, market news, and broader economic factors alongside red and green patterns to make well-informed decisions. Major trading platforms provide comprehensive charting tools that display these color patterns clearly, helping traders across all experience levels understand market movements.

Conclusion

Red and green colors on cryptocurrency charts are fundamental visual tools that convey essential information about market direction and sentiment. Red candlesticks indicate falling prices and bearish conditions, while green candlesticks represent rising prices and bullish momentum. For anyone asking "what do the greens represent?" – they symbolize positive price movement, buyer control, and bullish market sentiment. The interplay between these colors reveals potential trend reversals, continuations, and consolidation phases. By integrating red and green candlestick analysis with technical indicators and comprehensive market research, traders can develop more sophisticated strategies and improve their decision-making process. Mastering the interpretation of these colors is an essential step toward becoming a proficient cryptocurrency trader, enabling better risk management and more profitable trading outcomes in the dynamic digital asset markets.

FAQ

What does green represent as a brand color?

Green symbolizes nature, sustainability, and vitality. It conveys environmental consciousness, health, and eco-friendly values, creating a sense of trust and positive growth in the crypto ecosystem.

* The information is not intended to be and does not constitute financial advice or any other recommendation of any sort offered or endorsed by Gate.
Related Articles
Trading Simulator: The Complete Guide to Paper, Backtests, and Live Drills

Trading Simulator: The Complete Guide to Paper, Backtests, and Live Drills

Before risking real funds, smart traders pressure-test their edge in a simulator. Here’s how to choose one, set it up properly, and use it to turn ideas into a repeatable, data-driven playbook.
8-28-2025, 4:52:30 AM
What Does TP Mean in Crypto Trading Slang?

What Does TP Mean in Crypto Trading Slang?

This article delves into the crypto slang "TP," or "Take Profit," crucial for risk management in volatile markets. Key topics include TP and SL comparison for trading success, advanced order types on Gate, and sophisticated TP techniques utilized by Web3 traders. The piece emphasizes mastering TP placement through technical analysis and market psychology, aiding traders in maximizing potential gains. Ideal for crypto traders seeking disciplined practices and enhanced analytic strategies, it addresses implementing actionable TP strategies for optimized profit-taking in cryptocurrency trading.
8-22-2025, 1:44:02 AM
What is M Pattern in Trading

What is M Pattern in Trading

This article offers a comprehensive guide to mastering the M Pattern, a key bearish reversal signal in cryptocurrency trading. It focuses on recognizing key components of the M Pattern, including the peaks, troughs, neckline, and volume dynamics, ensuring traders enhance their market strategies. Readers will learn proven strategies for trading the M Pattern, differentiating authentic signals from false ones, and improving risk management and potential profits. Tailored for crypto traders, this piece provides essential insights to navigate volatile markets with advanced technical analysis using Gate's tools.
8-29-2025, 5:20:33 AM
Why Is Session Momentum Important? Trading Psychology Explained

Why Is Session Momentum Important? Trading Psychology Explained

This article delves into the critical role of session momentum in trading psychology and its impact on traders' decision-making and performance. It elucidates how understanding market psychology, session patterns, and technical analysis indicators can empower traders to identify and capitalize on trading opportunities. The piece addresses the needs of traders aiming to enhance their market insights and develop effective emotional regulation and risk management strategies. Structurally, the article progresses through the psychological aspects of momentum, recognizing market patterns, applying technical indicators, and psychological strategies for consistent profits.
9-4-2025, 6:33:58 PM
How to Read Crypto Charts: Beginner's Guide to Trading

How to Read Crypto Charts: Beginner's Guide to Trading

This beginner's guide to trading cryptocurrencies explains how to read crypto charts effectively. It covers the fundamentals of chart types — line, bar, and candlestick — and their impact on price movement analysis. The article delves into interpreting candlestick patterns for profitable trades and highlights essential technical indicators like Moving Averages, RSI, and MACD for comprehensive market analysis. It also explores advanced chart analysis techniques such as support, resistance, and market psychology, particularly useful for traders using Gate. This guide is perfect for new and experienced traders looking to enhance their trading strategies and market understanding.
9-18-2025, 4:23:32 AM
PNL in Crypto: A Complete Guide to Calculating Profit and Loss

PNL in Crypto: A Complete Guide to Calculating Profit and Loss

The article serves as a comprehensive guide to understanding and calculating Profit and Loss (PNL) in crypto trading, highlighting the criticality of PNL in evaluating investment performance. It addresses key distinctions between realized and unrealized PNL, essential calculation formulas, and advanced tracking strategies to optimize trading efficiency. Targeted at cryptocurrency traders, it helps enhance decision-making processes, risk management, and portfolio health. The logical flow begins with defining PNL, followed by differentiating realized from unrealized PNL, presenting calculation methods, and concluding with advanced tracking strategies.
9-25-2025, 7:05:56 PM
Recommended for You
Black Monday Crash And Investment Lessons

Black Monday Crash And Investment Lessons

Black Monday refers to significant events in the financial markets characterized by severe declines within a single trading day, with the Black Monday of 1987 serving as a prime example of market panic. This phenomenon serves as a reminder to investors that both traditional stock markets and the crypto market have risks and volatility that are key factors that cannot be ignored in investing.
12-22-2025, 6:10:13 AM
Building Blockchain Apps with Web3 JavaScript Library

Building Blockchain Apps with Web3 JavaScript Library

The article explores the Web3.js library as a pivotal tool for building blockchain applications, particularly on the Ethereum network. It addresses developers' needs for efficient smart contract interaction, account management, and real-time event subscriptions essential for decentralized applications. The discussion covers the library's technological significance, impact on market trends, investor relevance, and practical usage across sectors like DeFi and gaming. It emphasizes Web3.js as a cornerstone for creating secure and innovative blockchain solutions, appealing to developers, businesses, and investors focused on the decentralized economy.
12-22-2025, 6:09:43 AM
Top Memecoins to Watch for Potential Wealth Growth by 2025

Top Memecoins to Watch for Potential Wealth Growth by 2025

The article "Top Memecoins to Watch for Potential Wealth Growth by 2025" explores the emerging asset class of memecoins, highlighting five noteworthy tokens: Shiba Inu, Dogecoin, Floki Inu, Pepe, and Bonk. It caters to investors intrigued by the intersection of meme culture and cryptocurrency. The article systematically analyzes each memecoin's unique features, growth potential, and community engagement. Emphasizing volatility and risk, it guides readers on building a diverse portfolio in this niche. Aimed at investors seeking high-risk, high-reward opportunities, the content melds cultural relevance with investment insight for a comprehensive understanding of memecoin dynamics.
12-22-2025, 6:08:20 AM
Comprehensive Guide to Web3 JavaScript Libraries

Comprehensive Guide to Web3 JavaScript Libraries

This guide explores Web3.js, a vital JavaScript library enabling seamless interaction with Ethereum nodes for blockchain development. It traces the library's origins, its evolution from Ethereum's inception to supporting multiple blockchains, and highlights its impact on accessible blockchain application creation. The article discusses its primary use in smart contract management, particularly in decentralized finance (DeFi), underscoring its market influence and adoption. With insights into its capabilities like event subscriptions and account transactions, developers in finance, gaming, and beyond will find essential tools for building robust decentralized applications.
12-22-2025, 6:07:28 AM
Meme Coin Surge: Evaluating the Potential for SHIB, PEPE, and DOGE to Hit 1 USD

Meme Coin Surge: Evaluating the Potential for SHIB, PEPE, and DOGE to Hit 1 USD

This article dives into the intriguing question of whether meme coins like SHIB, PEPE, and DOGE can reach the $1 milestone. It examines key factors influencing their price potential, such as market cap limitations, community support, token burns, and utility developments. The article targets investors curious about meme coin growth and offers insights into historical trends, realistic price evaluations, and risks. Structured with comprehensive analysis, it guides readers through market dynamics, expert opinions, and critical investment considerations. It's an essential read for those gauging meme coin viability in the evolving crypto landscape.
12-22-2025, 6:06:19 AM
Exploring the Role of NFTs in the Web3 Ecosystem

Exploring the Role of NFTs in the Web3 Ecosystem

This article explores the transformative role of NFTs within the Web3 ecosystem, highlighting their impact on asset ownership, innovation, and value creation. Readers will gain insights into historical developments like CryptoKitties, diverse applications in art, gaming, real estate, and finance, and the investment landscape of Web3 NFTs. Addressing the needs of artists, collectors, and investors, the article discusses smart contracts, royalty streams, and financial mechanisms enhancing NFT utility. The structured overview emphasizes trends like metaverse integration, algorithmic art, and fractional ownership while optimizing keyword density for efficient scanning.
12-22-2025, 6:05:40 AM