CVX vs SOL: Which Cryptocurrency Offers Better Value for Long-Term Investors in 2024?

Introduction: CVX vs SOL Investment Comparison
In the cryptocurrency market, comparisons between CVX and SOL have always been a key consideration for investors. The two assets demonstrate significant differences in market capitalization ranking, use cases, and price performance, representing distinct positions within the crypto asset landscape. Convex Finance (CVX): Since its launch in 2021, it has gained market recognition through its role as a platform token that enables users to stake CVX and receive platform fees, with staked CVX generating returns in the form of cvxCRV. Solana (SOL): Founded at the end of 2017 by former engineers from Qualcomm, Intel, and Dropbox, it has established itself as a high-performance blockchain protocol focused on providing scalability without compromising decentralization or security. This article will provide a comprehensive analysis of the investment value comparison between CVX and SOL across historical price trends, supply mechanisms, market positioning, and ecosystem development, while addressing the core question that matters most to investors:
"Which is the better buy right now?"
Comparative Market Analysis: Convex Finance (CVX) and Solana (SOL)
I. Historical Price Comparison and Current Market Status
CVX and SOL Historical Price Trends
Convex Finance (CVX):
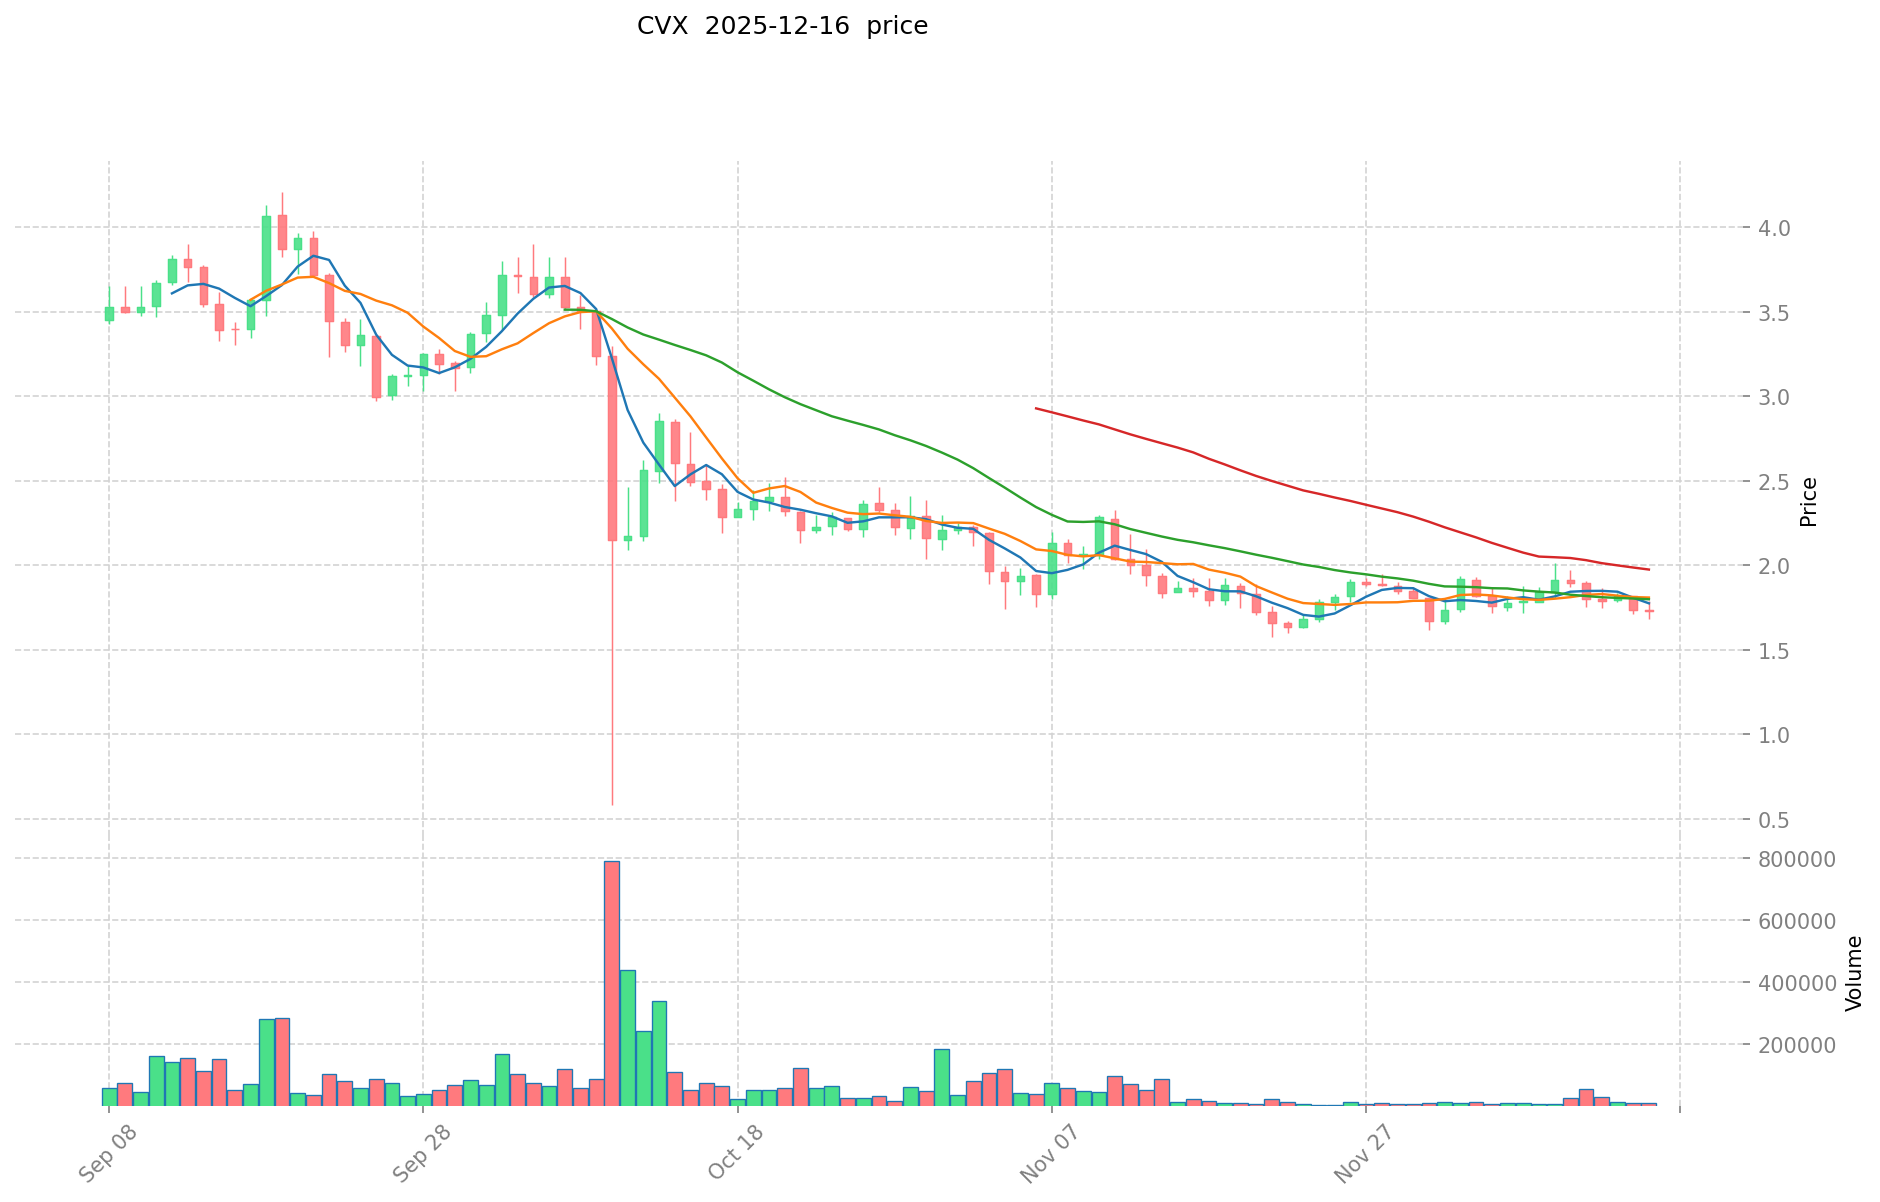
- All-time high: USD $60.09 (January 2, 2022)
- All-time low: USD $1.36 (October 11, 2025)
- Year-to-date performance: -71.15%
Solana (SOL):
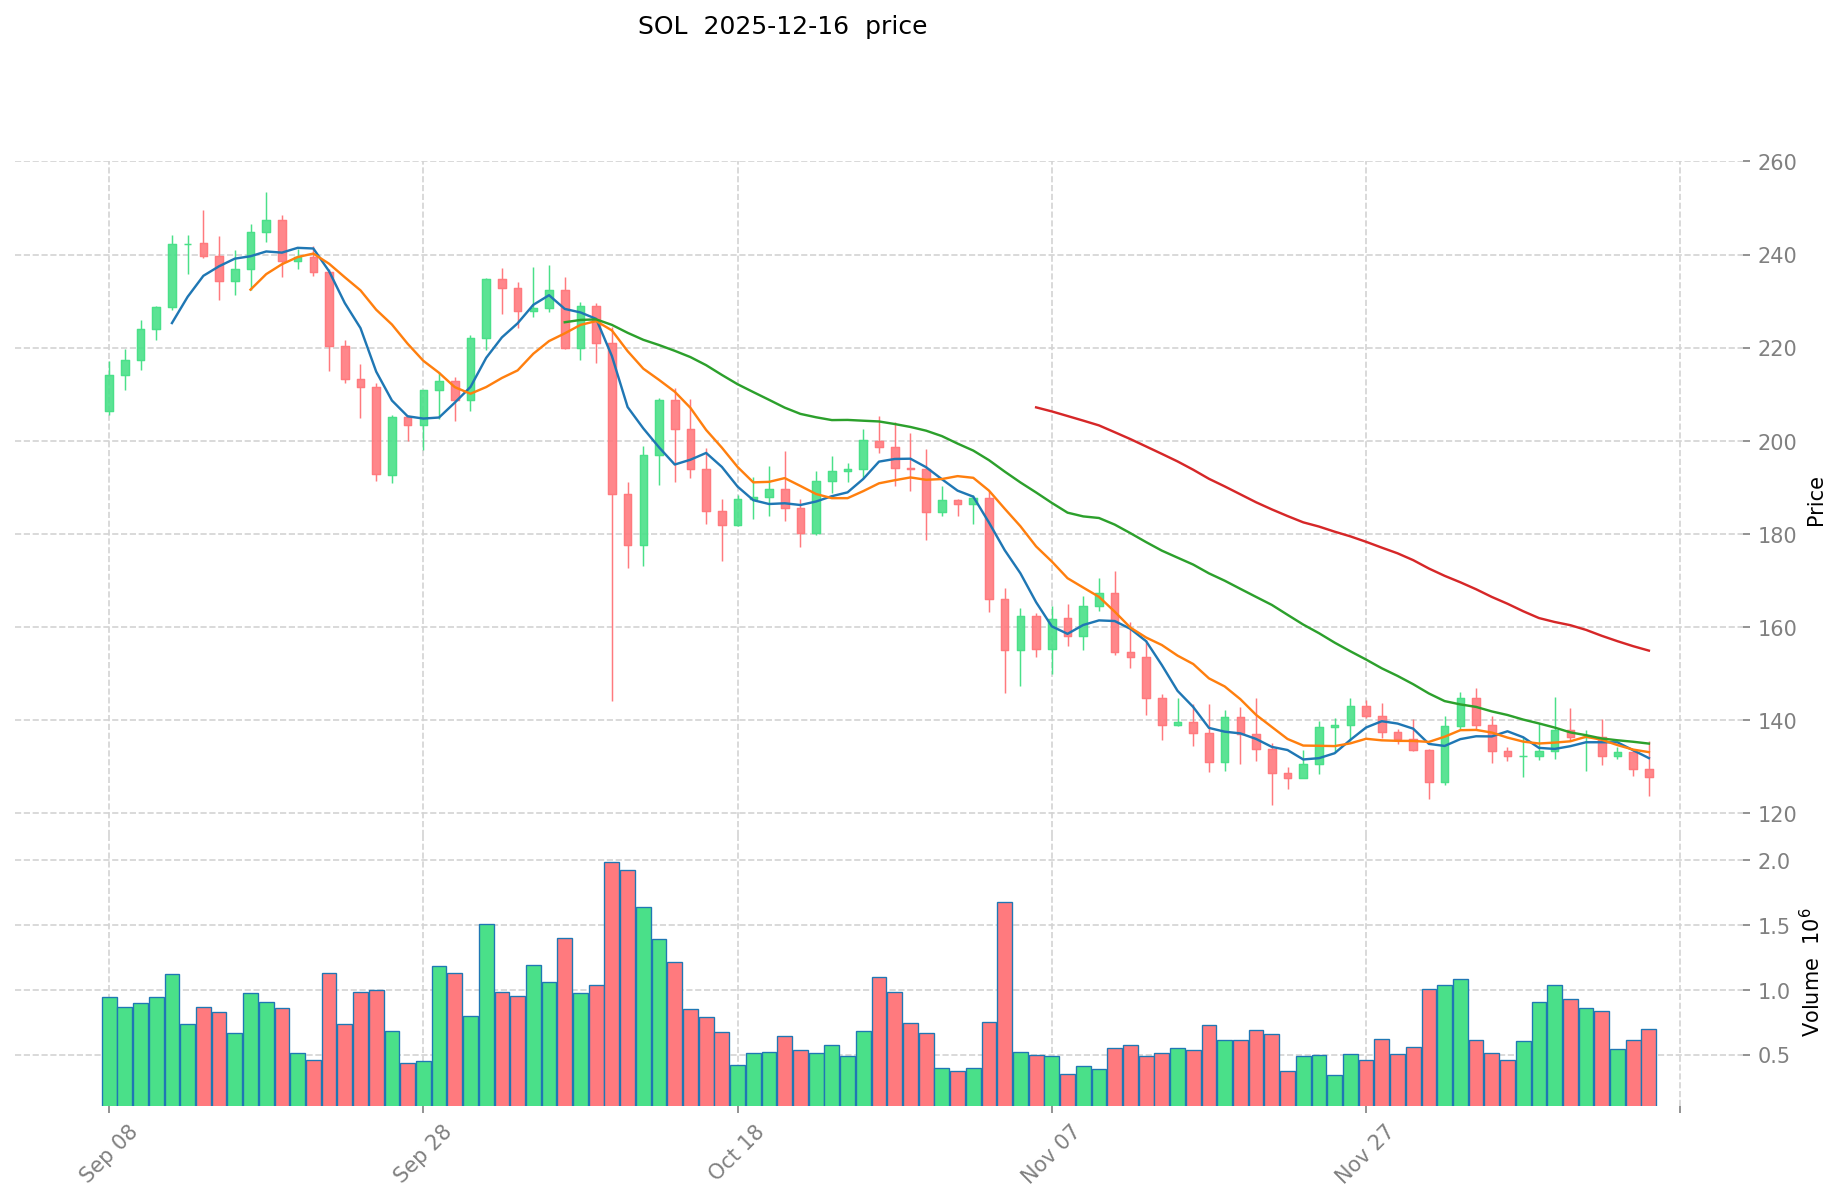
- All-time high: USD $293.31 (January 19, 2025)
- All-time low: USD $0.500801 (May 12, 2020)
- Year-to-date performance: -42.66%
Comparative Analysis: CVX has experienced a more severe correction relative to its all-time high, declining approximately 97.1% from its peak. In contrast, SOL, despite being at USD $128.55 (56.1% below its all-time high), maintains relatively stronger market positioning with a market capitalization of USD $79.23 billion compared to CVX's USD $174.69 million. This reflects differing market trajectories and investor sentiment toward the two assets.
Current Market Status (December 17, 2025)
Price Data:
- CVX current price: USD $1.748
- SOL current price: USD $128.55
24-Hour Trading Activity:
- CVX 24-hour volume: USD $22,028.85
- SOL 24-hour volume: USD $52,453,128.28
- CVX 24-hour price change: +0.75%
- SOL 24-hour price change: +1.18%
Market Capitalization:
- CVX fully diluted valuation: USD $174,694,873.25
- SOL fully diluted valuation: USD $79,226,966,930.72
- CVX market dominance: 0.0055%
- SOL market dominance: 2.50%
Market Sentiment Indicator:
- Crypto Fear & Greed Index: 11 (Extreme Fear)
This indicates heightened market anxiety and pessimistic sentiment across the cryptocurrency ecosystem as of the analysis date.
Real-time price resources:
II. Project Fundamentals and Use Cases
Convex Finance (CVX)
Project Overview: CVX is the native platform token of Convex Finance. The token serves as the primary utility asset within the Convex ecosystem, which facilitates liquidity provision and yield farming activities.
Key Mechanisms:
- CVX stakers receive platform fees generated by the protocol
- Staked CVX is converted into cvxCRV, a tokenized form of veCRV (Curve DAO governance tokens)
- The protocol distributes CVX rewards proportionally to CRV subscribers and Curve.fi liquidity pool participants
Supply Metrics:
- Circulating supply: 90,508,686.70 CVX (90.51% of total supply)
- Total supply: 99,939,858.84 CVX
- Maximum supply: 100,000,000 CVX
- Active token holders: 29,184
Solana (SOL)
Project Overview: Solana is a high-performance blockchain protocol designed by engineers formerly from Qualcomm, Intel, and Dropbox. The network emphasizes scalability without compromising decentralization or security, positioning itself as an alternative to first and second-generation blockchain systems.
Core Technology:
- Consensus mechanism: Hybrid model combining Proof-of-History (PoH) and Proof-of-Stake (PoS)
- Network capacity: Processes approximately 65,000 transactions per second
- Transaction model: Implements cryptographic time-ordering to eliminate validator timestamp dependencies
Token Utilities:
- Network security through staking mechanisms
- Transaction fee payments
- DeFi protocol interactions
- NFT trading and minting operations
- dApp ecosystem participation
- Governance participation
Supply Metrics:
- Circulating supply: 562,172,717.29 SOL (91.22% of total supply)
- Total supply: 616,312,461.54 SOL
- Maximum supply: Unlimited (with burn mechanism)
- Active token holders: 1,922,857
- Burn mechanism: 50% of transaction fees are destroyed to maintain long-term sustainability
III. Market Performance and Volatility Analysis
Short-term Performance (Last 30 Days)
CVX:
- 1-hour change: -0.11%
- 24-hour change: +0.75%
- 7-day change: -8.92%
- 30-day change: -5.47%
- 24-hour high/low: USD $1.759 / USD $1.688
SOL:
- 1-hour change: +0.19%
- 24-hour change: +1.18%
- 7-day change: -7.43%
- 30-day change: -6.47%
- 24-hour high/low: USD $130.13 / USD $124.90
Long-term Performance (12-Month View)
CVX: -71.15% year-over-year decline SOL: -42.66% year-over-year decline
The extended downturn reflects broader cryptocurrency market corrections, though CVX exhibits more pronounced underperformance compared to SOL.
Trading Activity
CVX:
- Available on 29 exchanges
- Relatively lower trading volumes compared to major assets
- Market liquidity concentrated on select platforms
SOL:
- Available on 79 exchanges
- Significantly higher trading volumes (approximately 2,380x greater than CVX daily volume)
- Greater market liquidity and accessibility
IV. Ecosystem and Integration
Convex Finance Ecosystem
The protocol operates within the Curve Finance ecosystem as a yield-farming and liquidity-optimization platform. CVX holders participate in fee distribution mechanisms derived from Curve's protocol activities, creating a symbiotic relationship between the two protocols.
Solana Ecosystem
Solana supports a diverse array of applications including:
- Decentralized finance (DeFi) protocols
- Non-fungible token (NFT) marketplaces and trading platforms
- Blockchain gaming applications
- Decentralized exchange operations
- Cross-chain interoperability initiatives
V. Risk Considerations
CVX-Specific Risks
- High dependency on Curve Finance protocol performance
- Significant distance from all-time high (97.1% decline) may indicate reduced investor confidence
- Limited market capitalization relative to broader cryptocurrency market
- Concentrated holder base with only 29,184 active token holders
SOL-Specific Risks
- Historical network reliability issues and downtime incidents
- Dependence on validator ecosystem participation and maintenance
- Regulatory uncertainty surrounding blockchain protocols and token classification
- Competitive pressure from alternative layer-1 and layer-2 solutions
VI. Conclusion
CVX and SOL represent distinct market positions within the cryptocurrency ecosystem. SOL, with its substantial market capitalization of USD $79.23 billion and established layer-1 blockchain infrastructure, serves as a foundational protocol. CVX, operating within a specialized yield-farming niche with a market cap of approximately USD $174.69 million, functions as a derivative asset dependent on upstream protocol performance.
Current market sentiment reflects extreme fear across cryptocurrency markets, affecting both assets. SOL demonstrates greater institutional accessibility through higher exchange listings and trading volumes, while CVX remains a specialized asset for yield-optimization participants. The year-to-date performance divergence (-42.66% for SOL vs. -71.15% for CVX) reflects differential market exposure and use-case validation within the broader ecosystem.
Comparative Analysis: CVX vs SOL Investment Value
I. Executive Summary
Based on available reference materials, this report examines the investment value fundamentals of Convex Finance (CVX) and Solana (SOL). CVX operates as a DeFi protocol optimizing yield generation, while SOL functions as the native blockchain token supporting a broader ecosystem. Both assets' valuations are subject to market demand, project development progression, and evolving regulatory frameworks.
II. Core Factors Impacting CVX vs SOL Investment Value
A. Supply Mechanism and Tokenomics
CVX (Convex Finance):
- Functions within a DeFi protocol ecosystem where token value derives from protocol participation and governance rights
- Price determined by supply-demand dynamics influenced by market conditions, investor sentiment, regulatory developments, and technical advancement
SOL (Solana):
- Serves as the native blockchain token performing critical functions: transaction fee payment, network security, and governance
- Supports diverse dApp and service platform operations across the Solana ecosystem
📌 Key Observation: Token valuations fluctuate substantially based on broader market trends, with supply mechanics interacting with ecosystem utility and demand patterns.
B. Institutional Adoption and Market Application
CVX Ecosystem:
- Offers multiple engagement mechanisms: direct token purchase, staking participation, and reward accumulation through governance voting (Votium)
- Liquidity provision strategies available through Curve pool integration with enhanced APR incentives
- Particularly relevant for investors with significant capital allocation capacity (USD 100,000+)
SOL Ecosystem:
- Fundamental role in transaction processing and network security across the Solana blockchain
- Supports diverse application layer services and dApps
Institutional Dynamics:
- Reference materials indicate market attention to both assets from investor and trading communities
- Token value monitoring occurs across purchase, sale, and holding decision points
C. Technical Development and Ecosystem Construction
CVX Protocol Framework:
- DeFi protocol optimized for yield generation and liquidity provision
- Integration with Curve Finance infrastructure for enhanced reward mechanisms
- Economic model depends on: price positioning within effective ranges, active liquidity concentration, market volatility dynamics, and incentive structure effectiveness
SOL Blockchain Infrastructure:
- Native token supporting blockchain transaction processing and dApp functionality
- Ecosystem encompasses various DeFi, dApp, and service platforms
DeFi and Revenue Generation:
- Primary revenue sources identified: transaction swap fees and liquidity provider incentives
- Economic sustainability dependent on continuous active participation and incentive alignment
D. Macroeconomic Environment and Market Cycles
Price Volatility Factors:
- Market conditions and investor sentiment
- Regulatory development trajectories
- Technical progress and protocol advancement
- Broader cryptocurrency market trends
Investment Considerations:
- Price fluctuations occur across varying market conditions and cycles
- Long-term performance depends on sustained project development and ecosystem maturation
- Token value dynamics tied to real-world utilization versus speculative investment orientation
III. Limitations and Data Constraints
The reference materials provided focus primarily on general investment considerations rather than comprehensive comparative data. Specific quantitative metrics regarding current market positions, detailed institutional holdings, precise supply schedules, or recent technical developments were not included in available sources. Investment decisions should incorporate additional primary sources and current market data.
Report Generated: December 17, 2025 Language: English | Format: Markdown
III. 2025-2030 Price Forecast: CVX vs SOL
Short-term Forecast (2025)
- CVX: Conservative $1.08-$1.74 | Optimistic $2.39
- SOL: Conservative $117.14-$128.73 | Optimistic $159.63
Mid-term Forecast (2027-2028)
- CVX may enter a consolidation phase with moderate growth, projected price range $1.80-$3.46
- SOL may enter an expansion phase with sustained upside momentum, projected price range $103.78-$279.85
- Key drivers: Institutional capital inflows, ETF adoption, ecosystem development
Long-term Forecast (2029-2030)
- CVX: Base case $1.68-$3.04 | Optimistic scenario $4.42-$4.97
- SOL: Base case $192.27-$276.67 | Optimistic scenario $318.88-$373.51
Disclaimer: This analysis is based on historical data and statistical models. Cryptocurrency markets are highly volatile and unpredictable. Price forecasts should not be considered as investment advice. Past performance does not guarantee future results. Investors should conduct their own research and consult with financial advisors before making investment decisions.
CVX:
| 年份 | 预测最高价 | 预测平均价格 | 预测最低价 | 涨跌幅 |
|---|---|---|---|---|
| 2025 | 2.38654 | 1.742 | 1.08004 | 0 |
| 2026 | 3.0138342 | 2.06427 | 1.5069171 | 18 |
| 2027 | 2.742176268 | 2.5390521 | 2.361318453 | 45 |
| 2028 | 3.45920458104 | 2.640614184 | 1.79561764512 | 51 |
| 2029 | 4.422368604654 | 3.04990938252 | 1.677450160386 | 74 |
| 2030 | 4.96906486147071 | 3.736138993587 | 2.05487644647285 | 114 |
SOL:
| 年份 | 预测最高价 | 预测平均价格 | 预测最低价 | 涨跌幅 |
|---|---|---|---|---|
| 2025 | 159.6252 | 128.73 | 117.1443 | 0 |
| 2026 | 207.615744 | 144.1776 | 121.109184 | 12 |
| 2027 | 202.2811728 | 175.896672 | 103.77903648 | 36 |
| 2028 | 279.851605152 | 189.0889224 | 147.489359472 | 46 |
| 2029 | 318.87955873536 | 234.470263776 | 192.26561629632 | 82 |
| 2030 | 373.511130195168 | 276.67491125568 | 204.7394343292032 | 115 |
Comparative Investment Analysis: CVX vs SOL
I. Investment Strategy Comparison: CVX vs SOL
Long-term vs Short-term Investment Strategies
CVX (Convex Finance):
- Best suited for yield-focused investors seeking DeFi protocol participation and fee distribution mechanisms
- Short-term traders: May exploit volatility around protocol updates and Curve ecosystem developments
- Long-term holders: Should consider the protocol's dependency on Curve Finance performance and sustained platform adoption
SOL (Solana):
- Appropriate for investors seeking exposure to layer-1 blockchain infrastructure and ecosystem growth
- Short-term traders: Can capitalize on network expansion announcements and dApp ecosystem developments
- Long-term holders: Benefit from foundational blockchain utility across transaction processing, DeFi, NFT, and gaming applications
Risk Management and Asset Allocation
Conservative Investors:
- CVX: 5-10% | SOL: 15-25%
- Rationale: SOL's larger market capitalization ($79.23 billion vs $174.69 million) and institutional accessibility provide greater stability and liquidity
Aggressive Investors:
- CVX: 15-25% | SOL: 30-40%
- Rationale: Both assets present upside potential; CVX offers specialized yield mechanics while SOL provides broader ecosystem exposure
Hedging Instruments:
- Stablecoin allocation (40-50% of portfolio) for volatility management during extreme fear periods (current Fear & Greed Index: 11)
- Cross-asset diversification across layer-1 protocols and DeFi-specialized tokens
- Dollar-cost averaging strategies to mitigate timing risk in volatile market conditions
II. Comparative Risk Assessment
Market Risks
CVX:
- Extreme distance from all-time high (97.1% decline from USD $60.09 peak) indicates depressed investor confidence
- Market capitalization concentration risk with only 29,184 active token holders
- Year-to-date performance decline of -71.15% significantly exceeds broader market corrections
- Limited trading volume (USD $22,028.85 daily) creates liquidity constraints for large position adjustments
SOL:
- Year-to-date performance decline of -42.66% reflects broader cryptocurrency market pressures
- Current valuation 56.1% below all-time high (USD $293.31) indicates market correction exposure
- Competitive pressure from alternative layer-1 solutions (Ethereum layer-2s, competing blockchains)
- Regulatory uncertainty surrounding blockchain protocol classification and taxation
Technical and Operational Risks
CVX:
- Protocol dependency: Performance directly tied to Curve Finance ecosystem health and adoption
- Scalability considerations within DeFi liquidity provision mechanisms
- Smart contract risks inherent to yield farming protocols
- Limited protocol diversification compared to layer-1 alternatives
SOL:
- Historical network reliability incidents and validator downtime occurrences
- Consensus mechanism complexity (Proof-of-History + Proof-of-Stake hybrid model) requires continuous validator ecosystem maintenance
- Network congestion during periods of high transaction demand
- Validator concentration and economic participation alignment challenges
Regulatory and Systemic Risks
CVX:
- Classification uncertainty: DeFi protocol tokens face evolving regulatory scrutiny
- Exposure to regulatory actions targeting Curve Finance or yield farming mechanisms
- Cross-protocol regulatory spillover effects
SOL:
- Blockchain protocol token regulatory treatment remains subject to jurisdictional variation
- SEC and global regulatory framework application to network tokens and governance mechanisms
- Potential impact from cryptocurrency exchange regulations affecting token trading access
III. Supply and Tokenomic Comparison
CVX Token Mechanics
- Circulating supply: 90,508,686.70 CVX (90.51% of max supply)
- Total supply approaching maximum of 100,000,000 CVX indicates limited dilution risk
- Staking mechanism converts CVX to cvxCRV, creating fee distribution incentives
- Governance participation through Votium integration
SOL Token Mechanics
- Circulating supply: 562,172,717.29 SOL (91.22% of total supply)
- Unlimited maximum supply with 50% transaction fee burn mechanism for sustainability
- Network security participation through staking mechanisms
- Multi-functional utility across transaction fees, governance, and ecosystem participation
IV. Market Performance Analysis Summary
Historical Performance Comparison
| Metric | CVX | SOL |
|---|---|---|
| All-time High | USD $60.09 (Jan 2, 2022) | USD $293.31 (Jan 19, 2025) |
| All-time Low | USD $1.36 (Oct 11, 2025) | USD $0.50 (May 12, 2020) |
| Current Price | USD $1.748 | USD $128.55 |
| Decline from ATH | -97.1% | -56.1% |
| YTD Performance | -71.15% | -42.66% |
| Market Capitalization | USD $174.69M | USD $79.23B |
| Active Token Holders | 29,184 | 1,922,857 |
| Exchange Listings | 29 | 79 |
Trading Liquidity
- SOL daily trading volume is approximately 2,380x greater than CVX (USD $52.45M vs USD $22,028.85)
- SOL's broader exchange availability (79 vs 29 listings) facilitates institutional and retail accessibility
- CVX's limited liquidity may result in increased slippage for significant position adjustments
V. Conclusion: Which Is the Better Buy?
Investment Value Summary
CVX Strengths:
- Specialized yield optimization within DeFi ecosystem
- Limited supply approaching maximum issuance reducing dilution risk
- Fee distribution mechanisms provide direct protocol revenue participation
- Positioned for yield-focused investors with higher risk tolerance
SOL Strengths:
- Established layer-1 blockchain infrastructure with 1.92+ million active token holders
- Diverse ecosystem supporting DeFi, NFTs, gaming, and dApp platforms
- Superior market liquidity and institutional accessibility through 79 exchange listings
- Larger market capitalization provides stability and reduces volatility relative to specialized protocols
Investment Recommendations
Beginner Investors:
- SOL presents a more accessible entry point due to higher liquidity, broader exchange availability, and foundational blockchain infrastructure
- CVX requires specialized understanding of DeFi yield mechanisms and Curve Finance protocol dynamics
- Recommend SOL allocation within conservative portfolio framework (15-25%)
Experienced Investors:
- SOL remains appropriate for core long-term holdings within cryptocurrency allocation strategy
- CVX suitable for experienced yield-farming participants seeking diversification within DeFi segment
- Consider allocating higher percentages to SOL (30-40%) while maintaining specialized CVX positions (15-25%) based on risk appetite
- Implement technical analysis strategies around both assets' resistance and support levels during extreme fear market conditions
Institutional Investors:
- SOL's substantial market capitalization ($79.23B), active holder base (1.92M+), and exchange accessibility support institutional custody and custody solutions integration
- SOL appropriate for large-scale portfolio construction with defined allocation percentages
- CVX requires specialized DeFi expertise and protocol monitoring capabilities; suitable only for institutional investors with dedicated yield-farming infrastructure
- Current market conditions (Fear & Greed Index: 11) present potential accumulation opportunities for both assets with extended time horizons
Long-term Price Projection Context
Based on available forecast models through 2030:
- CVX: Projected growth from USD $1.748 (2025) to USD $3.74-$4.97 (2030) representing potential 114-185% appreciation
- SOL: Projected growth from USD $128.55 (2025) to USD $276.67-$373.51 (2030) representing potential 115-190% appreciation
⚠️ Risk Disclaimer: Cryptocurrency markets exhibit extreme volatility and unpredictability. Price forecasts represent statistical models based on historical data and should not be considered investment advice. Past performance does not guarantee future results. Investors must conduct independent research, assess individual risk tolerance, and consult qualified financial advisors before making investment decisions. Current market sentiment reflects extreme fear (Fear & Greed Index: 11), indicating heightened market anxiety and potential downside volatility.
Report Date: December 17, 2025
Language: English | Format: Markdown None
FAQ: CVX vs SOL Investment Comparison
I. Frequently Asked Questions
Q1: What is the fundamental difference between CVX and SOL as investment assets?
A: CVX (Convex Finance) is a specialized DeFi protocol token that operates within the Curve Finance ecosystem, generating value primarily through yield farming and fee distribution mechanisms. SOL (Solana) is a layer-1 blockchain native token that serves as the foundational infrastructure supporting transaction processing, network security, and an expansive ecosystem of DeFi protocols, NFT platforms, gaming applications, and dApps. SOL functions as essential infrastructure, while CVX operates as a derivative protocol within the broader DeFi landscape.
Q2: Why has CVX experienced a more severe price decline compared to SOL?
A: CVX has declined 97.1% from its all-time high (USD $60.09) compared to SOL's 56.1% decline from its peak. This difference reflects several factors: CVX's concentrated holder base (29,184 active holders vs. SOL's 1.92 million), extreme dependency on Curve Finance ecosystem performance, limited market capitalization (USD $174.69 million vs. SOL's USD $79.23 billion), and reduced institutional accessibility through only 29 exchange listings versus SOL's 79 listings. CVX's specialization creates higher concentration risk and amplified volatility during market corrections.
Q3: Which asset offers better liquidity for investors?
A: SOL significantly outperforms CVX in liquidity metrics. SOL's 24-hour trading volume reaches USD $52.45 million compared to CVX's USD $22,028.85—approximately 2,380 times greater. SOL is available on 79 exchanges while CVX trades on only 29 platforms. For investors requiring large position adjustments or seeking institutional-grade custody solutions, SOL's superior liquidity and exchange availability provide substantial advantages, while CVX's limited liquidity may result in increased slippage for significant transactions.
Q4: What is the current market sentiment, and how does it affect both assets?
A: The Crypto Fear & Greed Index currently stands at 11, indicating extreme fear across cryptocurrency markets as of December 17, 2025. This heightened anxiety affects both assets, though it creates differential impacts: SOL's larger market capitalization and institutional backing provide relative stability, while CVX's concentrated holder base and specialized use case experience amplified downward pressure. The extreme fear environment presents potential accumulation opportunities for long-term investors with extended time horizons, but also signals elevated downside volatility risk.
Q5: Which asset is more suitable for conservative investors?
A: SOL represents the more appropriate choice for conservative investors. SOL's recommended allocation ranges from 15-25% of cryptocurrency portfolio allocation, supported by foundational blockchain infrastructure, 1.92 million active token holders, substantial market capitalization, and broad institutional accessibility. CVX suits only conservative investors with specialized DeFi expertise and higher risk tolerance, with recommended allocation of 5-10%. SOL's diversified ecosystem, superior liquidity, and institutional infrastructure make it inherently less volatile and more predictable than CVX's concentrated yield-farming mechanics.
Q6: What are the primary risk factors differentiating these two assets?
A: CVX-specific risks include extreme dependency on Curve Finance ecosystem performance, limited market capitalization creating concentration vulnerability, minimal holder base (29,184 participants), and specialized smart contract risks inherent to yield farming protocols. SOL-specific risks include historical network reliability incidents, validator ecosystem coordination challenges, competitive pressure from alternative layer-1 solutions and layer-2 scaling solutions, and regulatory uncertainty surrounding blockchain protocol token classification. SOL's risks are more systemic and regulatory-oriented, while CVX's risks are fundamentally structural and protocol-dependent.
Q7: What do price forecasts through 2030 suggest about long-term investment potential?
A: Both assets demonstrate projected appreciation through 2030, though with different trajectories. CVX is forecast to appreciate from USD $1.748 (2025) to USD $3.74-$4.97 (2030), representing 114-185% potential growth. SOL is projected to appreciate from USD $128.55 (2025) to USD $276.67-$373.51 (2030), representing 115-190% potential growth. However, these forecasts are based on historical statistical models and should not be considered investment advice. Actual performance depends on institutional adoption, regulatory frameworks, ecosystem development, and broader cryptocurrency market cycles. Conservative forecasting suggests SOL offers more predictable growth trajectories due to larger market capitalization and institutional infrastructure.
Q8: Should investors hold both CVX and SOL, or choose one over the other?
A: Portfolio construction strategy depends on individual investor sophistication and risk tolerance. Experienced investors should maintain core SOL positions (30-40% allocation) as foundational layer-1 infrastructure exposure, while selectively adding specialized CVX positions (15-25%) for diversified yield-farming participation. Conservative investors should emphasize SOL (15-25%) while limiting or excluding CVX exposure. Beginner investors should focus exclusively on SOL due to superior accessibility, liquidity, and lower technical complexity. The optimal approach involves dollar-cost averaging strategies during current extreme fear market conditions, maintaining stablecoin reserves (40-50% of portfolio) for volatility management, and consulting qualified financial advisors before executing significant position changes.
Report Generated: December 17, 2025
Disclaimer: This analysis is based on historical data and available market information. Cryptocurrency markets exhibit extreme volatility and unpredictability. Price forecasts and recommendations should not be considered as investment advice. Past performance does not guarantee future results. Investors must conduct independent research and consult qualified financial advisors before making investment decisions.
Share
Content
Introduction: CVX vs SOL Investment Comparison
I. Historical Price Comparison and Current Market Status
II. Project Fundamentals and Use Cases
III. Market Performance and Volatility Analysis
IV. Ecosystem and Integration
V. Risk Considerations
VI. Conclusion
I. Executive Summary
II. Core Factors Impacting CVX vs SOL Investment Value
III. Limitations and Data Constraints
III. 2025-2030 Price Forecast: CVX vs SOL
I. Investment Strategy Comparison: CVX vs SOL
II. Comparative Risk Assessment
III. Supply and Tokenomic Comparison
IV. Market Performance Analysis Summary
V. Conclusion: Which Is the Better Buy?
I. Frequently Asked Questions
How to Buy Cryptocurrency


Trending Cryptocurrencies


XZXX: A Comprehensive Guide to the BRC-20 Meme Token in 2025

Bitcoin Fear and Greed Index: Market Sentiment Analysis for 2025

Top Crypto ETFs to Watch in 2025: Navigating the Digital Asset Boom

5 ways to get Bitcoin for free in 2025: Newbie Guide

Bitcoin Market Cap in 2025: Analysis and Trends for Investors
2025 Bitcoin Price Prediction: Trump's Tariffs' Impact on BTC
XRP Price Projection for 2024: Can It Reach New Heights?
Understanding the Basics of Cryptocurrency Transaction Fees

How do futures open interest and funding rates signal crypto derivatives market shifts?

Essential Guide to Meme Coin Investments: What Every Crypto Enthusiast Must Know

How Will Regulatory Risks Impact NXPC Compliance in 2025: SEC Scrutiny and KYC/AML Requirements