2025 CATI Price Prediction: Expert Analysis and Market Forecast for Catizen Token


Introduction: CATI's Market Position and Investment Value
Catizen (CATI) stands as a pioneering GameFi token that combines casual gaming innovation with a revolutionary "PLAY-TO-AIRDROP" model, rewarding users with tokens within a comprehensive GameFi economy. Since its launch in September 2024, Catizen has established itself within the gaming and blockchain ecosystem, attracting over 100 million adventurers to its Meow Universe. As of December 2025, CATI maintains a market capitalization of approximately $23.31 million with a circulating supply of 382.68 million tokens, currently trading around $0.06091. This innovative token continues to play an increasingly important role in reshaping the play-to-earn gaming landscape through its distinctive tokenomics and community-driven approach.
This article will provide a comprehensive analysis of CATI's price trajectory and market dynamics, integrating historical price movements, market supply and demand patterns, ecosystem development, and broader economic factors to deliver professional price forecasts and practical investment strategies for 2025 and beyond.
CATI Market Analysis Report
I. CATI Price History Review and Current Market Status
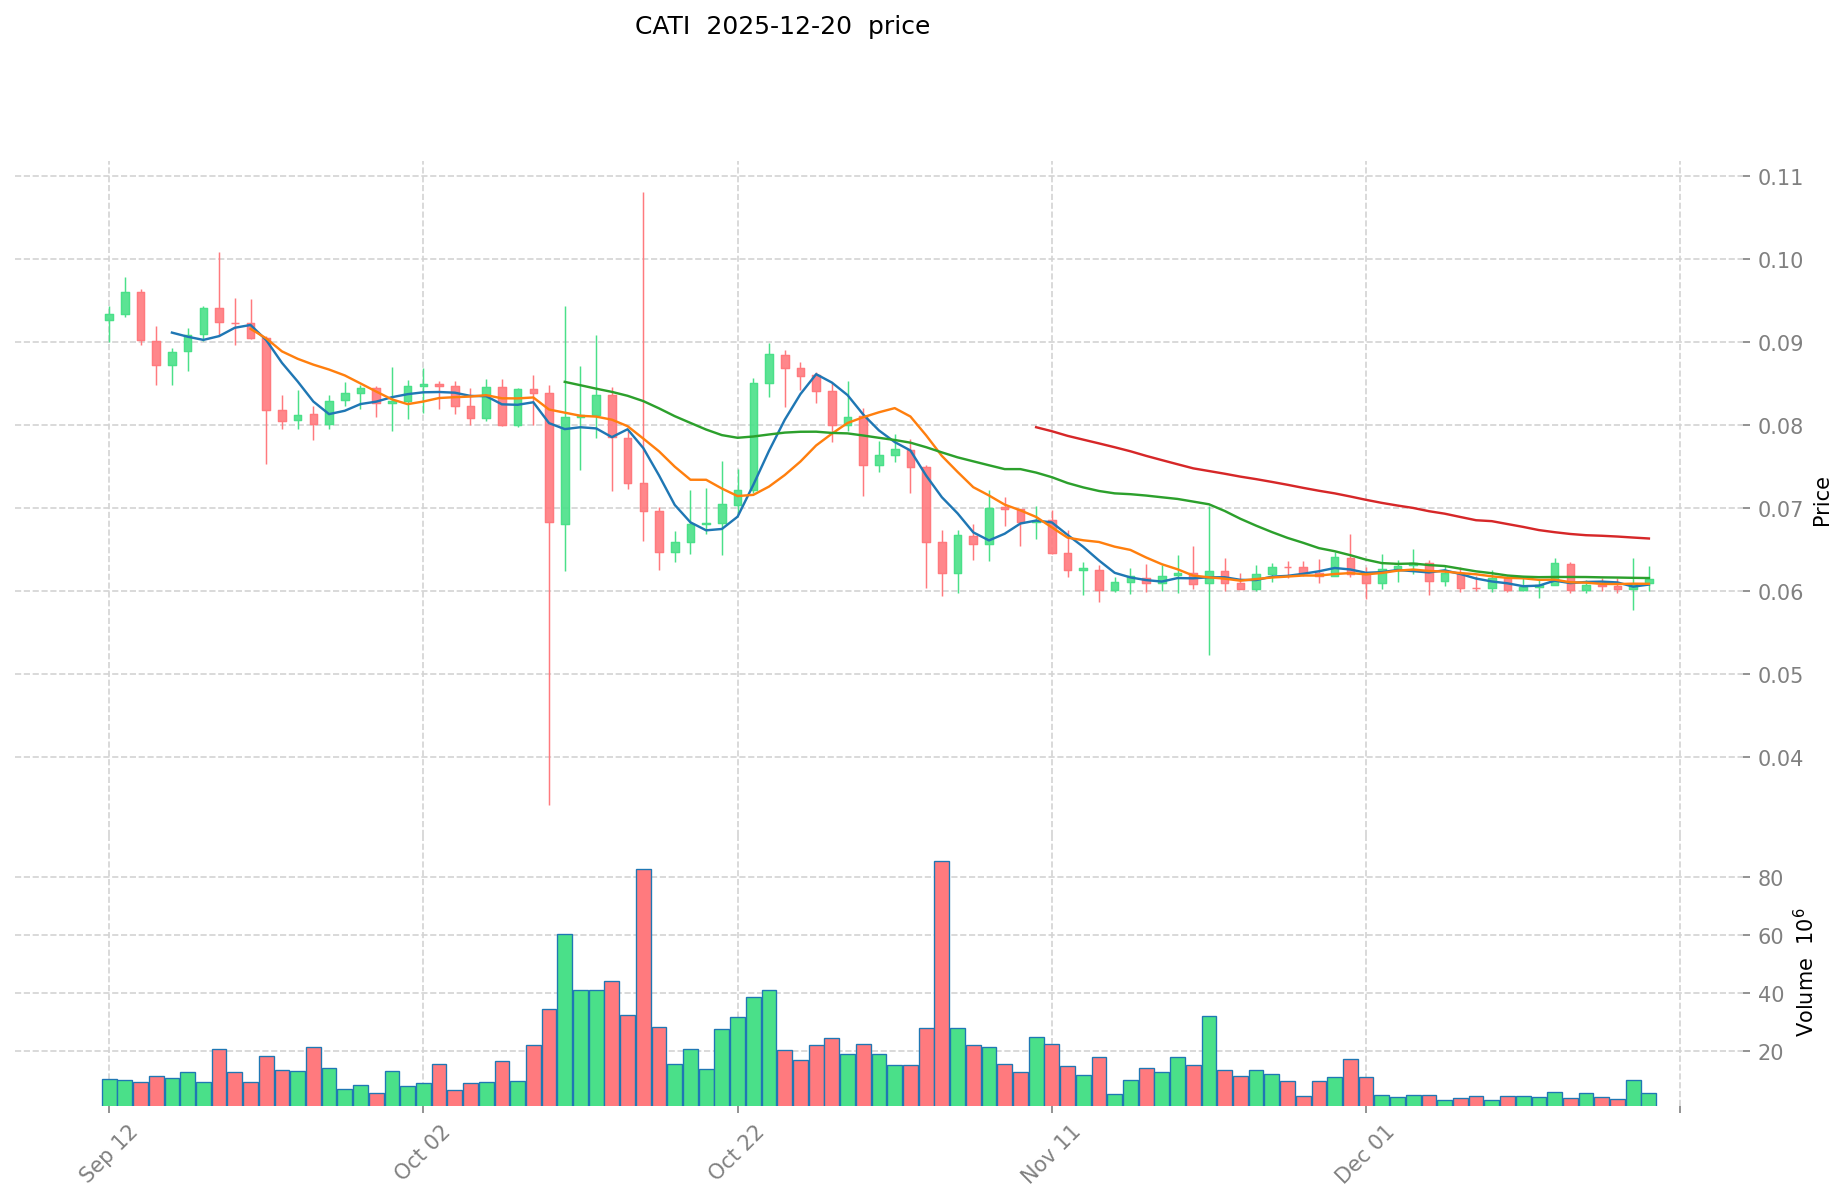
CATI Historical Price Movement
- September 20, 2024: Token reached its all-time high of $1.1274, representing the peak value since launch.
- October 10, 2025: Token declined to its all-time low of $0.0342, marking a significant correction of approximately 96.97% from the peak.
- December 20, 2025: Token currently trading at $0.06091, recovering from the low but still down 83.31% from all-time high on a one-year basis.
CATI Current Market Status
As of December 20, 2025, Catizen (CATI) is trading at $0.06091, with a 24-hour trading volume of approximately $333,865. The token has demonstrated modest upward movement over the past 24 hours with a +0.29% gain. However, the broader trend remains bearish, with the token declining 0.98% over the past seven days and 2.62% over the past month.
The token's market capitalization stands at approximately $23.31 million, while its fully diluted valuation is $60.91 million, indicating that the circulating supply represents about 38.27% of the total supply. CATI maintains a market dominance of 0.0019% and ranks 807th by market capitalization among all cryptocurrencies.
With 1,634,178 token holders and availability on 32 exchanges, CATI demonstrates a reasonably distributed user base. The token operates on the TON blockchain using the Jetton standard, reflecting its integration within the TON ecosystem.
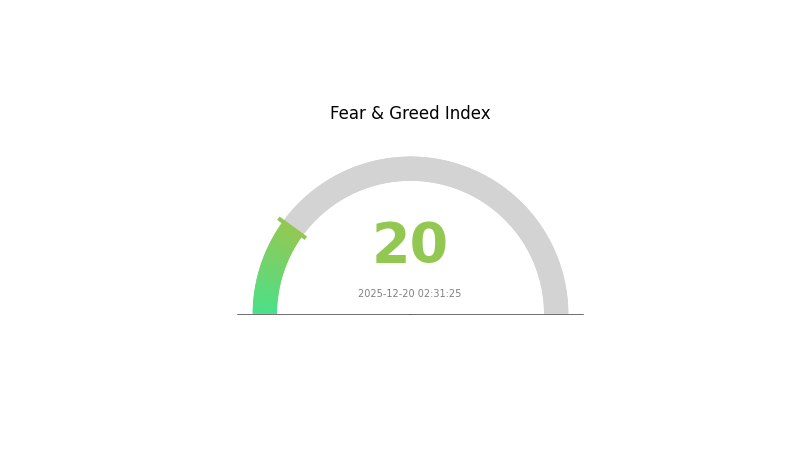
Current market sentiment shows extreme fear (VIX: 20), which may be contributing to overall weakness in token valuations across the broader market.
Click to view current CATI market price
CATI Market Sentiment Index
2025-12-20 Fear and Greed Index: 20 (Extreme Fear)
Click to view the current Fear & Greed Index
The crypto market is currently experiencing extreme fear, with the Fear and Greed Index plummeting to 20. This indicates heightened market anxiety and pessimistic sentiment among investors. During such periods, market volatility typically increases as traders become risk-averse. However, historical patterns suggest that extreme fear often precedes market recovery opportunities. Experienced investors may view this as a potential accumulation phase, while risk-averse participants should exercise caution and conduct thorough research before making investment decisions. Monitor key support levels and market developments closely on Gate.com for trading opportunities.
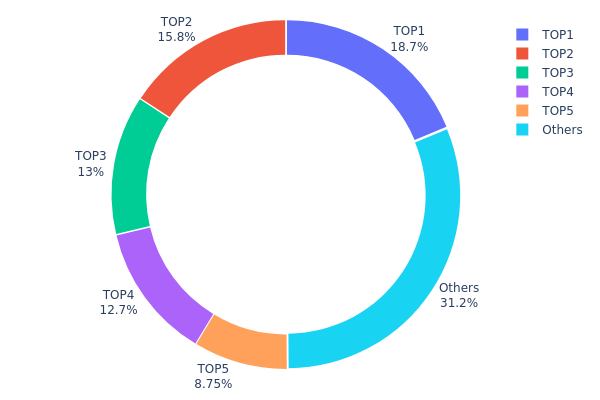
CATI Holding Distribution
The address holding distribution chart illustrates the concentration of token ownership across the network by tracking the percentage of total supply held by individual addresses. This metric serves as a critical indicator of market structure, liquidity dynamics, and potential systemic risks associated with token concentration.
Current analysis of CATI's holding distribution reveals moderate concentration characteristics. The top five addresses collectively control 68.83% of the total supply, with the largest holder commanding 18.73%. While the leading address represents a substantial stake, the distribution across the top five holders demonstrates a relatively balanced structure compared to extreme concentration scenarios. Notably, the remaining 31.17% distributed among other addresses indicates that nearly one-third of the supply is held outside the top five positions, suggesting some degree of decentralization at the secondary level.
The current holding pattern presents mixed implications for market structure and price stability. The concentration among the top five addresses could theoretically influence price movements through coordinated activity or large redemptions. However, the meaningful portion held by smaller address clusters may provide natural support against extreme volatility. The distribution pattern suggests the token has progressed beyond highly concentrated early-stage structures while maintaining influential institutional or major stakeholder positions. This configuration indicates CATI maintains a moderately decentralized on-chain structure, though investors should remain cognizant that significant price impact remains possible through concentrated holder decisions.
Click to view current CATI holding distribution
| Top | Address | Holding Qty | Holding (%) |
|---|---|---|---|
| 1 | UQA1BD...UTzHhN | 187325.00K | 18.73% |
| 2 | UQD4uG...tTYCQx | 157511.55K | 15.75% |
| 3 | UQBpKu...08QpdX | 129559.51K | 12.95% |
| 4 | UQADF1...EMtH54 | 126562.50K | 12.65% |
| 5 | UQDwO7...5LVfk4 | 87500.00K | 8.75% |
| - | Others | 311541.44K | 31.17% |
II. Core Factors Affecting CATI's Future Price
Supply Mechanism
-
Token Supply and Allocation Structure: CATI's total supply and distribution ratio directly impact token scarcity. Investors need to closely monitor the token's total quantity and allocation proportions, as these factors directly influence token scarcity and price volatility.
-
Staking Mechanism: The staking mechanism plays a crucial role in affecting CATI's price dynamics. This mechanism directly impacts the token's scarcity and price fluctuation characteristics.
Market Sentiment and Adoption
-
User Adoption Rate: Price movements reflect market sentiment, user acceptance degree, and external factors. As the Catizen player base expands and new features are introduced, CATI token is expected to experience price appreciation. Industry analysis predicts that by 2025, with the expansion of Catizen's player foundation and the rollout of new features, CATI token may climb to between $1 and $2.
-
Market Dynamics: The market currently exhibits clear long-short games between buyers and sellers who are observing future trends, resulting in a wash-out phase. Despite short-term price recoveries, the overall market remains filled with uncertainty.
III. 2025-2030 CATI Price Forecast
2025 Outlook
- Conservative Forecast: $0.03467 - $0.06083
- Neutral Forecast: $0.06083
- Bullish Forecast: $0.0876 (requires sustained market momentum and positive ecosystem developments)
2026-2028 Mid-term Outlook
- Market Stage Expectation: Gradual recovery and accumulation phase with increasing institutional interest and ecosystem expansion
- Price Range Forecast:
- 2026: $0.05492 - $0.09277 (+21% growth potential)
- 2027: $0.07764 - $0.11688 (+37% growth potential)
- 2028: $0.07714 - $0.13625 (+64% growth potential)
- Key Catalysts: Protocol upgrades, partnership announcements, growing DeFi integration, increased adoption metrics, and overall market sentiment improvement
2029-2030 Long-term Outlook
- Base Case Scenario: $0.06739 - $0.15369 (assumes steady adoption, stable regulatory environment, and continued market development)
- Bullish Scenario: $0.11822 - $0.20121 (assumes accelerated mainstream adoption, successful technology implementations, and favorable market conditions)
- Transformative Scenario: $0.20121+ (requires breakthrough applications, major institutional adoption waves, or significant macroeconomic tailwinds favoring crypto assets)
December 20, 2025: CATI remains positioned within mid-range valuations, with 2030 projections suggesting potential doubling potential under optimistic scenarios, representing a 123% cumulative gain from current baseline assumptions.
| 年份 | 预测最高价 | 预测平均价格 | 预测最低价 | 涨跌幅 |
|---|---|---|---|---|
| 2025 | 0.0876 | 0.06083 | 0.03467 | 0 |
| 2026 | 0.09277 | 0.07421 | 0.05492 | 21 |
| 2027 | 0.11688 | 0.08349 | 0.07764 | 37 |
| 2028 | 0.13625 | 0.10019 | 0.07714 | 64 |
| 2029 | 0.15369 | 0.11822 | 0.06739 | 94 |
| 2030 | 0.20121 | 0.13595 | 0.09381 | 123 |
Catizen (CATI) Professional Investment Strategy and Risk Management Report
IV. CATI Professional Investment Strategy and Risk Management
CATI Investment Methodology
(1) Long-term Holding Strategy
- Target Investors: GameFi enthusiasts, crypto asset accumulation participants, believers in the PLAY-TO-AIRDROP model
- Operation Recommendations:
- Dollar-cost averaging (DCA) approach to accumulate CATI during market volatility, with fixed periodic investments to reduce timing risk
- Hold for minimum 6-12 months to benefit from potential network growth as Catizen's user base expands beyond 100 million adventurers
- Monitor project development milestones and token economics updates from official channels
(2) Active Trading Strategy
- Technical Analysis Tools:
- Support and Resistance Levels: Use 24-hour high of $0.06308 and 24-hour low of $0.06001 as reference points for intraday trading decisions
- Moving Averages: Track medium-term trend direction with 7-day performance showing -0.98% decline to identify potential entry points
- Swing Trading Key Points:
- Monitor 24-hour volume at $333,865 for liquidity confirmation before executing large orders
- Capitalize on the -83.31% year-over-year decline, which may indicate capitulation or establish accumulation zones for contrarian traders
CATI Risk Management Framework
(1) Asset Allocation Principles
- Conservative Investors: 1-3% portfolio allocation for exploratory GameFi exposure
- Active Investors: 3-8% allocation as part of diversified gaming and Web3 entertainment positions
- Professional Investors: Up to 10-15% allocation with strategic hedging across multiple GameFi tokens
(2) Risk Hedging Solutions
- Token Volatility Hedging: Maintain stablecoin reserves (USDT/USDC) equal to 50% of CATI holdings to capitalize on price rebounds
- Portfolio Diversification: Balance CATI holdings with other established GameFi protocols to reduce concentration risk
(3) Secure Storage Solutions
- Hot Wallet Solution: Gate.com Web3 Wallet for active trading and frequent transactions with optimal security-convenience balance
- Cold Storage Approach: For long-term holding positions exceeding 6 months, transfer CATI to hardware wallets supporting TON Chain to ensure maximum security
- Security Precautions: Enable two-factor authentication on all exchange accounts, never share private keys or seed phrases, verify contract addresses before token transfers (contract: EQD-cvR0Nz6XAyRBvbhz-abTrRC6sI5tvHvvpeQraV9UAAD7 on TON Chain)
V. CATI Potential Risks and Challenges
CATI Market Risk
- Extreme Volatility: CATI has declined 83.31% over the past year, with all-time high of $1.1274 (September 20, 2024) versus current price of $0.06091, indicating significant price instability typical of emerging GameFi tokens
- Liquidity Risk: 24-hour trading volume of $333,865 is relatively modest, which may constrain large position exits during adverse market conditions
- Price Recovery Uncertainty: Current market cap of $23.3 million against fully diluted valuation of $60.91 million suggests potential further dilution risk as token circulates increase
CATI Regulatory Risk
- Gaming Classification Uncertainty: Regulatory authorities may reclassify blockchain-based gaming tokens, potentially imposing restrictions on PLAY-TO-AIRDROP mechanics or token distribution
- Jurisdictional Constraints: Different countries maintain varying approaches to gaming tokens and play-to-earn mechanisms, creating compliance complexity for Catizen's global operations
- Airdrop Regulation: Government agencies may establish new frameworks governing token airdrops as promotional mechanisms, potentially affecting Catizen's core business model
CATI Technical Risk
- TON Chain Dependency: Catizen operates exclusively on TON blockchain; any critical vulnerability or network disruption could directly impact CATI utility and value
- Smart Contract Risk: GameFi contracts require continuous security audits; undetected vulnerabilities could result in funds losses and diminished token confidence
- Ecosystem Competition: Rapid proliferation of alternative GameFi projects and casual gaming tokens may fragment user adoption and reduce Catizen's competitive moat
VI. Conclusion and Action Recommendations
CATI Investment Value Assessment
Catizen presents a speculative opportunity within the GameFi sector, leveraging innovative PLAY-TO-AIRDROP mechanics to differentiate from traditional gaming finance models. The project's ambitious goal of uniting over 100 million users demonstrates significant potential, yet the 83.31% year-over-year decline raises serious concerns about market reception and tokenomics sustainability. With 38.27% circulating supply against fully diluted valuation, investors face considerable dilution risk. Current technical position near recent lows ($0.0342 from October 10, 2025) presents potential recovery opportunities for risk-tolerant participants, but fundamental challenges surrounding user retention, regulatory clarity, and competitive differentiation remain unresolved.
CATI Investment Recommendations
✅ Beginners: Start with minimal allocation (0.5-1% of portfolio) through Gate.com's spot trading to understand PLAY-TO-AIRDROP mechanics without excessive capital risk; focus on educational resources and official documentation before scaling position
✅ Experienced Investors: Implement systematic DCA strategy during consolidation periods; use technical resistance at $0.06308 and support at $0.06001 to optimize entry points; maintain 50% cash reserves for opportunistic accumulation
✅ Institutional Investors: Conduct comprehensive due diligence on Catizen's user growth metrics, token burn mechanisms, and revenue sustainability; consider small exploratory positions (2-5%) while monitoring project development roadmap and governance evolution
CATI Trading Participation Methods
- Spot Trading: Purchase CATI directly via Gate.com platform using BTC, ETH, or stablecoin pairs for immediate ownership and long-term holding
- Limit Orders: Set predetermined buy orders at key support levels ($0.06001, $0.05500) to execute disciplined entry strategies without manual monitoring
- Gate.com staking Programs: Explore any available CATI staking or yield opportunities through Gate.com to generate passive returns while maintaining position exposure
Cryptocurrency investment carries extreme risk and volatility. This report does not constitute investment advice. Investors should make decisions based on their individual risk tolerance and financial situation. Consult with professional financial advisors before deploying capital. Never invest funds you cannot afford to lose completely. CATI's 83.31% annual decline and speculative nature warrant particular caution.
FAQ
Will the cati price increase?
Yes, CATI price is expected to increase by 8.74% and reach $0.04757 by December 29, 2025, based on current market analysis and price prediction indicators.
What is the price prediction for Cati token in 2025?
Based on market analysis, Cati token price prediction for 2025 ranges from $0.06006 to $0.40631, with an estimated average of $0.1195.
What is the price target for Cati?
The price target for Cati is $0.1127, based on current market analysis and user input. This prediction reflects potential upside momentum, though actual prices may fluctuate based on market conditions and trading volume.
Will cat coin reach $1?
Cat coin reaching $1 is highly unlikely. The token would need astronomical growth of millions of percent. Current market analysis and price predictions do not support this target being achieved in the foreseeable future.
Share
Content
Introduction: CATI's Market Position and Investment Value
I. CATI Price History Review and Current Market Status
II. Core Factors Affecting CATI's Future Price
III. 2025-2030 CATI Price Forecast
IV. CATI Professional Investment Strategy and Risk Management
V. CATI Potential Risks and Challenges
VI. Conclusion and Action Recommendations
FAQ
How to Buy Cryptocurrency


Trending Cryptocurrencies


2025 ELDE Price Prediction: Analyzing Market Trends and Potential Growth Factors for the Cryptocurrency

2025 CATI Price Prediction: Expert Analysis and Market Forecast for the Coming Year

2025 ALICE Price Prediction: Expert Analysis and Market Forecast for the Coming Year

2025 GUN Price Prediction: Expert Analysis and Market Forecast for the Year Ahead
2025 COPI Price Prediction: Analyzing Market Trends and Growth Potential in the Evolving Digital Asset Landscape

2025 GEMS Price Prediction: Will This Gaming Token Surge to New Heights?

Is Morpher (MPH) a good investment?: A Comprehensive Analysis of Features, Market Potential, and Risk Factors for 2024

Is Soil (SOIL) a good investment?: A Comprehensive Analysis of Price Potential, Use Cases, and Market Outlook for 2024

Is Creditlink (CDL) a good investment?: A Comprehensive Analysis of Performance, Risk Factors, and Future Prospects

Is Swarm Markets (SMTX) a good investment?: A Comprehensive Analysis of Tokenomics, Market Position, and Future Growth Potential
How to Purchase Slushie Capital (SLUSH) Token – A Comprehensive Guide