 Trusted Editorial content, reviewed by leading industry experts and seasoned editors. Ad Disclosure
Bitcoin is struggling to regain the $88,000 level as market uncertainty persists and precious metals continue to rally aggressively. Gold’s strength has reignited a familiar narrative: that capital is leaving Bitcoin to finance the move into traditional safe havens. However, a recent report by CryptoQuant challenges this assumption, suggesting that the current market dynamics are being misinterpreted.
Trusted Editorial content, reviewed by leading industry experts and seasoned editors. Ad Disclosure
Bitcoin is struggling to regain the $88,000 level as market uncertainty persists and precious metals continue to rally aggressively. Gold’s strength has reignited a familiar narrative: that capital is leaving Bitcoin to finance the move into traditional safe havens. However, a recent report by CryptoQuant challenges this assumption, suggesting that the current market dynamics are being misinterpreted.
Related Reading: Bitcoin Supply In Loss Turns Up: A Potential Bear Market SignalOn-chain data indicates that Bitcoin sell-offs are not directly funding the surge in gold and other metals. Instead, liquidity appears to be pausing rather than fleeing the crypto market altogether. This behavior is reflected in the Stablecoin Supply Ratio (SSR), a metric designed to measure the purchasing power of stablecoins relative to Bitcoin’s market capitalization. The SSR offers insight into whether capital is already deployed into BTC or sitting on the sidelines, waiting for clearer conditions.
A lower SSR implies higher latent buying power, meaning stablecoins hold significant capacity to re-enter the market. Conversely, a higher SSR signals that liquidity has largely been committed to Bitcoin. Current readings suggest that capital remains in stablecoins, indicating caution rather than outright risk aversion.
In this context, Bitcoin’s weakness below $88K reflects hesitation, not abandonment. While metals benefit from defensive positioning, on-chain signals point to liquidity waiting for a renewed catalyst in crypto, rather than rotating decisively away from it.
Stablecoin Liquidity Signals a Pause, Not a Capital Exit
The report adds important context by outlining key Stablecoin Supply Ratio (SSR) levels and how they frame Bitcoin’s current market structure. Historically, the SSR has oscillated within well-defined ranges. Readings above 15–16 indicate that stablecoin purchasing power is low, meaning liquidity has largely been deployed into Bitcoin.
Values between 10 and 15 represent a neutral zone, commonly associated with consolidation phases. When the SSR drops below 10–11, latent purchasing power is high, a condition that has often preceded bullish phases. Importantly, these thresholds provide structural context rather than precise timing signals.
At present, the SSR stands at 12.57, down sharply from recent highs in the 18–19 range. This decline signals a transition from fully deployed liquidity toward capital sitting on the sidelines. Despite price weakness, Bitcoin remains structurally stable, suggesting that capital is not exiting the crypto market but waiting for clearer conditions before re-entering.
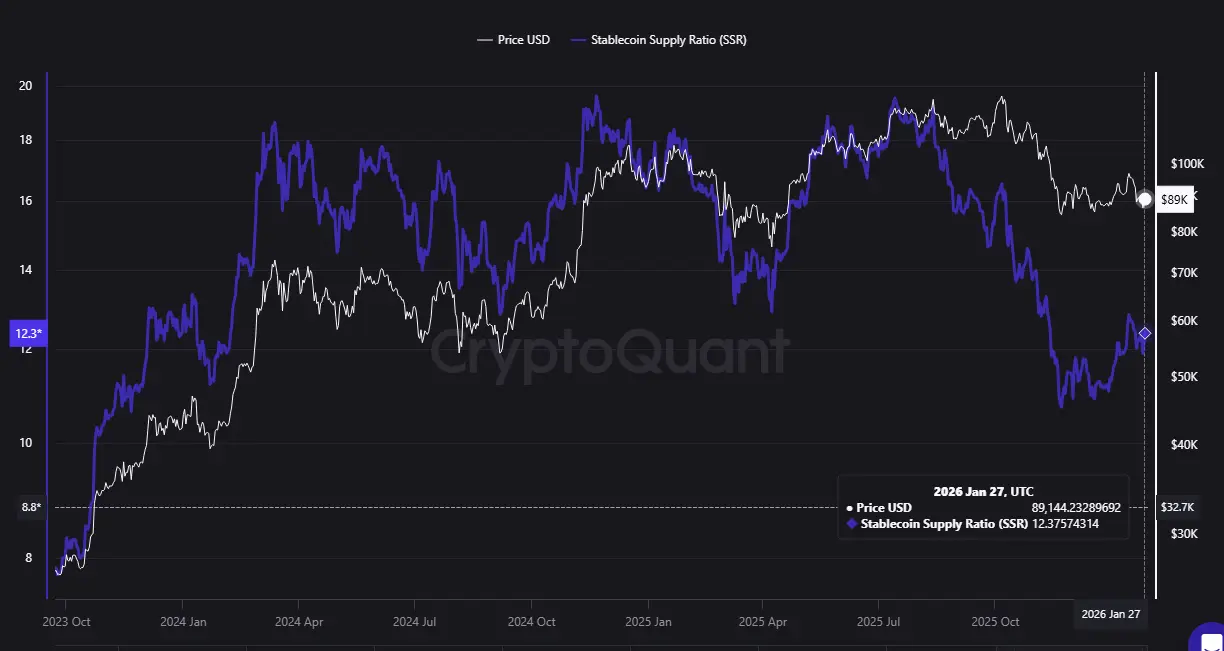 Stablecoin Supply Ratio | Source: CryptoQuantCrucially, the ongoing rally in gold should not be interpreted as a direct consequence of Bitcoin selling. Large allocators typically operate within diversified, multi-asset frameworks, maintaining exposure across equities, precious metals, digital assets, and stablecoins simultaneously. The lower SSR confirms that capital is not rotating out of Bitcoin into gold, but reallocating risk while remaining within the crypto ecosystem.
Related Reading: VIX–Bitcoin Correlation Re-Emerges Amid Political And Monetary Uncertainty
Bitcoin Price Remains Below Key Moving Averages
Bitcoin continues to trade under pressure, with price slipping back toward the $87,500–$88,000 zone after another failed attempt to regain momentum above the short-term moving averages. On the daily chart, BTC remains decisively below the 50-day and 100-day averages, both of which are now sloping downward and acting as dynamic resistance. The 200-day moving average, still trending higher above $100,000, reinforces the idea that the broader cycle has shifted from expansion to consolidation or correction.
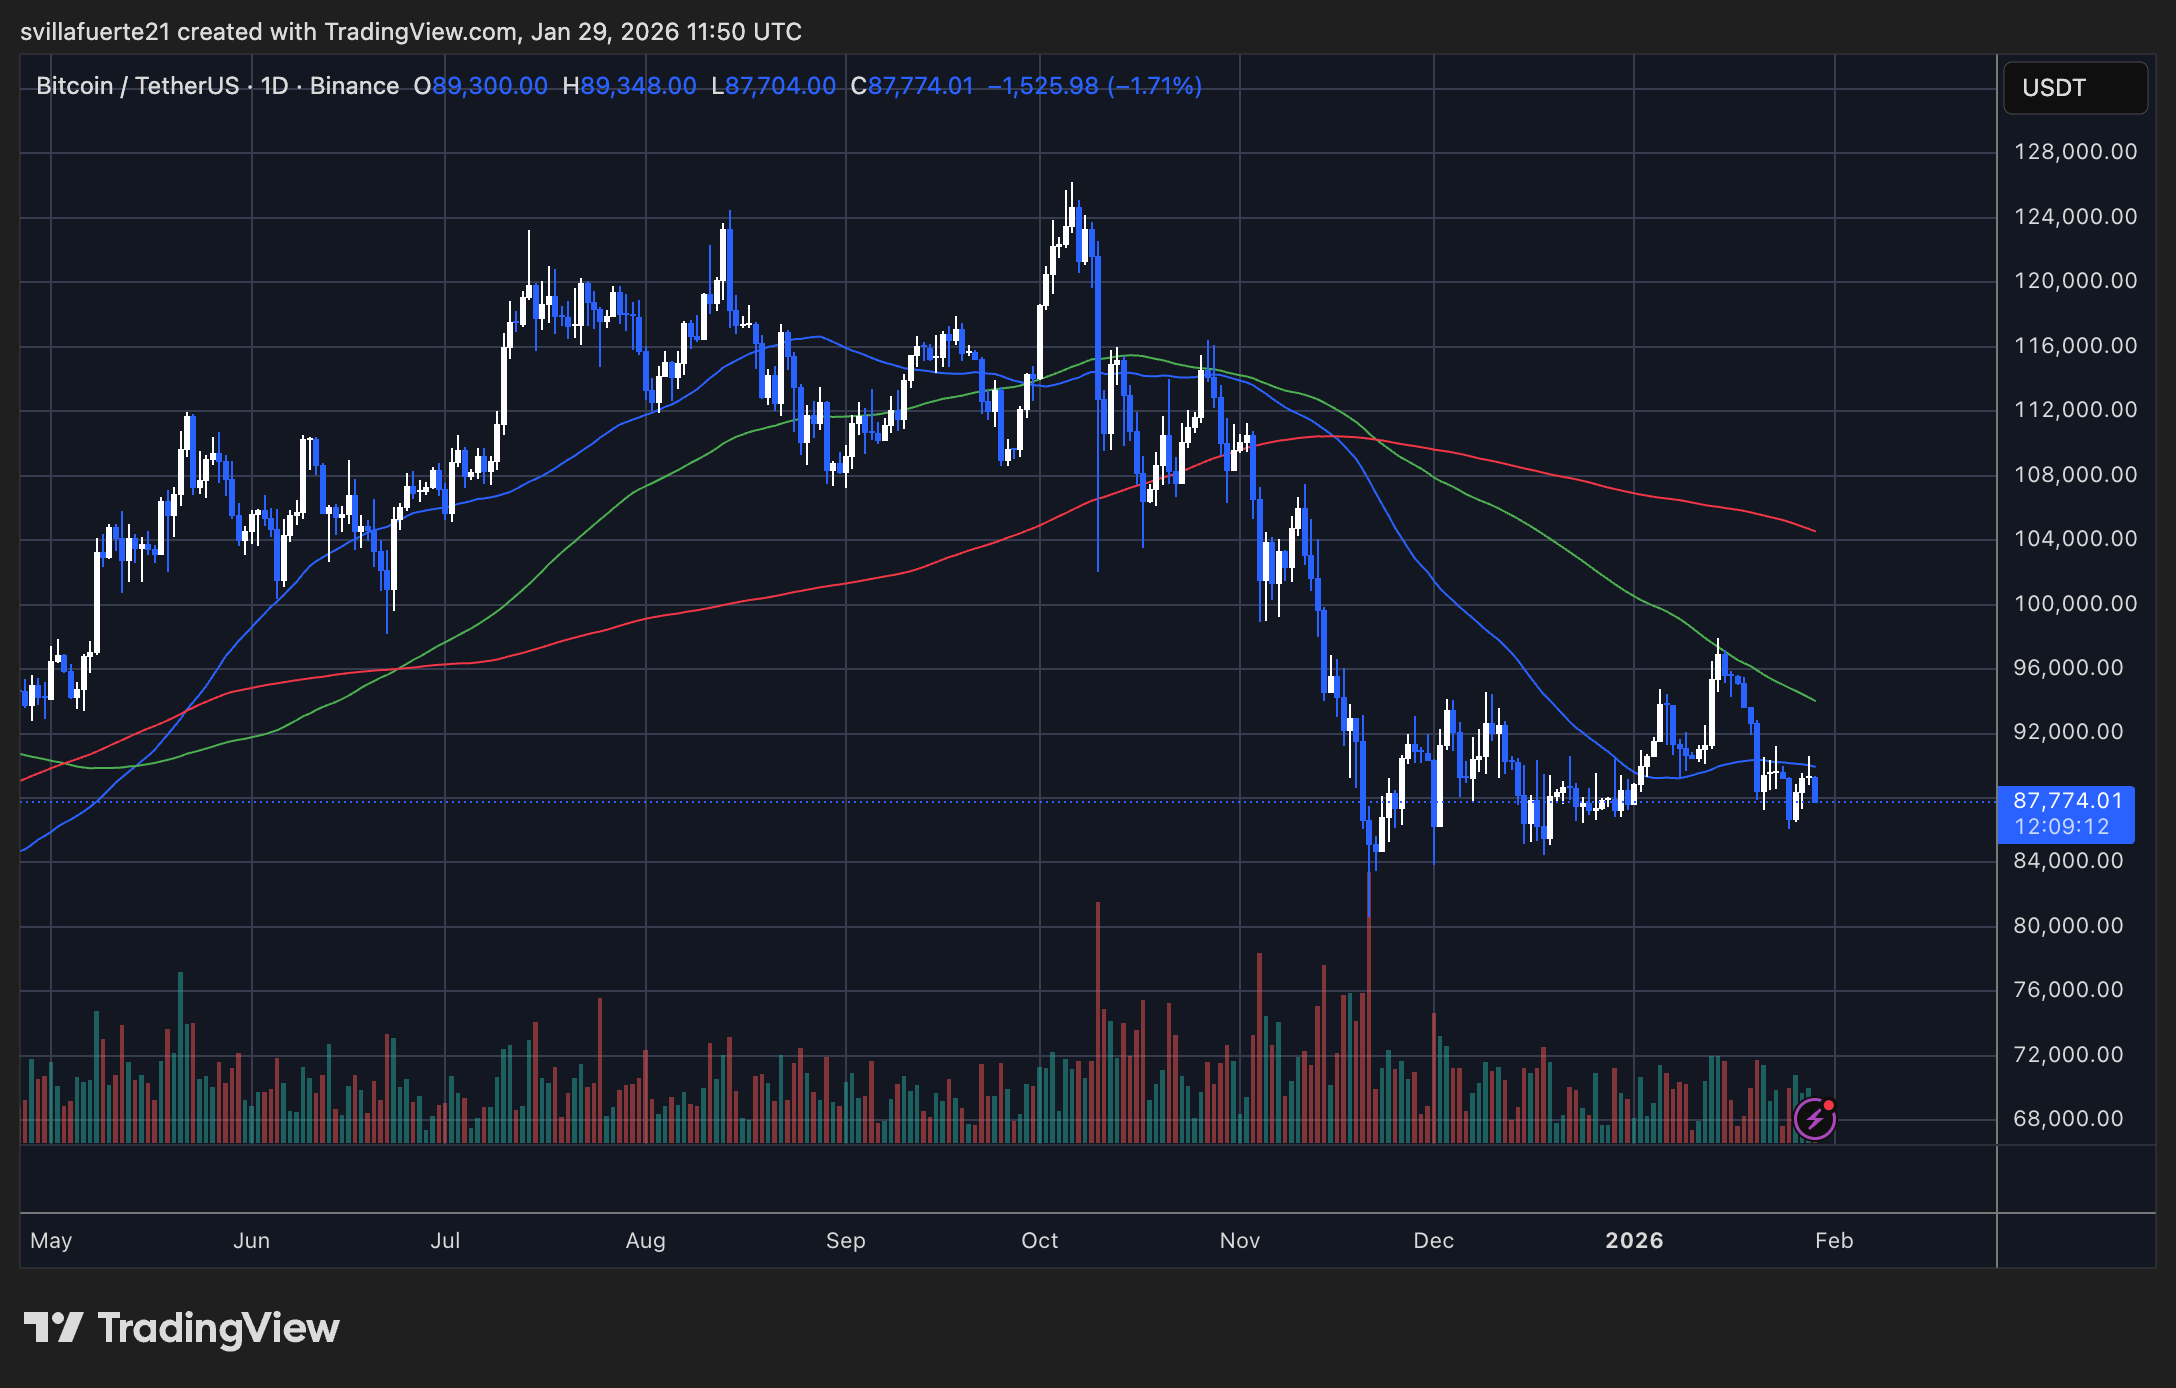 Bitcoin testing critical demand | Source: BTCUSDT chart on TradingViewStructurally, the market is locked in a wide range following the sharp breakdown in November. Since then, price action has been characterized by lower highs and choppy rebounds, suggesting reactive buying rather than sustained demand. The recent bounce toward the mid-$90,000s was rejected precisely at the descending moving average cluster, confirming that sellers continue to defend rallies.
Related Reading: Bitcoin Hashrate Slides: US Cold Wave Knocks Mining Rigs OfflineVolume behavior supports this interpretation. The largest spikes remain associated with sell-offs, while recovery attempts occur on relatively muted volume, pointing to limited conviction from buyers. This imbalance keeps downside risk active, even as price holds above the December lows.
In the near term, the $86,000–$87,000 area remains a key demand zone. A clean breakdown would expose lower structural supports, while holding this level keeps Bitcoin trapped in a prolonged consolidation. Until BTC reclaims its short- and mid-term averages, the chart favors caution rather than trend reversal.
Featured image from ChatGPT, chart from TradingView.com
![]() Editorial Process for bitcoinist is centered on delivering thoroughly researched, accurate, and unbiased content. We uphold strict sourcing standards, and each page undergoes diligent review by our team of top technology experts and seasoned editors. This process ensures the integrity, relevance, and value of our content for our readers.
Editorial Process for bitcoinist is centered on delivering thoroughly researched, accurate, and unbiased content. We uphold strict sourcing standards, and each page undergoes diligent review by our team of top technology experts and seasoned editors. This process ensures the integrity, relevance, and value of our content for our readers.
Disclaimer: The information on this page may come from third parties and does not represent the views or opinions of Gate. The content displayed on this page is for reference only and does not constitute any financial, investment, or legal advice. Gate does not guarantee the accuracy or completeness of the information and shall not be liable for any losses arising from the use of this information. Virtual asset investments carry high risks and are subject to significant price volatility. You may lose all of your invested principal. Please fully understand the relevant risks and make prudent decisions based on your own financial situation and risk tolerance. For details, please refer to
Disclaimer.
Articoli correlati
Bitcoin 8-Hour Average Funding Rate Turns Negative at -0.01%
Gate News message, April 22 — According to Coinglass data, Bitcoin's 8-hour average funding rate across the network currently stands at -0.01%, indicating a slight bearish sentiment among futures traders.
Among major exchanges, funding rates vary: one exchange at -0.0007%, another at -0.0033%, a th
GateNews3h fa
BTC 24H上涨 5.01%,现价 79399.3 USDT
Gate News bot 消息,Gate 行情显示,BTC 24 小时 上涨 5.01%,现价 79399.3 USDT。
CryptoRadar3h fa
MicroStrategy Could Drive Bitcoin to $10M If It Accumulates 7.5% Supply, Saylor Says
MicroStrategy aims for 7.5% of Bitcoin supply, implying $10M per BTC; as of Apr 19 it held 815,061 BTC (~3.88%) for $61.56B, needing ~3.62% more to target saturation in Saylor’s long‑term accumulation plan.
Abstract: MicroStrategy seeks to accumulate roughly 7.5% of Bitcoin supply, a threshold Saylor suggests could push BTC to about $10 million and slow purchases thereafter. By April 19 it owned 815,061 BTC (≈3.88% of supply) for $61.56B and would require about 3.62 percentage points more to reach the target, indicating a approaching saturation of its long-run accumulation strategy.
GateNews4h fa
Bitcoin Liquidation Levels: $28.21B Long Liquidations at $74,951, $16.13B Short Liquidations at $82,741
Gate News message, April 22 — According to Coinglass data, if Bitcoin falls below $74,951, cumulative long liquidations across major centralized exchanges would reach $28.21 billion.
Conversely, if BTC breaks above $82,741, cumulative short liquidations across major CEXs would reach $16.13 billion.
GateNews5h fa
Bitcoin and Ethereum Spot ETFs Record Consecutive Net Inflows; BTC ETFs Reach $99.08B in Assets
Abstract: Bitcoin and Ethereum spot ETFs posted net inflows on Apr 21, extending multi-day streaks. BTC inflows were led by BlackRock’s IBIT and Grayscale, with GBTC outflows; ETH inflows were led by ETHA, with ETHE outflows.
Summary: Bitcoin and Ethereum spot ETFs posted Apr 21 inflows, extending gains; BTC led by IBIT and Grayscale with GBTC outflows, NAV $99.08B (6.54%). ETH inflows topped by ETHA, ETHE outflows; NAV $13.66B, inflows $12.05B.
GateNews6h fa
Expert Observes a Bullish 90-Day Bitcoin Pattern Repeating, BTC Could Hit $145,000 ATH Target
Expert observes a bullish 90-day Bitcoin pattern repeating.
He declares accumulation phase complete and expects manipulation phase to start.
BTC could hit $145,000 ATH target in the final distribution phase.
The crypto market has been moving in an upwards direction after weeks of
CryptoNewsLand6h fa